Looking under the hood of U.S. auto ABS
Portfolio Managers John Kerschner and Nick Childs discuss why they see an attractive yield opportunity in auto asset-backed securities (ABS).

5 minute read
Key takeaways:
- Auto ABS currently offer a spread premium of about 35 basis points (bps) over similarly rated short-duration credit. This makes them a compelling source of yield in an environment where corporate valuations appear stretched and interest rates are expected to decline.
- While subprime auto loan delinquencies have risen to recession-like levels, prime borrowers – representing roughly 75% of the auto ABS market – remain on solid footing. Recent bankruptcies in the auto sector are viewed as idiosyncratic rather than indicative of systemic consumer credit weakness.
- The U.S. ABS market is large, diverse, and inefficient, offering opportunities for skilled managers to exploit pricing discrepancies. Selectivity is key, particularly in subprime auto loans, where older vintages have shown stronger performance compared to newer ones.
The relative value opportunity
In the post-COVID era, and particularly since early 2022, asset-backed securities (ABS) have offered a meaningful spread pickup relative to corporate bonds of similar rating and duration. Auto ABS – the largest subsector at 38% of the entire U.S. ABS market – pays a spread premium versus similar AA-rated credit, as shown in Exhibit 1.
Given that prime consumer loans make up roughly 75% of the U.S. auto ABS market, we believe the market is in much better shape than some news headlines may imply. As a result, we believe the excess spread income (currently around 35 bps) is a key source of yield and an important contributor to total return in an environment where corporate valuations look rich and rates are projected to fall.
Exhibit 1: Spread differential: Auto ABS vs. short-duration AA rated credit (2015-2025)
Auto ABS pays an attractive spread premium over similarly rated short-duration credit.
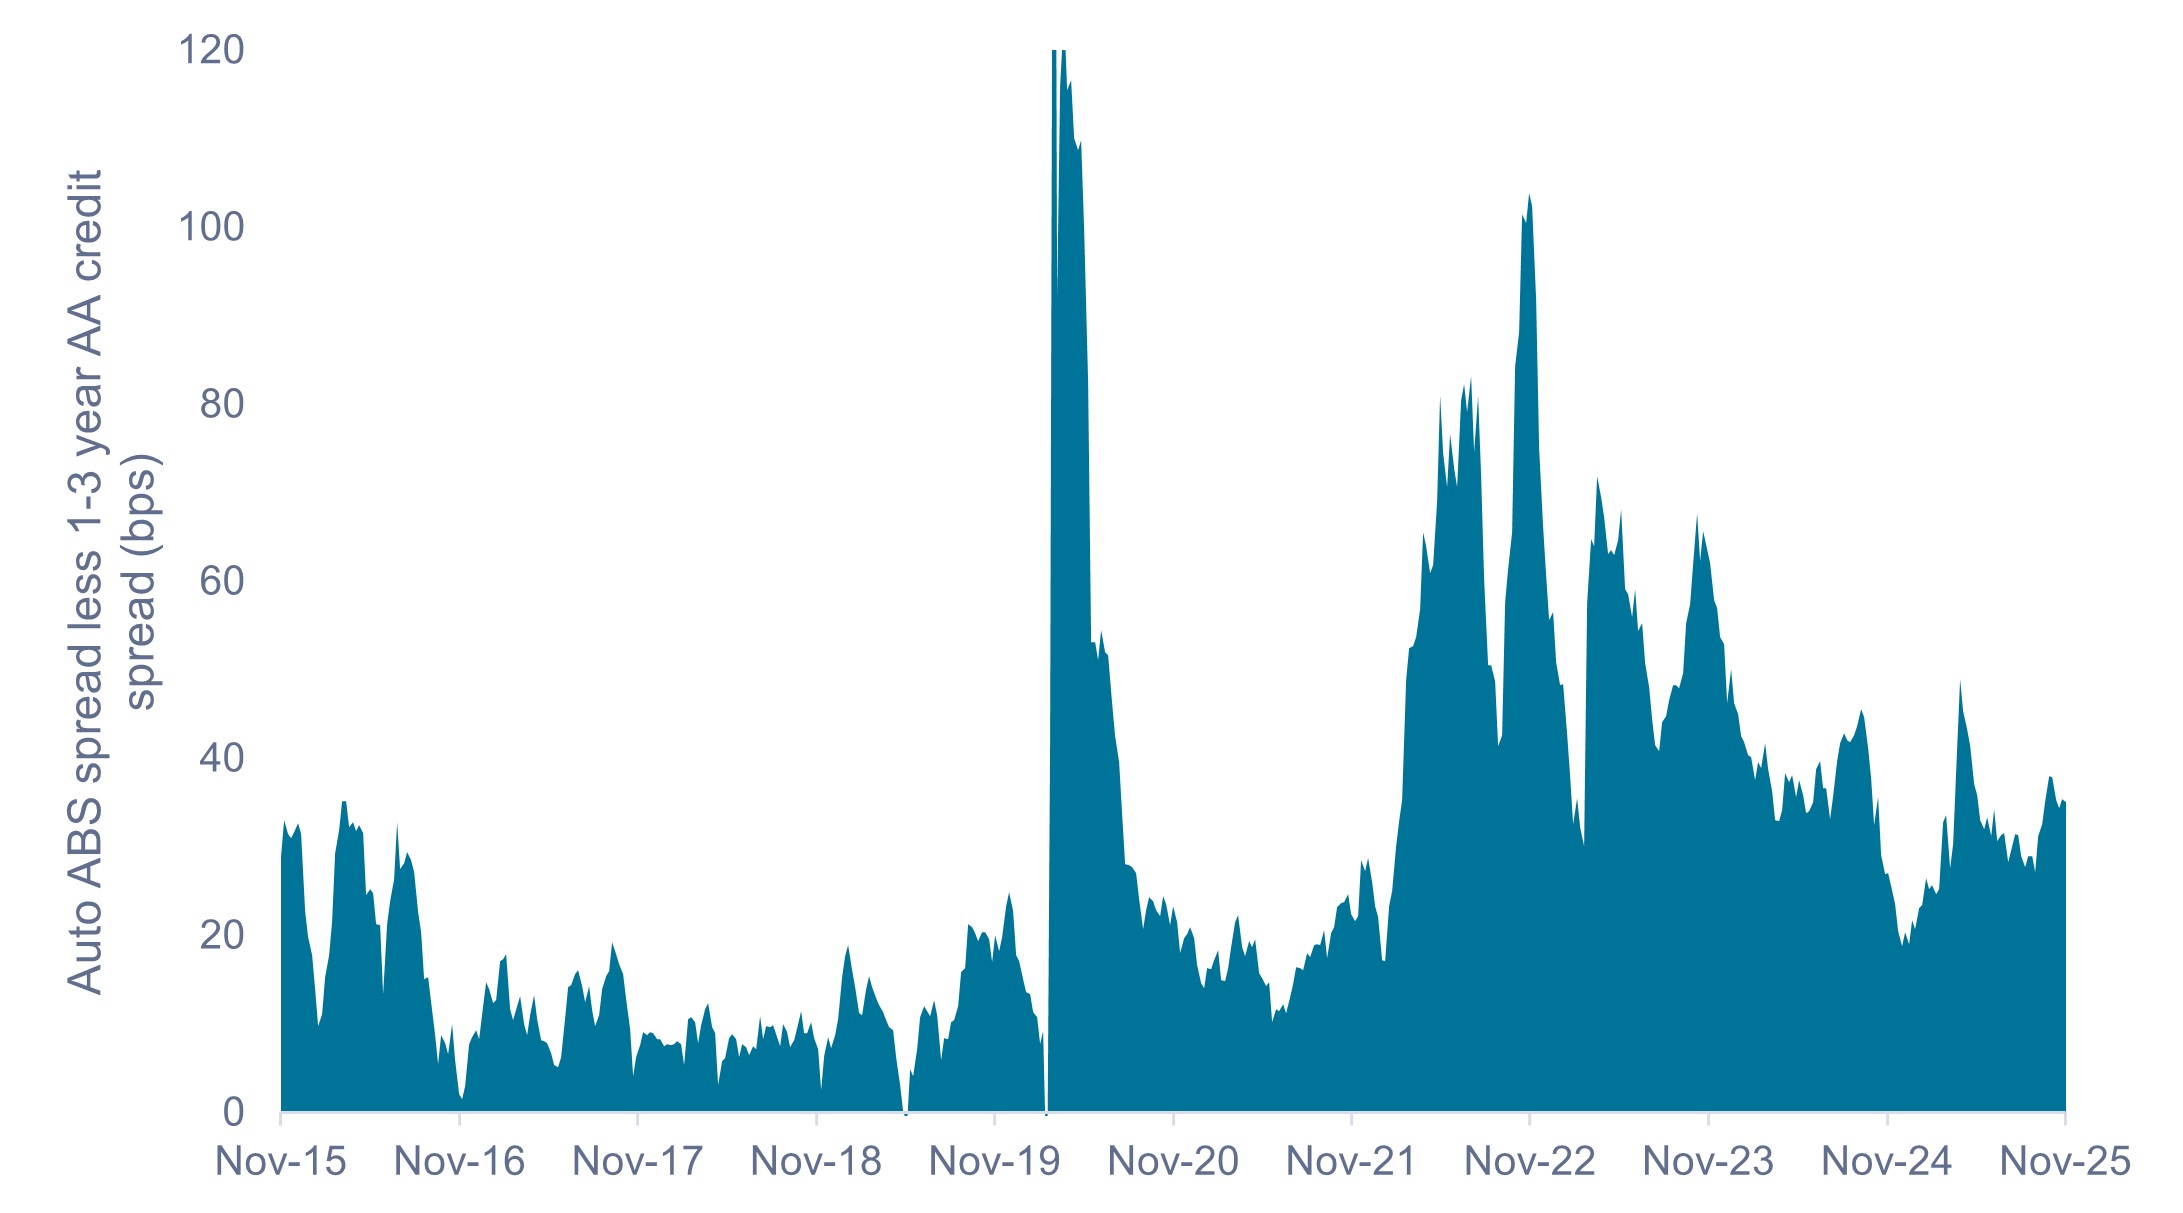
Source: Bloomberg, as of 30 November 2025. Spread differential based on option-adjusted spreads for the Bloomberg ABS Auto Index, which carries a AA+/AA average credit rating, and the Bloomberg U.S Credit 1-3 Year AA Index. Past performance does not predict future results.
Credit protections and selectivity may allay investor concerns
The recent bankruptcies of auto parts manufacturer First Brands and auto lender Tricolor have left some investors spooked and asking whether these events are an early warning sign for consumer credit. In our view, these two credit events were idiosyncratic in nature and unrelated to the health of the underlying consumer.
Even though delinquency rates on subprime auto loans have risen to recession-like levels, we do not see evidence of broader weakness in consumer credit markets, particularly among prime-rated consumer loans, as shown in Exhibit 2.
Exhibit 2: Auto ABS delinquency rates: prime vs. subprime (2001-2025)
The prime consumer (75% of the auto ABS market) remains on solid footing despite subprime stress.
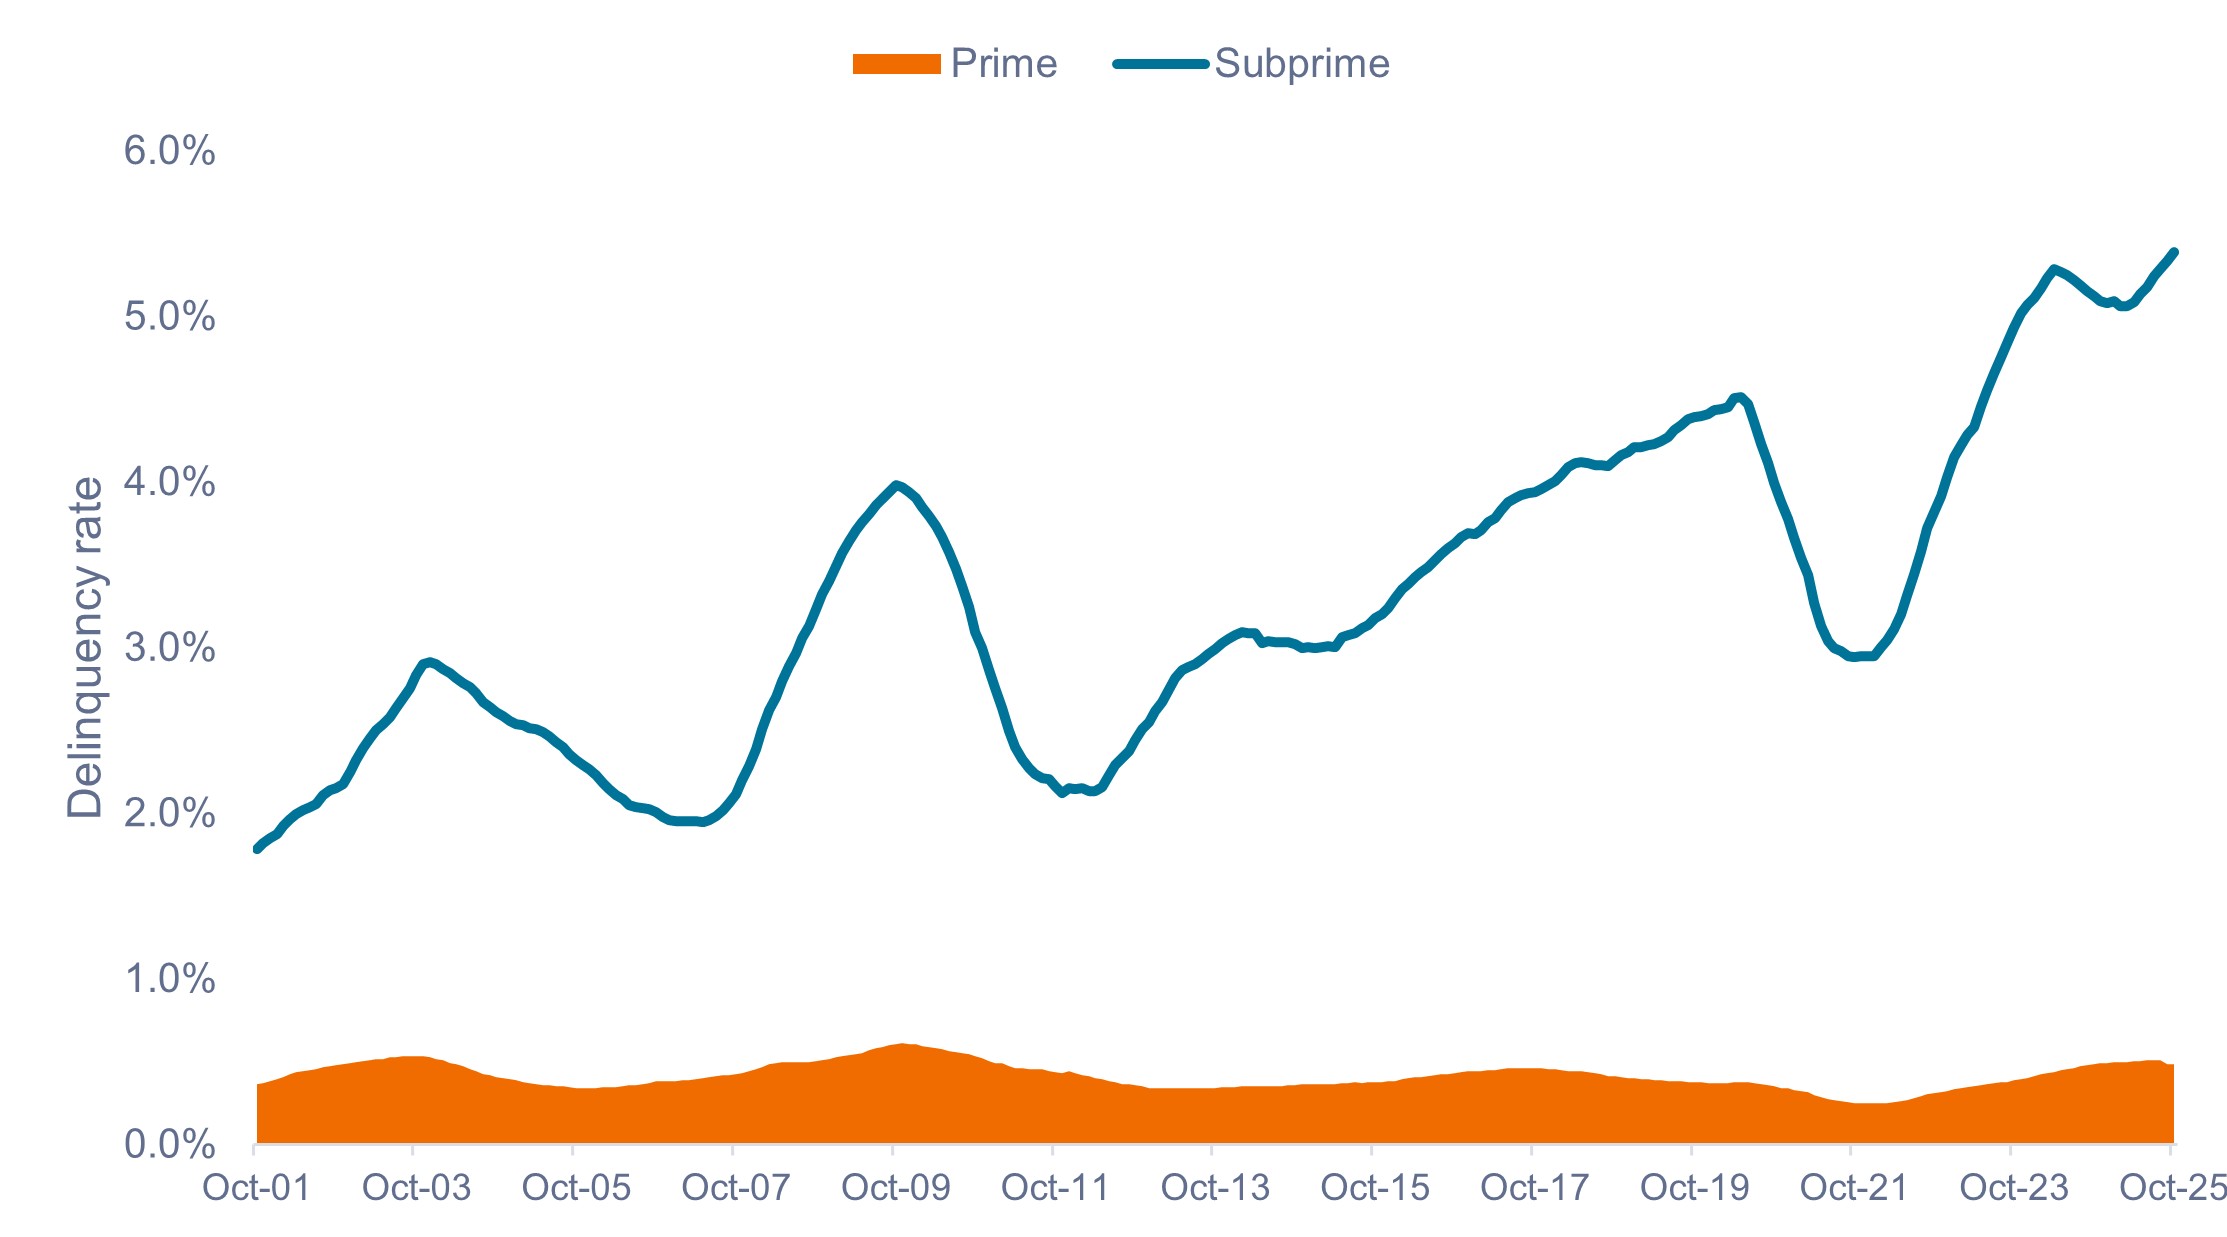
Source: Intex, Goldman Sachs Investment Research, as of 31 October 2025. Chart shows trailing 12-month moving average of share of balances 60 days or more past due. Borrower credit scores: Subprime <620, prime >660.
While the ABS asset class’s excess premium may reflect anxieties regarding the financial health of U.S. households, we believe these concerns create an opportunity for active managers to acquire high-quality income-generating assets with strong structural protections at attractive prices.
Additionally, ABS structures today are substantially more robust than those issued before 2010, with stricter underwriting standards and higher levels of subordination that offer greater protection against losses.
Active management holds the key
While we prefer to keep subprime exposure to a minimum, even within subprime auto we see selective opportunities if one digs below the surface. Despite a rise in subprime delinquencies in aggregate, not all deal vintages exhibit the same default rates.
As shown in Exhibit 3, the 2020 and 2021 subprime pool performance has been far stronger than the 2022-2025 vintages. This was largely due to pandemic-related relief programs and a sharp rise in car prices, which created significant positive equity in the 2020/2021 loans.
Exhibit 3: Nonprime auto cumulative net losses by deal vintage and deal age (2020-2025)
Subprime loans originated in 2020/2021 have outperformed those originated in later years.
 Source: Intex, as of 1 October 2025. Past performance does not predict future results.
As the 2020 and 2021 loans continue to pay down, their contribution to the overall mix is diminishing. The aggregate subprime index is now more concentrated in the 2022–2025 vintages, which have higher levels of default.
Subprime auto ABS is also evolving because the major issuers (such as Santander, AMCAR, and Westlake, which historically have had excellent performance) are issuing less, or not at all. If they do issue ABS they are issuing investment-grade (IG) bonds exclusively because they have access to cheaper alternative financing versus issuing below-IG tranches. Essentially, while the overall subprime auto ABS market is still targeting the same consumers, less of the market is coming from the historically strongest issuers in the space.
While index-level data shows a rise in default rates due to the changing vintage mix, active managers may seek to avoid troubled spots and exploit pricing inefficiencies by focusing on older vintages with better credit metrics.
Exhibit 4: Subprime auto loan index by vintage weight and 30+ days past due (DPD) rate
Strong-performing loans are becoming a smaller share of the index, leading to a rise in the DPD rate.
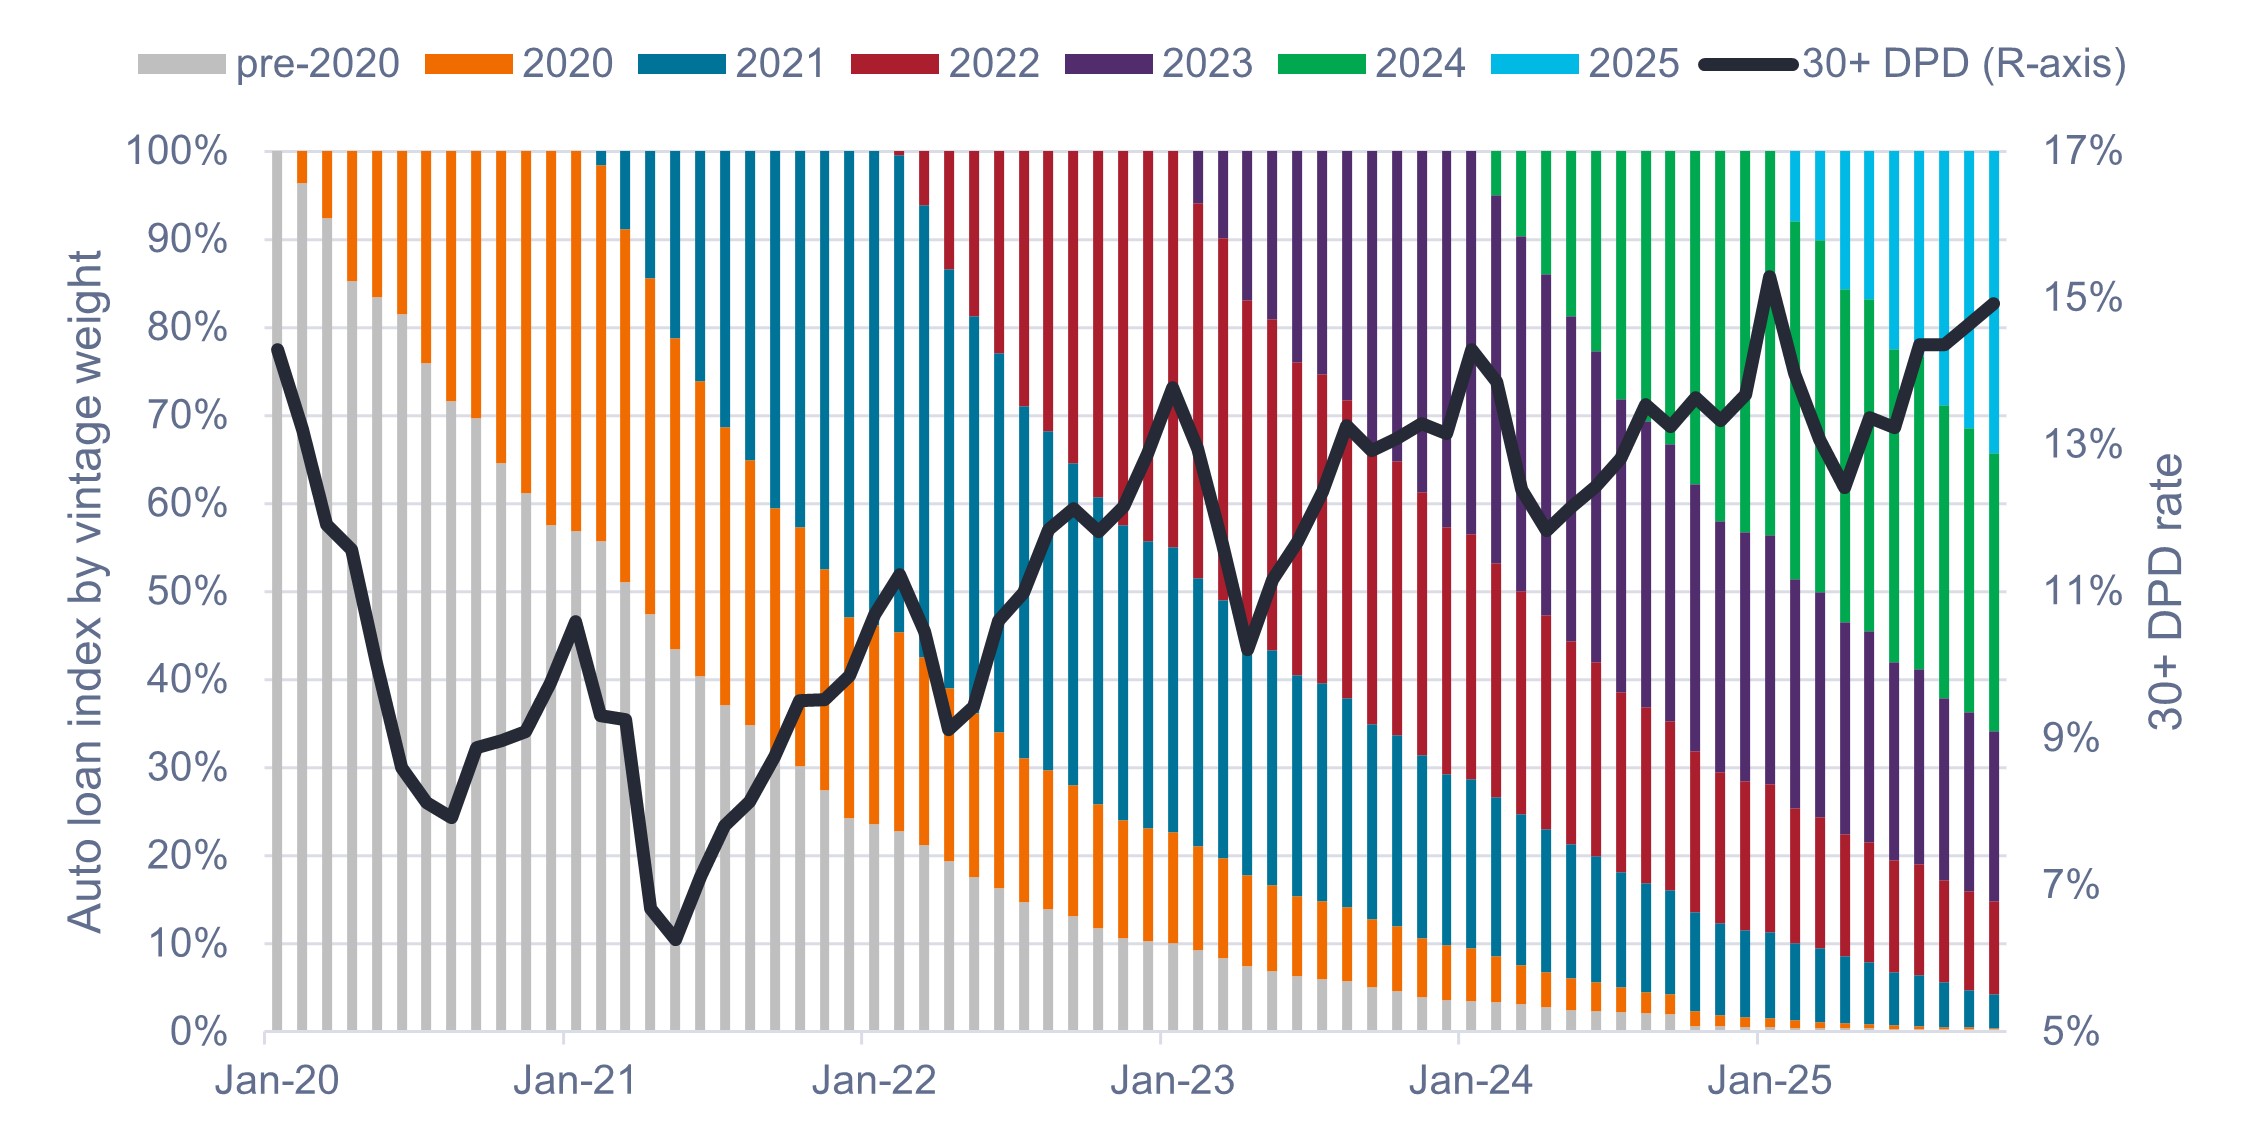
Source: Intex, as of 31 October 2025. Vintages refer to deal vintages, which may not fully align with origination vintages, but should serve as a reasonable proxy.
In summary
The $800 billion U.S. ABS market presents a large, diverse, and inefficient opportunity suited to active management, with lower correlation to equities and offering a spread premium over traditional credit. We believe ABS may be a smart way to diversify fixed income exposure while seeking capital preservation and current income.
Given the Bloomberg U.S. and Global Aggregate Bond Indexes have de minimis exposure to the ABS market, at 0.5% and 0.2%, respectively, investors will need to be intentional about their exposure to ABS and seek out experienced active managers with a proven track record of investing in securitized markets.
IMPORTANT INFORMATION
Actively managed portfolios may fail to produce the intended results. No investment strategy can ensure a profit or eliminate the risk of loss.
Fixed income securities are subject to interest rate, inflation, credit and default risk. The bond market is volatile. As interest rates rise, bond prices usually fall, and vice versa. The return of principal is not guaranteed, and prices may decline if an issuer fails to make timely payments or its credit strength weakens.
Securitized products, such as mortgage-backed securities and asset-backed securities, are more sensitive to interest rate changes, have extension and prepayment risk, and are subject to more credit, valuation and liquidity risk than other fixed-income securities.
The Bloomberg Global Aggregate Bond Index is a broad-based measure of the global investment grade fixed-rate debt markets.
The Bloomberg US Aggregate Bond Index is a broad-based flagship benchmark that measures the investment grade, US dollar-denominated, fixed-rate taxable bond market. The index includes Treasuries, government-related and corporate securities, MBS (agency fixed-rate pass-throughs), ABS and CMBS (agency and non-agency).
The Bloomberg U.S. Asset-Backed Securities (ABS) Index is a broad-based flagship benchmark that measures the investment grade, US dollar denominated, fixed-rate taxable bond market. The index only includes ABS securities.
The Bloomberg US 1-3 Year AA Index measures the performance of AA rated, US dollar-denominated, fixed-rate, taxable corporate and government-related debt with 1 to 2.9999 years to maturity. It is composed of a corporate and a non-corporate component that includes non-US agencies, sovereigns, supranationals and local authorities.
Correlation measures the degree to which two variables move in relation to each other. A value of 1.0 implies movement in parallel, -1.0 implies movement in opposite directions, and 0.0 implies no relationship.
Credit quality ratings are measured on a scale that generally ranges from AAA (highest) to D (lowest).
Diversification is a common investment strategy that entails buying different types of investments to reduce the risk of market volatility.
Duration measures a bond price’s sensitivity to changes in interest rates. The longer a bond’s duration, the higher its sensitivity to changes in interest rates and vice versa.
Investment-grade securities: A security typically issued by governments or companies perceived to have a relatively low risk of defaulting on their payments. The higher quality of these bonds is reflected in their higher credit ratings when compared with bonds thought to have a higher risk of default, such as high-yield bonds.
All opinions and estimates in this information are subject to change without notice and are the views of the author at the time of publication. Janus Henderson is not under any obligation to update this information to the extent that it is or becomes out of date or incorrect. The information herein shall not in any way constitute advice or an invitation to invest. It is solely for information purposes and subject to change without notice. This information does not purport to be a comprehensive statement or description of any markets or securities referred to within. Any references to individual securities do not constitute a securities recommendation. Past performance is not indicative of future performance. The value of an investment and the income from it can fall as well as rise and you may not get back the amount originally invested.
Whilst Janus Henderson believe that the information is correct at the date of publication, no warranty or representation is given to this effect and no responsibility can be accepted by Janus Henderson to any end users for any action taken on the basis of this information.
5 minute read
Key takeaways:
- Auto ABS currently offer a spread premium of about 35 basis points (bps) over similarly rated short-duration credit. This makes them a compelling source of yield in an environment where corporate valuations appear stretched and interest rates are expected to decline.
- While subprime auto loan delinquencies have risen to recession-like levels, prime borrowers – representing roughly 75% of the auto ABS market – remain on solid footing. Recent bankruptcies in the auto sector are viewed as idiosyncratic rather than indicative of systemic consumer credit weakness.
- The U.S. ABS market is large, diverse, and inefficient, offering opportunities for skilled managers to exploit pricing discrepancies. Selectivity is key, particularly in subprime auto loans, where older vintages have shown stronger performance compared to newer ones.


