October flash crash: What’s driving the bond market?


9 minute read
Bond markets again have been tested in October with wild daily swings in bond yields leaving market participants rudderless on the future direction of interest rates. Given the significant developments and the implications for asset allocation, Jay Sivapalan, Head of Australian Fixed Interest provides his observations and how the team are navigating this environment.
The great pandemic recovery
First and foremost, it’s worth framing where we are in the economic cycle in the context of a one in 100-year pandemic, which has seen an unprecedented set of public health orders and an economic slowdown/stop. This was matched by an equally unprecedented monetary and fiscal response.
2020 was, for the most, part a ‘lockdown’ year, while globally 2021 has been a ‘reopening’ year. For Australians, a ‘false start’ earlier has meant that we’re only now joining major economies on this reopening phase. While somewhat delayed, most importantly it is now happening. This will likely mean a catchup phase as we once again make up for time lost in lockdown, with strong economic growth prospects as we move into 2022.
From an economic perspective, we are in a vibrant cyclical recovery phase. Economic growth, corporate profitability, tax base and revenue, employment and household income are all expected to improve.
Chart 1: GDP contributions (percentage points)
Economic recovery delayed, not lost – Q3 2021 negative on lockdowns, rebound expected as lockdowns lifted.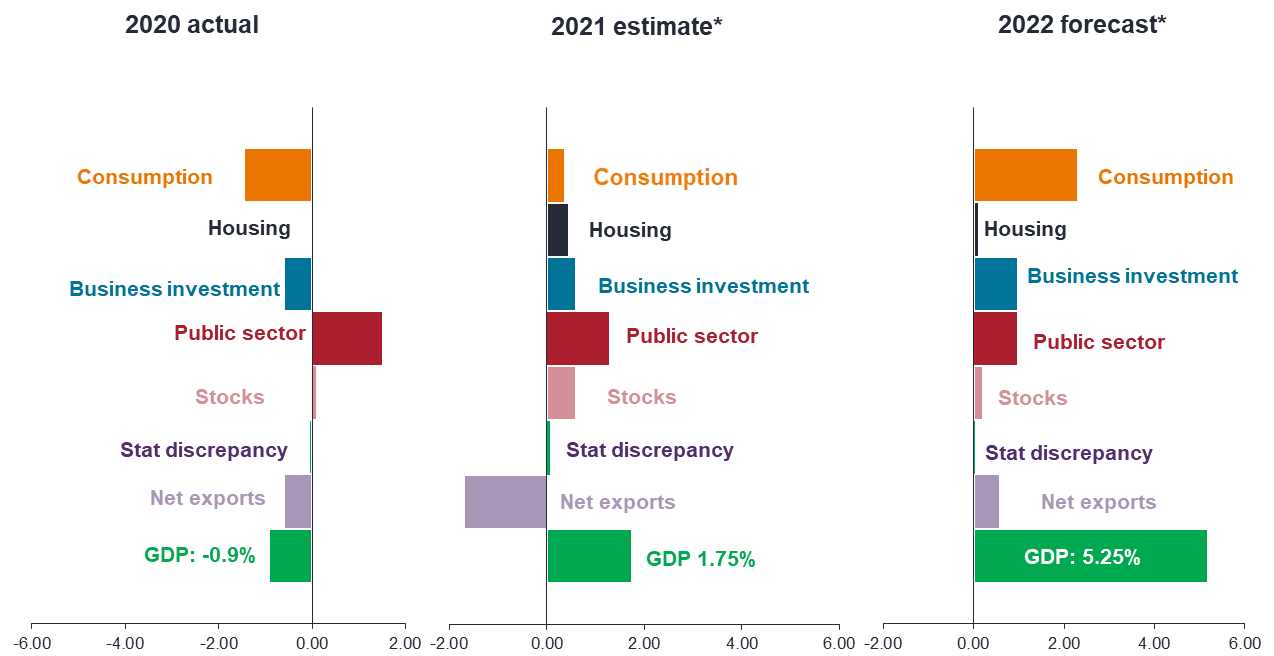
Source: ABS, last actual June quarter 2021, # ppt = percentage point. Note: *Janus Henderson Investors forecasts of y/y GDP growth with percentage point contributions from GDP components. Forecast numbers are estimated projections only based on internally generated research.
Typically, in early stages of growth cycles, markets can expect to see a shift in expectations of:
- A higher longer-term interest rate structure
- A higher longer-term inflation outlook
- A global cash rate tightening cycle
Bringing this back to asset class performance, 2020 was the period in which growth assets struggled initially (albeit this was short-lived) in the midst of the pandemic, while defensive assets (such as fixed interest) preserved capital and performed strongly. This year, as can be expected during this ‘recovery’ phase of the economic cycle, the opposite is occurring, with growth assets, boosted by better earnings prospects, performing strongly, while defensive asset returns are much more lacklustre. However, the overall outcome for a diversified portfolio investor is a good one.
Chart 2: Asset sector returns: daily cumulative returns (%)
2021: Risk-on buoyed by economic recovery – asset classes exhibit typical growth recovery story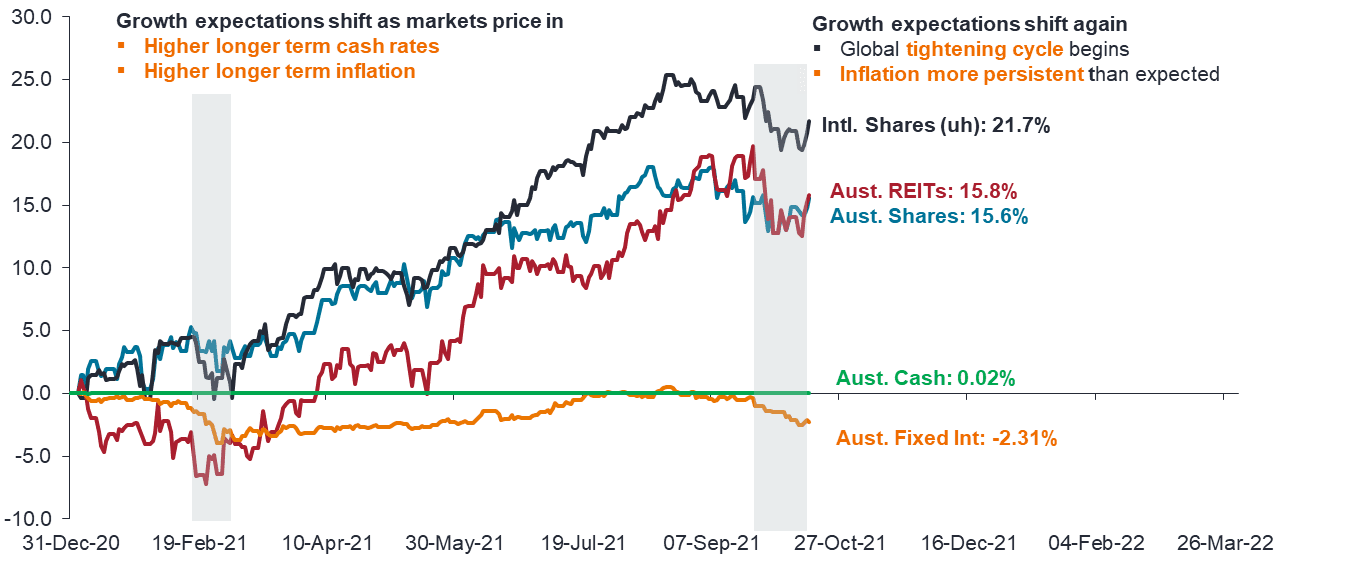
Source: Bloomberg. Daily cumulative returns to 15 October 2021. Note: Aust. shares = S&P/ASX 300 Accum. Index; Intl. shares = MSCI World (ex Aust) Accum. Index – unhedged; Aust. REITs = S&P/ASX 300 Property Accum. Index; Aust. Fixed Interest = Bloomberg AusBond Composite Bond Index (All Maturities); Aust. Cash = Bloomberg AusBond Bank Bill Index.
The October flash crash
A combination of pro-growth, pro-cyclical factors, along with an easing in public movement restrictions, high vaccination rates amongst developed economies and supply chain issues have been quickly embedded into market pricing of bonds. These have been primarily driven by:
- A swift shift in expectations of central banks to tighten ultra-easy monetary policy and normalise (Bank of England being the most recently vocal)
- Inflation expectations lifting on more persistent and ‘sticky’ inflation from the transitory narrative
- Longer-term risk premia being built back in, for inflation risk
While other advanced economies such as the US, UK, Canada, New Zealand and a range of Asian economies are about to (or have) commenced tightening monetary policy, the shift in expectations have been very swift. The chart below shows the market expectation for cash rates at various times, including February 2021 (when the bond market delivered a -3.5% return), August 2021 (when markets settled back) and October 2021. This current substantial lift in cash rate expectations is also shown below:
Chart 3: Australian cash rate and implied OIS forward 1m cash rate (%)
RBA policy shift ‘data’ not ‘date’ dependent – Market expectations shift to early lift-off, too early in our view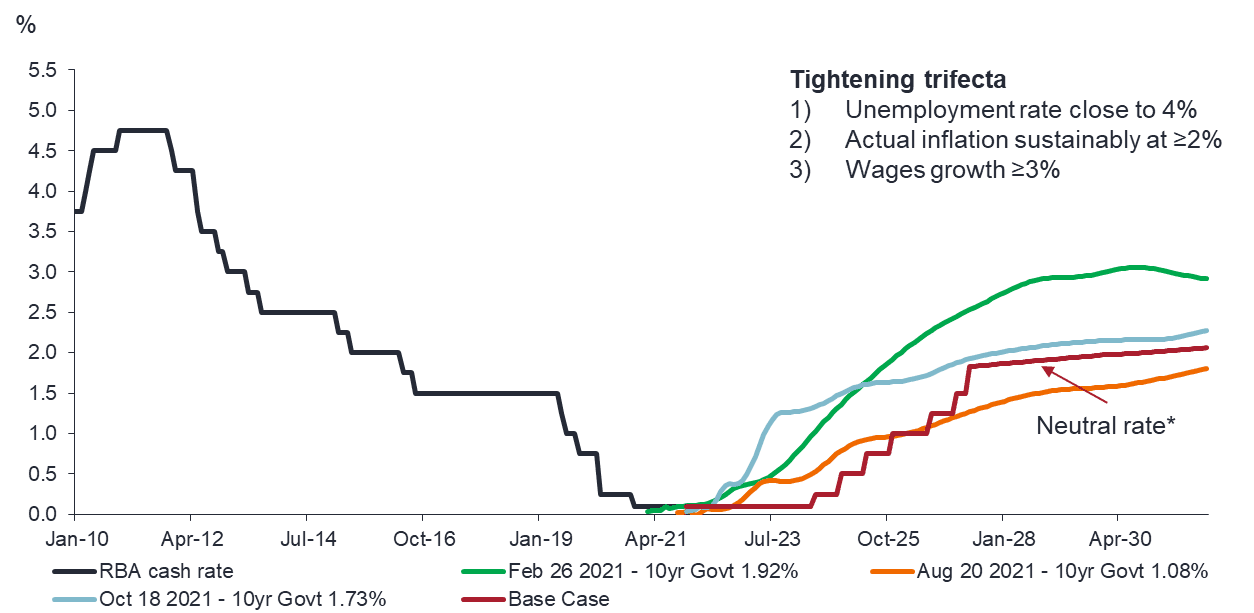
Source: Janus Henderson Investors, Bloomberg, monthly to end September 2021. Note: Base case forecast and neutral rate is generated from internally generated research.
The key differences between February and October:
- The most obvious and curious aspect of this sell-off episode in bond markets is not necessarily how much yields have lifted on average, but rather the shape of expectations, especially as compared to February. As can be seen between the green and blue lines. The market’s expectations of cash rates in the distant future (beyond 2025) is, in our assessment, quite reasonable and less of an overshoot as compared to February’s sell-off episode. Conversely, it is the speed, magnitude and very near-term (almost imminent) aggressive cash rate tightening currently priced in that we are questioning.
- Does the Reserve Bank of Australia (RBA) have the same pressure and motive to normalise rates quickly like other advanced economies? Have the ‘tightening trifecta’ conditions (Unemployment rate close to 4%; Actual inflation sustainably above 2%; And, wages growth >3%) been met, or are likely to be met very soon? In many ways, we can see the first two conditions being met next year but the last one is more elusive. That’s not to say that as the economy re-opens, labour market conditions over 2022 couldn’t tighten and eventually lead to wages growth lifting above 3% in a more sustained fashion.
- However, at this moment in time, our assessment is that the tightness in the labour market and ensuing wages inflation in the very near-term is sufficiently different in Australia to those other advanced economies contemplating tightening monetary policy, such as the US. And yet, cash rate tightening expectations in Australia and the US are quite similar. As such, we feel the markets have overshot in pockets of the bond yield curve, but not necessarily as broad based as in February after which the bond yields retraced downwards, delivering investors very strong bond returns.
Where’s the value?
Given the lift in bond yields has not been consistent across the yield curve and shorter end yields have lifted much more than longer-term yields (yield curve flattening), in our assessment, the shorter-term maturities are offering investors compelling value on some, even if only partial, retracement back while longer-term valuations are more muted and still at some risk of markets overshooting to the other side.
Australian bond markets, similar to other developed economy bond markets, now have a very steep yield curve, but in our assessment, lack the fundamentals to fully support it. From an investor’s perspective, the benefit of steep yield curves is the additional carry (yield) for moving out along the yield curve, the higher roll down as a five-year bond becomes a 4-year bond over the next 12 months, for example, and finally capital gains owing to moves should markets reassess the RBA’s tightening cycle to something more reflective of Australian economic fundamentals.
Chart 4: Government return expectations – 12 months forward
Government bonds: Roll and carry – Value presenting in the front end of the curve
- Base Case: 3 year and 10 year government bond yields are 0.35% and 1.77% respectively in 12 months. This represents a 0.29% steepening in the yield curve.
- High Case: 3 year and 10 year government bond yields are 0.48% and 1.94% respectively in 12 months. This represents a 0.47% steepening in the yield curve.
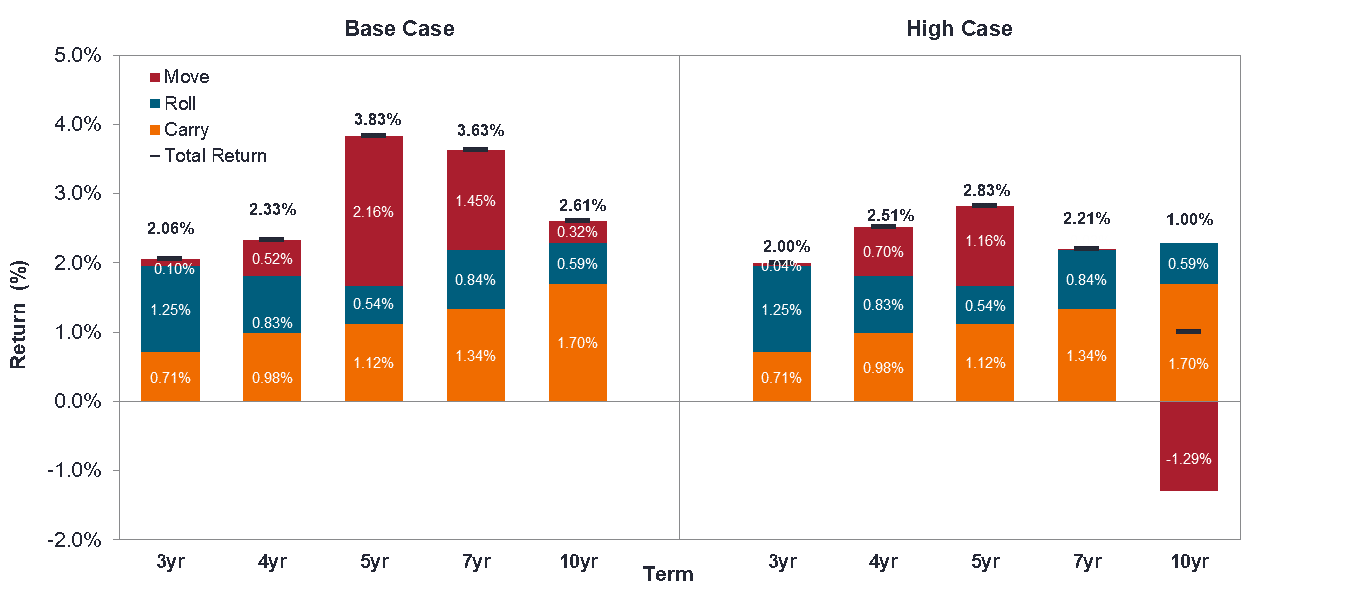
Source: Janus Henderson, Bloomberg, as at 18 October 2021. Note: Return expectations are subject to change without notice and cannot be guaranteed.
Focusing on terms from three to seven years, even if only half of these returns are delivered over the next year, it is in our assessment a far better outcome for investors than sitting in cash at 0.1%. Admittedly, there’s some volatility to be had as markets flirt with different scenarios of tightening cycles and the potential for the current sell-off to extend further, but capital overall is preserved and there’s now a healthy buffer that has been built in Australian short end yield curves.
In short, the narrative of ‘rising rates’ has now been priced into shorter-term risk-free (government) bond yields. This should ensure higher returns from bond markets, but it is unlikely that this will be broad-based.
Navigating the current environment
As bond markets price in a ‘normalisation’ (it is debatable what post-pandemic ‘normal’ looks like), the building in of expectations is typically painful for bond investors. This calendar year (up to the time of writing) the bond market in Australia has delivered circa -3%. Not a great absolute outcome for investors. However, it was to be expected and, in the context of strong growth asset class returns, has been an overall favourable period for diversified investors. The key to navigating this environment is ensuring that the active investment strategies employed favour and prioritise capital preservation first and foremost, then pursue positive return opportunities.
The best way to deal with the current bond market environment is to very carefully manage interest rate risk. In short and put simply:
- Reduce and constrain interest rate risk (duration) when bond yields are rising
- Nimbly take on interest rate risk (duration) when yields have lifted to satisfactory levels and the total expected return from higher yields, roll down and expected fall in yields comfortably exceed cash returns.
One of the Funds (the Janus Henderson Tactical Income Fund), where active duration management is employed, is shown below for illustrative purposes:
Chart 5: Duration of the Tactical Income Fund and Benchmark*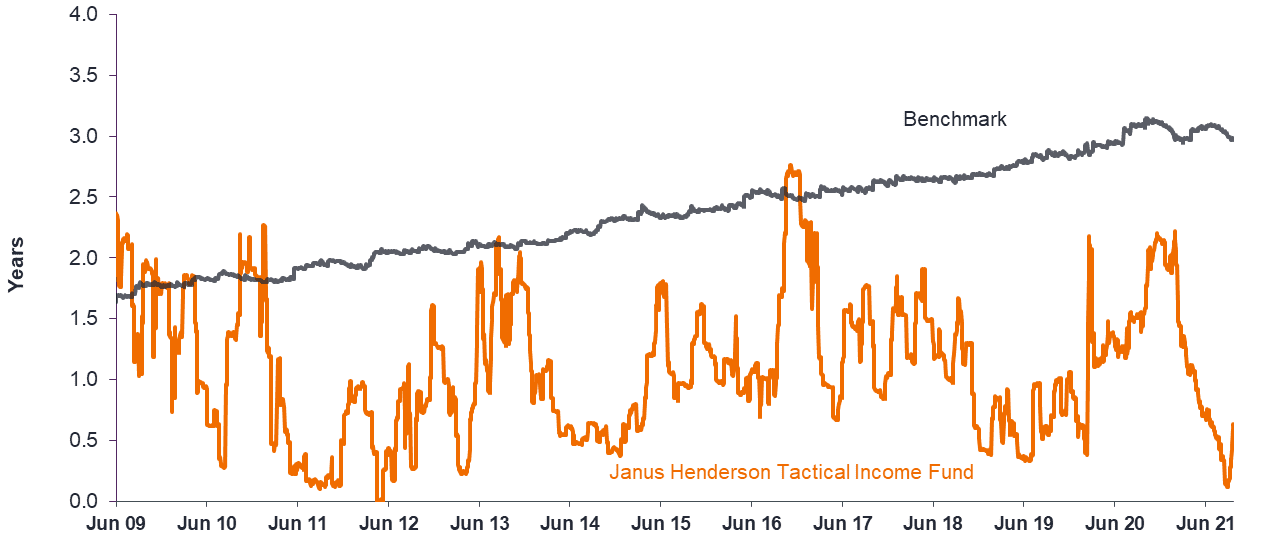
Source: Janus Henderson as at 20 October 2021. *Benchmark = Bloomberg AusBond Composite 0+ Yr Index and Bloomberg AusBond Bank Bill Index (Equally weighted).
Looking forward
Value is being restored into the fixed interest asset class, albeit not uniformly. This needs to be actively assessed and navigated. But investors do now have more risk-free yields to work with as a base in building even higher yielding portfolios as shown in the charts below:
Chart 6: Movements in generic government bond yields (Basis points)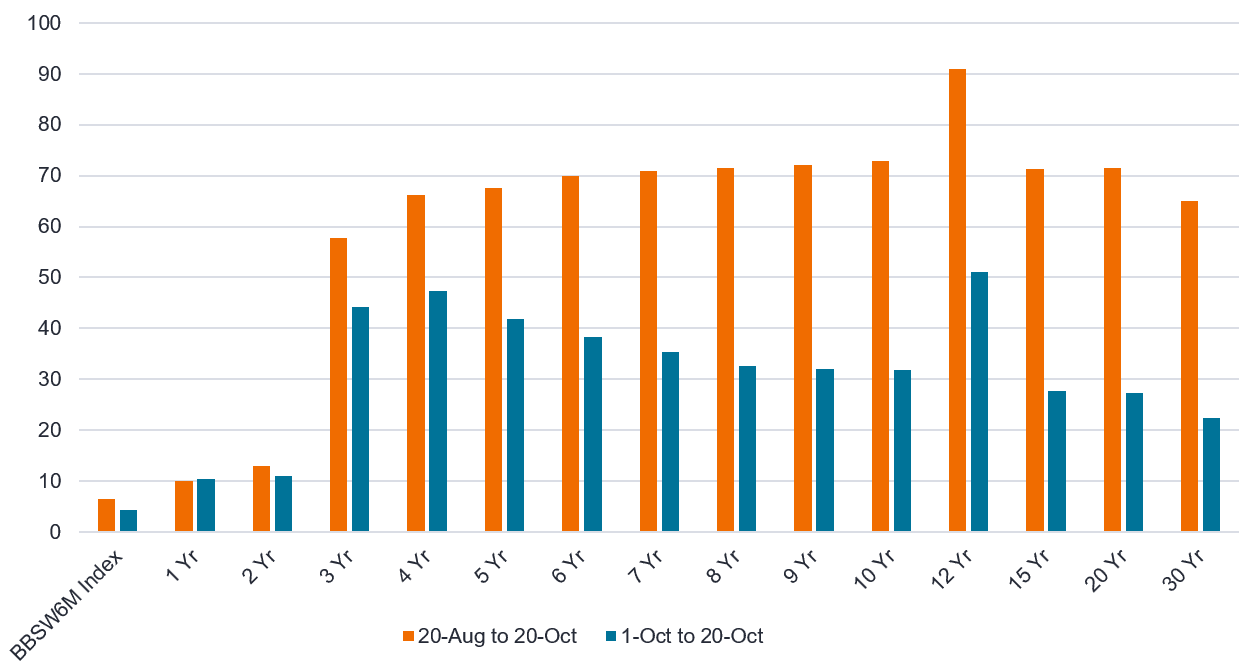
Source: Janus Henderson, Bloomberg as at 20 October 2021.
Australian Government Bonds can be complemented with state government debt, corporate debt and asset backed debt, which all provide additional income above and beyond the rates discussed above. Overall, the yield to maturity of bond portfolios has lifted meaningfully. Active management across a full spectrum of rates strategies, relative value, inflation protection, sector allocation and credit sub-sector management all have potential to add value above and beyond the yield to maturity of bond portfolios for investors. This is fertile ground for full spectrum active managers, but the choice of active tools (duration, curve, RV, inflation, sector, credit sub-sector), sizing of active positioning and getting the strategy (direction) right remains key.
As bond yields lift, some key attributes are restored for the whole asset class, providing higher potential future income and returns and, in the next crisis, providing a higher potential positive return driven by greater capacity for capital gains from falling bond yields.
![]() Don’t miss the
Don’t miss the
latest insights from
Janus Henderson
on LinkedIn. Follow
This information is issued by Janus Henderson Investors (Australia) Institutional Funds Management Limited (AFSL 444266, ABN 16 165 119 531). The information herein shall not in any way constitute advice or an invitation to invest. It is solely for information purposes and subject to change without notice. This information does not purport to be a comprehensive statement or description of any markets or securities referred to within. Any references to individual securities do not constitute a securities recommendation. Past performance is not indicative of future performance. The value of an investment and the income from it can fall as well as rise and you may not get back the amount originally invested.
Whilst Janus Henderson Investors (Australia) Institutional Funds Management Limited believe that the information is correct at the date of this document, no warranty or representation is given to this effect and no responsibility can be accepted by Janus Henderson Investors (Australia) Institutional Funds Management Limited to any end users for any action taken on the basis of this information. All opinions and estimates in this information are subject to change without notice and are the views of the author at the time of publication. Janus Henderson Investors (Australia) Institutional Funds Management Limited is not under any obligation to update this information to the extent that it is or becomes out of date or incorrect.