Strategic Fixed Income: Central banks in 2022 – making long bonds great again
The beginning of 2022 has set up our long anticipated clash between hawkish central banks reacting to peak inflation numbers, and our own macro investment process forecasting lower bond yields over the course of 2022.


5 minute read
Key takeaways:
- We monitor, and project out, the pace of accelerations or decelerations in economic data – rather than the actual ‘level’, in order to judge the directionality and magnitude of bond yield moves.
- Come spring 2022, this approach is anticipating a collapse in the year-on-year rate of change of the economic data in the US, reflecting the exceptional strength of its economy in the prior year.
- The long overdue shift to a hiking cycle from developed world central banks may mark the end, rather than the beginning of the sell-off in government bonds, which dates back to August 2020.
In this short note we will discuss why, since August 2021, we have been flagging early 2022 as the potential cyclical high in bond yields, when this seems so at odds with the narrative of higher interest rates and government bond yields that you will read about in the media. Indeed, we think the long overdue shift to a hiking cycle from developed world central banks is providing an opportunity to add duration (interest rate sensitivity)/government bond exposure and may mark the end, rather than the beginning of the sell-off in government bonds, which dates back to August 2020.
We have been patiently waiting for this moment for the last five months. It is likely to provide a classic case study of the truism that, it is the bond market (which correctly anticipates turning points in the economic cycle) that drives the US Federal Reserve (Fed)’s decisions – and not the other way around.
First a recap: our cyclical process for managing government bond exposure
We monitor and project out the second derivative* of economic data, ie, the pace of acceleration or deceleration in the data – rather than the actual ‘level’, in order to judge the directionality and magnitude of 10‑year and longer‑dated bond yield moves.
We have published a more detailed discussion of this approach in the past. In a post-COVID crash world, there are enormous base effects driving sharp inflections in the year-on-year rate of change of economic data, which have caused sharp narrative shifts in markets… from reflation to stagflation and soon, slowdown.
Indeed, come spring 2022, our approach is anticipating a collapse in the year-on-year rate of change of economic data in the US, reflecting the exceptional strength of the economy in the prior year – based on the reopening of the economy in spring 2021, stimulus measures to combat the consequences of the pandemic and the peak in the reflation narrative.
Using our rate of change model, which our quantitative analyst Dillan Shah maintains and develops, the forecast of the collapse in bond yields comes with one of the highest degrees of certainty in many years, driven by these extreme base effects. Inflation is the most obvious example of this inflection point but it applies equally to the growth data.
Our rate of change model’s forecast is complemented by mainstream analysis
While monitoring these kind of inflection points in economic momentum can provide us with an edge against linear economic narratives based on extrapolating recent trends, we look for confirmation of potential turning points by complementing this approach with macro processes focused on forecasting the demand side of the global economy.
Note, we are driven by process, not narratives. These approaches predominantly focus on the global goods cycle (as services cycles are so muted) relative to historical trends. Some of the most common data that investors would examine include Purchasing Managers’ Indices (PMIs) and the Institute for Supply Management (ISM) manufacturing reports’ inflection points, utilising lead indicators like new orders versus inventories, Organisation for Economic Co-Operation and Development (OECD) lead indicators and monetary (ie, interest rates and exchange rate) conditions.
Further confirmation of this comes from our Economic Adviser, Simon Ward, who recently wrote on the subject (www.moneymovesmarkets.com, ‘Has the Fed called the top in growth (again)?’,19 January 2022).
A sharp mean reversion from peak manufacturing PMIs is already in train and crucially, we have now passed the peak of the inventory cycle. Inventories boosted US growth in Q4, contributing 4.9 percentage points to the headline real GDP data. GDP growth depends on the rate of change of stockbuilding (ie, the second derivative). Stockbuilding may remain high in Q1 but as long as it is lower than Q4 it will contribute negatively to GDP growth.
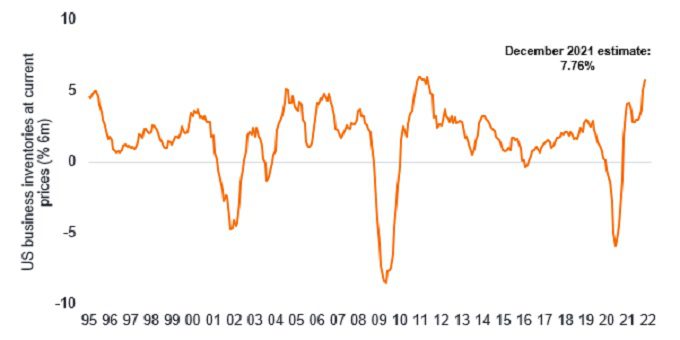
Source: Simon Ward, Economic Adviser, Refinitiv Datastream as at November 2021
Bond markets likely to provide a rude awakening
The Fed seems blind to this slowdown, which is already in train, blaming any recent weakness on the Omicron variant of COVID‑19. Indeed, Chairman Powell struggled to articulate downside risks to the US economy at his 26 January press conference, citing only further COVID variants.
In summary, none of what I have articulated in this note should be a surprise to our investors as it is process driven and forecastable in advance. We have laid out our thinking for many months and came into this year with a decade low level of interest rates sensitivity in our strategies, seeking to use an early 2022 rise in bond yields to look for opportunities to extend duration.
The kind of set‑up we have today, in which central banks are reacting aggressively – and late, to a sharp peak in coincident economic data, is the kind of opportunity that bond investors wait years to see. The consensus narrative of higher bond yields is overly focused on this lagging indicator and bond markets are likely to provide a rude awakening.
These are the views of the author at the time of publication and may differ from the views of other individuals/teams at Janus Henderson Investors. References made to individual securities do not constitute a recommendation to buy, sell or hold any security, investment strategy or market sector, and should not be assumed to be profitable. Janus Henderson Investors, its affiliated advisor, or its employees, may have a position in the securities mentioned.
Past performance does not predict future returns. The value of an investment and the income from it can fall as well as rise and you may not get back the amount originally invested.
The information in this article does not qualify as an investment recommendation.
Marketing Communication.
5 minute read
Key takeaways:
- We monitor, and project out, the pace of accelerations or decelerations in economic data – rather than the actual ‘level’, in order to judge the directionality and magnitude of bond yield moves.
- Come spring 2022, this approach is anticipating a collapse in the year-on-year rate of change of the economic data in the US, reflecting the exceptional strength of its economy in the prior year.
- The long overdue shift to a hiking cycle from developed world central banks may mark the end, rather than the beginning of the sell-off in government bonds, which dates back to August 2020.