High yield bonds: five factors behind current spread levels
Credit spreads have widened but with recession fears in the air Brent Olson and Tom Ross, two of our high yield portfolio managers, look at five factors currently keeping them in check.


11 minute read
Key takeaways:
- Inflation is driving central bank decision-making, and the sharp policy response and jump in yields means rate moves have tended to dominate over spread moves.
- Spreads have moved wider but are more indicative of a shallow recession rather than a deeper one. Spreads may not be unreasonable if default rates stay in line with market expectations, although further volatility could emerge as liquidity conditions remain challenging.
- The high yield market is better quality and more diverse than in previous downturns and with limited near-term refinancing needs, high yield looks more technically supported.
Determining the direction of high yield bonds is challenging given that they are being buffeted by unruly moves in government bonds. Added to this are worries about the prospect of recession, which the US Federal Reserve (Fed) and other central banks have openly admitted may be required to rein in inflation. High yield bonds, with their greater sensitivity to corporate conditions, have responded to concerns about a weakening economy, with credit spreads (the difference between the yield on corporate bonds and government bonds of similar maturity) widening and yields climbing.
As Figure 1 shows, yields on US high yield bonds have reached attractive levels, hovering around 9.5% since the end of September 2022, although a significant proportion of this reflects the move up in yields on US Treasuries, symptomatic of inflation concerns and the monetary policy tightening by the Fed. Spreads have widened, but it could be argued that at around 500 basis points (bps) they are far from pricing in a deep recession. In fact, they are below the 700 bps levels seen during the 2015 Energy Crisis when the oil price collapsed, triggering a difficult period for indebted exploration and production companies.
Figure 1: Yields on US high yield bonds have been as much rate driven as spread driven
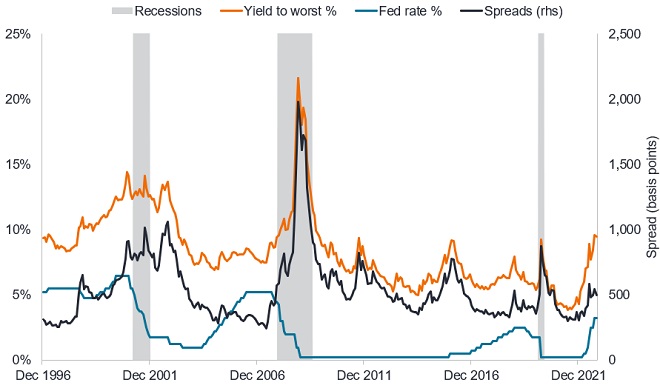
Source: Bloomberg, NBER US recession periods (shaded period), ICE BofA US High Yield Index yield to worst (%), US Federal Reserve Fed Funds Rate (upper bound, %), ICE BofA US High Yield Index govt option-adjusted spread (basis points), 31 December 1996 to 21 October 2022. Basis point (bp) equals 1/100 of a percentage point. 1 bp = 0.01%, 100 bps = 1%. Yields may vary and are not guaranteed.
Dismantling the rates effect from the credit effect is challenging. Bad news becomes good news as the market clings to the notion that weak economic data may precipitate a Fed pivot. This premise can last for a while, but often the bad economic news catches up with corporates and defaults (the failure to meet repayments on bonds) ensue. We see this in Figure 1, where spreads continued to gap wider into each recession even as the Fed is busy cutting rates, trying to undo the lagged economic damage from earlier tightening. It should be noted, however, that the zero interest rate policy in the last two recessions had an exaggerated effect on spread movements as Treasury yields were repressed.
So why are spreads not wider?
There are several mitigating factors at work.
First, it is worth recognising that spreads have moved quite a bit in a short time frame already. US high yield spreads at around 500 bps in late October 2022 are some distance off their lows of 300 bps reached in 2021 and double the lows reached in 1997 and 2007. In fact, they are above the average of 453 bps of the last 10 years and just under the long run average of 542 bps.1 With US headline consumer price inflation running at 8.2% for September 2022 and US high yield offering a yield of 9.5% it is one of the few asset classes with a yield outpacing inflation, although any defaults will eat into that.2
So how worried should we be about defaults? US defaults in 2020 totalled US$74 billion (a 7% default rate), followed by less than US$6 billion in 2021 (a 0.4% default rate).3 The end 2022 default rate may be around 1.7% but 2023 is anticipated to be higher – Bank of America, for instance, estimates the US high yield default rate to reach 6% in 2023. This includes US$20 billion on its watchlist and potentially up to $53 billion in distressed capital structures out of a US high yield market that is more than US$1.2 trillion in size.3
If we assume a 6% default rate (with a 40% recovery rate, i.e. what creditors might get back), this gives a true default rate of 3.6% (6% x 0.6). Add on a liquidity premium (additional spread to compensate for potential difficulty in trading in volatile markets) of around 325-350 bps and this could make the case for spreads to be at 625-650 bps and we have been hovering around 500 bps. In other words, as defaults occur, spreads could hit the 600-650 bps range and this is historically reflective of a lot of bad news and a great buying opportunity. Of course, a severe recession or collapse in market sentiment could see the default rate and spreads gap higher, although again, this has often proved a good buying opportunity.
There is no guarantee that past trends will continue or forecasts will be realised.
Decent fundamentals albeit deteriorating
Second, the fundamentals are currently good. On average, US high yield gross leverage (debt as a proportion of earnings) is at 3.6 times earnings, around the lows of the last decade, while interest cover is at an all-time high since 2002, with earnings able to cover interest expense by 5.8 times.4
At this point, readers need reminding that credit fundamentals typically look good heading into recession as corporate ratios are flattered by peak earnings. Yet high yield is also well represented in sectors such as energy that are currently benefiting from the inflation in oil and gas prices. Moreover, earnings have held up reasonably well as broader inflation has provided cover for raising prices, although we anticipate earnings deteriorating as consumers and businesses increasingly baulk at absorbing price increases and rising input costs bite. For now, however, the consumer is holding up (even if in surveys they are emphasising the hardship from rising prices).
Figure 2: Real US personal consumption expenditure still holding up
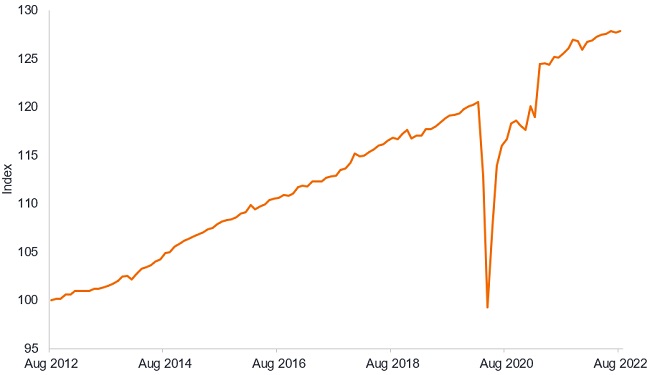
Source: FRED, US Bureau of Economic Analysis, Real personal consumption expenditures (chain-type quantity index), 31 August 2012 to 31 August 2022. Index where August 2012 = 100.
More rate sensitive sectors such as housebuilding and commercial real estate are already feeling the pain of tighter financial conditions but the transmission to other sectors is proving more gradual. This might seem mystifying but given that many developed market countries only fully removed COVID restrictions this year we are still seeing strength in the service sector. We were surprised not to see more deterioration in the recent Q3 2022 quarterly earnings. This has given a reprieve to equity markets as the more resilient earnings in the price/earnings (P/E) ratio means the derating of equities may have run its course for now (or until a pattern emerges of companies disappointing).
Equity markets and high yield bonds typically share a positive correlation (i.e. move directionally with each other), so any calm in equity markets is likely to prevent spreads from widening. A key test may be the festive sales and whether companies mark down their outlooks in the next earnings round.
Supportive technicals
A third factor is supportive technicals (the demand and supply environment) caused by the relatively low supply of high yield bonds. A peculiarity of the current credit backdrop is that the COVID crisis occurred so recently. Companies embarked on financing at a time when authorities were keen to make it accessible and cheap. As such, many companies have termed out their debt at relatively low rates. Both in the US and Europe heavier levels of refinancing are not scheduled to hit until 2025.5 Figure 3 demonstrates the low dollar amount of maturities due in 2023 and 2024 for US high yield. It is part of the reason the default cycle and default percentage (while rising) should not in the next two years hit alarming numbers even in a recession.
Figure 3: US high yield refinancing pipeline is low near term
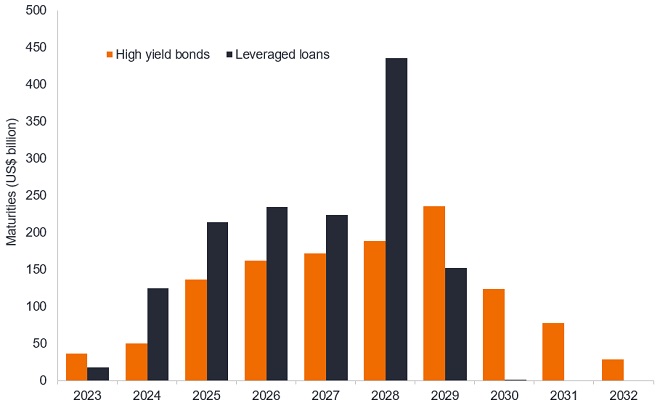
Source: BofA Global Research, 30 September 2022.
What is more, bonds set to mature in the next two years are heavily weighted towards BB issuers, which, as stronger credits, typically have more room to manoeuvre to finance near term maturities than CCC rated borrowers.
The COVID crisis also precipitated a big wall of downgrades from investment grade in 2020 so many of the more vulnerable investment grade companies have already been downgraded, potentially limiting the number of fallen angels (bonds downgraded from investment grade to high yield) if the economic slowdown is not too deep. Low high yield bond issuance, coupled this year with strong volumes of rising stars (bonds upgraded to investment grade), means the resultant negative net supply is offsetting some of the reduced risk appetite for high yield, keeping spreads in check.
Bearish sentiment means the market is also underweight high yield and this is causing some sharp bear market rallies. This is because investors who are short can be forced to buy to lock in gains or prevent losses from their position.
Better quality market
Fourth, both the US and European high yield markets are better quality today than in previous downturns, leading to an improvement across high yield globally. There is a much larger weighting of higher quality BB rated bonds (the area of high yield closest to making the move up into investment grade) while the proportion of CCC rated bonds – those most vulnerable to default – has decreased. The spread range within BB rated bonds tends to be much tighter which is again a contributing factor in explaining why spreads are not widening aggressively.
Figure 4: Ratings quality has improved in high yield globally
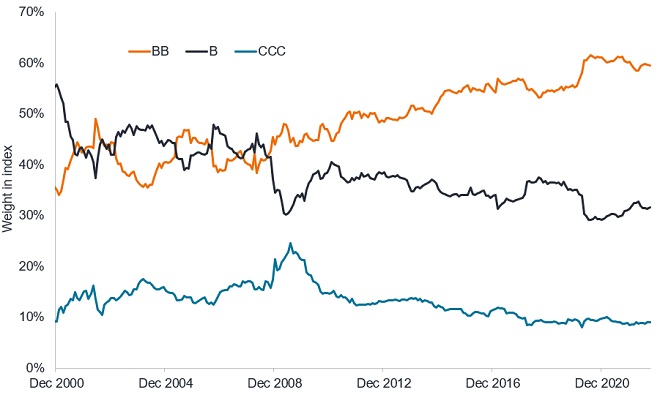
Source: ICE BofA Global High Yield Index, full market value in US dollars, 31 December 2000 to 30 September 2022.
Market diversity – no problem child
Fifth, unlike in previous downturns there has not been a sector where leverage has grown aggressively. Debt build-up can often signal impending problems. In previous recessions those sectors where borrowing had grown rapidly became most exposed when the downturn took hold.
It was no coincidence that telecoms and media had the biggest high yield sector weights going into the 2001 Technology, Media, Telecoms (TMT) bubble. Similarly, energy was the largest sector at the end of 2014 as we headed into the 2015 Energy Crisis as the oil price collapsed. Automotive was the biggest sector heading into the 2007-09 Global Financial Crisis (GFC) but given that auto loans companies made up two-thirds of the weight of the automotive sector it is clear to see linkages with the excessive lending elsewhere that characterised the GFC. The 2020 COVID recession was unusual in having such an exogenous factor in the pandemic.
Figure 5: US high yield sector weights at start of previous downturns
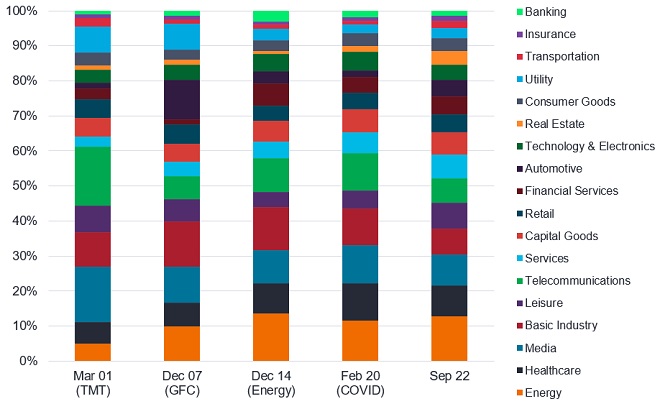
Source: Bloomberg, ICE BofA US High Yield Index constituents at month end for each specified date period, 30 September 2022.
US high yield at the end of September 2022 shows a more diverse constituency make-up today than in any of the previous downturns. It is a similar story in Europe where the euro high yield benchmark, represented by the ICE BofA Euro High Yield Bond Index, is more diversified than in previous crisis periods such as the GFC or the Greek and eurozone debt crises.
Caution warranted
Taken together, this means credit risk may be more idiosyncratic and those areas that suffer are likely to be more cyclically exposed. Investors will need to carefully discriminate, actively selecting those issuers with strong business models, pricing power and the ability to withstand a slowdown.
Lead economic indicators are pointing to recession across much of the developed world. It is likely that at some point as gloomy data dominates and earnings crack, investors will have to ride through a period of heightened volatility and illiquidity, conditions that can send spreads wider. These spikes tend to be short-lived and typically offer an attractive entry point for high yield investors. Few people time the market perfectly, however, and for those who have already seen a rapid cheapening in high yield, the all-in yields of 9% and more offer some compensation for being patient, assuming defaults do not blow out excessively. In fact, it is not inconceivable that the upward pressure on yields from central bank tightening could begin to subside in 2023 if progress is made in bringing down inflation.
1Source: Bloomberg, ICE BofA US High Yield, Govt OAS, spread at 21 October 2022, 10-year average is spread between 30 September 2012 and 30 September 2022, long-run average is spread between 31 December 1996 and 30 September 2022, using monthly datapoints.
2Source: Bloomberg, CPI Urban Consumers year-on-year inflation rate for September 2022, Bureau of Labor Statistics; Yield to worst for BofA US High Yield Index at 21 October 2022.
3Source: Bank of America, 5 October 2022. Forecasts are estimates, may vary over time and are not guaranteed.
4Source: Morgan Stanley, US quarterly chartbook, data as at end Q2 2022, September 2022. Gross leverage is debt as a ratio of earnings before interest, tax, depreciation and amortisation.
5Source: Morgan Stanley, US Corporate Credit Chartbook and European Credit Strategy, October 2022.
Credit spread is the difference in yield between securities with similar maturity but different credit quality. Widening spreads generally indicate deteriorating creditworthiness of corporate borrowers, and narrowing indicate improving.
Cyclical: Companies that sell discretionary consumer items, such as cars, or industries highly sensitive to changes in the economy, such as miners. The prices of equities and bonds issued by cyclical companies tend to be strongly affected by ups and downs in the overall economy, when compared to non-cyclical companies.
Default: The failure of a debtor (such as a bond issuer) to pay interest or to return an original amount loaned when due. The default rate is typically expressed as a percentage rate reflecting the face value of bonds in an index defaulting over a 12-month period compared with the total face value of bonds in the index at the start of the period.
Derating: This refers to when equity markets fall in price so that the price/earnings (P/E) ratio falls. It reflects investors wanting to pay less for equities.
Federal Reserve or the Fed is the central banking system of the United States.
High yield bond: A bond that has a lower credit rating than an investment grade bond. Sometimes known as a sub- or below investment grade bond. These bonds carry a higher risk of the issuer defaulting on their payments, so they are typically issued with a higher coupon (regular interest payment) to compensate for the additional risk.
ICE BofA US High Yield Index is a measure of US dollar denominated below investment grade corporate debt publicly issued in the US domestic market.
ICE BofA Euro High Yield Index is a measure of Euro denominated below investment grade corporate debt publicly issued in the euro domestic or Eurobond markets.
ICE BofA Global High Yield Index is a measure of USD, CAD, GBP and EUR denominated below investment grade corporate debt publicly issued in the major domestic or Eurobond markets.
Inflation: The annual rate of change in prices, typically expressed as a percentage rate. The Consumer Price Index (CPI) is a measure of the average change over time in the prices paid by urban consumers for a market basket of consumer goods and services.
Investment grade: A bond typically issued by governments or companies perceived to have a relatively low risk of defaulting on their payments. The higher quality of these bonds is reflected in their higher credit ratings.
Leverage: This is a measure of the level of debt in a company. Gross leverage is debt as a ratio of earnings before interest, tax, depreciation and amortisation.
Monetary policy: The policies of a central bank, aimed at influencing the level of inflation and growth in an economy. It includes controlling interest rates and the supply of money. Easing refers to a central bank increasing the supply of money and lowering borrowing costs. Tightening refers to central bank activity aimed at curbing inflation and slowing down growth in the economy by raising interest rates and reducing the supply of money.
Yield to worst (YTW) is the lowest yield a bond can achieve provided the issuer does not default and accounts for any applicable call feature (i.e. the issuer can call the bond back at a date specified in advance). At an index or portfolio level, this statistic represents the weighted average YTW for all the underlying issues.
Volatility: The rate and extent at which the price of a portfolio, security or index moves up and down. If the price swings up and down with large movements, it has high volatility. If the price moves more slowly and to a lesser extent, it has lower volatility. The higher the volatility means the higher the risk of the investment.
These are the views of the author at the time of publication and may differ from the views of other individuals/teams at Janus Henderson Investors. References made to individual securities do not constitute a recommendation to buy, sell or hold any security, investment strategy or market sector, and should not be assumed to be profitable. Janus Henderson Investors, its affiliated advisor, or its employees, may have a position in the securities mentioned.
Past performance does not predict future returns. The value of an investment and the income from it can fall as well as rise and you may not get back the amount originally invested.
The information in this article does not qualify as an investment recommendation.
Marketing Communication.
Important information
Please read the following important information regarding funds related to this article.
- An issuer of a bond (or money market instrument) may become unable or unwilling to pay interest or repay capital to the Fund. If this happens or the market perceives this may happen, the value of the bond will fall.
- When interest rates rise (or fall), the prices of different securities will be affected differently. In particular, bond values generally fall when interest rates rise (or are expected to rise). This risk is typically greater the longer the maturity of a bond investment.
- The Fund invests in high yield (non-investment grade) bonds and while these generally offer higher rates of interest than investment grade bonds, they are more speculative and more sensitive to adverse changes in market conditions.
- If a Fund has a high exposure to a particular country or geographical region it carries a higher level of risk than a Fund which is more broadly diversified.
- The Fund may use derivatives to help achieve its investment objective. This can result in leverage (higher levels of debt), which can magnify an investment outcome. Gains or losses to the Fund may therefore be greater than the cost of the derivative. Derivatives also introduce other risks, in particular, that a derivative counterparty may not meet its contractual obligations.
- When the Fund, or a share/unit class, seeks to mitigate exchange rate movements of a currency relative to the base currency (hedge), the hedging strategy itself may positively or negatively impact the value of the Fund due to differences in short-term interest rates between the currencies.
- Securities within the Fund could become hard to value or to sell at a desired time and price, especially in extreme market conditions when asset prices may be falling, increasing the risk of investment losses.
- The Fund may incur a higher level of transaction costs as a result of investing in less actively traded or less developed markets compared to a fund that invests in more active/developed markets.
- Some or all of the ongoing charges may be taken from capital, which may erode capital or reduce potential for capital growth.
- The Fund could lose money if a counterparty with which the Fund trades becomes unwilling or unable to meet its obligations, or as a result of failure or delay in operational processes or the failure of a third party provider.
Specific risks
- An issuer of a bond (or money market instrument) may become unable or unwilling to pay interest or repay capital to the Fund. If this happens or the market perceives this may happen, the value of the bond will fall.
- When interest rates rise (or fall), the prices of different securities will be affected differently. In particular, bond values generally fall when interest rates rise (or are expected to rise). This risk is typically greater the longer the maturity of a bond investment.
- The Fund invests in high yield (non-investment grade) bonds and while these generally offer higher rates of interest than investment grade bonds, they are more speculative and more sensitive to adverse changes in market conditions.
- Some bonds (callable bonds) allow their issuers the right to repay capital early or to extend the maturity. Issuers may exercise these rights when favourable to them and as a result the value of the Fund may be impacted.
- If a Fund has a high exposure to a particular country or geographical region it carries a higher level of risk than a Fund which is more broadly diversified.
- The Fund may use derivatives to help achieve its investment objective. This can result in leverage (higher levels of debt), which can magnify an investment outcome. Gains or losses to the Fund may therefore be greater than the cost of the derivative. Derivatives also introduce other risks, in particular, that a derivative counterparty may not meet its contractual obligations.
- If the Fund holds assets in currencies other than the base currency of the Fund, or you invest in a share/unit class of a different currency to the Fund (unless hedged, i.e. mitigated by taking an offsetting position in a related security), the value of your investment may be impacted by changes in exchange rates.
- When the Fund, or a share/unit class, seeks to mitigate exchange rate movements of a currency relative to the base currency (hedge), the hedging strategy itself may positively or negatively impact the value of the Fund due to differences in short-term interest rates between the currencies.
- Securities within the Fund could become hard to value or to sell at a desired time and price, especially in extreme market conditions when asset prices may be falling, increasing the risk of investment losses.
- Some or all of the ongoing charges may be taken from capital, which may erode capital or reduce potential for capital growth.
- CoCos can fall sharply in value if the financial strength of an issuer weakens and a predetermined trigger event causes the bonds to be converted into shares/units of the issuer or to be partly or wholly written off.
- The Fund could lose money if a counterparty with which the Fund trades becomes unwilling or unable to meet its obligations, or as a result of failure or delay in operational processes or the failure of a third party provider.
Specific risks
- An issuer of a bond (or money market instrument) may become unable or unwilling to pay interest or repay capital to the Fund. If this happens or the market perceives this may happen, the value of the bond will fall. High yielding (non-investment grade) bonds are more speculative and more sensitive to adverse changes in market conditions.
- When interest rates rise (or fall), the prices of different securities will be affected differently. In particular, bond values generally fall when interest rates rise (or are expected to rise). This risk is typically greater the longer the maturity of a bond investment.
- Some bonds (callable bonds) allow their issuers the right to repay capital early or to extend the maturity. Issuers may exercise these rights when favourable to them and as a result the value of the Fund may be impacted.
- Emerging markets expose the Fund to higher volatility and greater risk of loss than developed markets; they are susceptible to adverse political and economic events, and may be less well regulated with less robust custody and settlement procedures.
- The Fund may use derivatives to help achieve its investment objective. This can result in leverage (higher levels of debt), which can magnify an investment outcome. Gains or losses to the Fund may therefore be greater than the cost of the derivative. Derivatives also introduce other risks, in particular, that a derivative counterparty may not meet its contractual obligations.
- When the Fund, or a share/unit class, seeks to mitigate exchange rate movements of a currency relative to the base currency (hedge), the hedging strategy itself may positively or negatively impact the value of the Fund due to differences in short-term interest rates between the currencies.
- Securities within the Fund could become hard to value or to sell at a desired time and price, especially in extreme market conditions when asset prices may be falling, increasing the risk of investment losses.
- The Fund may incur a higher level of transaction costs as a result of investing in less actively traded or less developed markets compared to a fund that invests in more active/developed markets.
- Some or all of the ongoing charges may be taken from capital, which may erode capital or reduce potential for capital growth.
- CoCos can fall sharply in value if the financial strength of an issuer weakens and a predetermined trigger event causes the bonds to be converted into shares/units of the issuer or to be partly or wholly written off.
- The Fund could lose money if a counterparty with which the Fund trades becomes unwilling or unable to meet its obligations, or as a result of failure or delay in operational processes or the failure of a third party provider.
Specific risks
11 minute read
Key takeaways:
- Inflation is driving central bank decision-making, and the sharp policy response and jump in yields means rate moves have tended to dominate over spread moves.
- Spreads have moved wider but are more indicative of a shallow recession rather than a deeper one. Spreads may not be unreasonable if default rates stay in line with market expectations, although further volatility could emerge as liquidity conditions remain challenging.
- The high yield market is better quality and more diverse than in previous downturns and with limited near-term refinancing needs, high yield looks more technically supported.