PCS signal and noise: The yield curve and the US economy


The Signal and Noise series from Janus Henderson’s Portfolio Construction and Strategy Team seeks to identify historical patterns and precedents through which we can view current market challenges, escape analysis paralysis and drive toward an actionable set of portfolio solutions.
Key takeaways:
- Historically, the US yield curve has often been considered a good indicator of economic decline and recession.
- However, it is important to remember that even if a curve inversion does accurately predict a recession, this is not necessarily an indication that negative market returns will follow.
- Today’s yield curve has been clouded by central bank activity and inflationary pressures against a backdrop of post-pandemic demand recovery – all of which could negatively impact its predictive power.
In the first article in our Signal and Noise series, we take a look at the US yield curve. Anytime the curve nears an inversion it becomes impossible to escape the onslaught of adverse headlines. History confirms that the US yield curve has indeed been an infallible predictor of recessions in the US (Exhibit 1).

Source: Federal Reserve Bank of St. Louis. The yield curve is a line that plots the interest rates, at a set point in time, of bonds having equal credit quality but differing maturity dates. Typically, bonds with longer maturities have higher yields. An inverted yield curve occurs when short-term rates are higher than long-term rates.
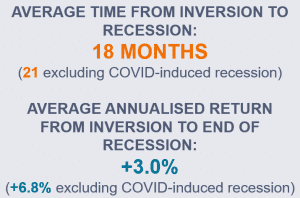
Luckily for skeptics, history also tells us that, over a variety of time frames, an inverted yield curve and ensuing recession have been as reliable as a coin toss for predicting negative S&P 500® Index returns. The table below outlines all historical yield curve inversions using the typical 2-year/10-year Treasury comparison, the recession that followed, and, most importantly, the market returns of varying time periods following the initial inversion.

*as defined by spreads between 2-year and 10-year US Treasury yields
 It is easy to understand why an inverted yield curve has historically been a reliable predictor of recessions. When short-term rates are higher than long-term rates, the implication is that investors are expecting rate cuts in the future, supposedly due to forthcoming weakness in the state of the economy. The important thing to keep in mind, however, is that even if a curve inversion accurately predicts a recession, this is not necessarily an indication that negative market returns will follow.
Today’s yield curve is polluted with unprecedented central bank activity, historically high inflation worries and a backdrop of post-pandemic demand recovery – all of which could negatively impact its predictive power. With that in mind, the next article in this series will investigate the fundamentals of US gross domestic product (GDP) outside of yield curve implications and investigate whether negative GDP growth could be on the cards.
An inverting/inverted yield curve is, unfortunately, yet another example of the inescapable volatility with which all investors are grappling with this year. On the Portfolio Construction and Strategy Team, we seek to identify portfolio solutions that are suited not just for this volatility, but also for the asset allocation gaps and concentrations we see through our custom portfolio consultations.
These are the views of the author at the time of publication and may differ from the views of other individuals/teams at Janus Henderson Investors. References made to individual securities do not constitute a recommendation to buy, sell or hold any security, investment strategy or market sector, and should not be assumed to be profitable. Janus Henderson Investors, its affiliated advisor, or its employees, may have a position in the securities mentioned.
Past performance does not predict future returns. The value of an investment and the income from it can fall as well as rise and you may not get back the amount originally invested.
The information in this article does not qualify as an investment recommendation.
Marketing Communication.