Assessing Scope 3 carbon emissions in CLO portfolios
Getting a comprehensive carbon picture for non-traditional assets can be challenging. Head of Secured Credit Colin Fleury and portfolio manager Denis Struc take a deep dive into carbon data to understand climate-related risks in collateralised loan obligation (CLO) portfolios.


7 minute read
Key takeaways:
- Getting a comprehensive picture on the carbon impact of portfolios presents unique challenges when it comes to non-traditional assets, such as loans and securitised products.
- Inconsistent data makes assessing Scope 3 or ‘financed emissions’ difficult – this is where the bulk of emissions in a typical finance-related business or securitisation transaction are accounted for.
- The CLO universe is diverse with differences in carbon intensity between European and US collateralised loan obligations (CLOs), according to Janus Henderson analysis. A deep dive into carbon data is needed to understand climate-related risks in CLO portfolios.
The CLO carbon conundrum
The growing importance of assessing the carbon impact of investment portfolios is clear with increasing ESG standards and reporting requirements globally. However, the scale of the challenges that need surmounting can vary greatly depending on the type of investments. Gathering estimated emissions data for a portfolio of traditional equities or bonds in large global corporations is considerably more straightforward than non-traditional assets, such as a portfolio of loans to smaller and often privately-owned companies or securitised products. This is because a handful of ESG data providers have developed ESG scoring approaches and carbon emissions data capture that is typically focused on traditional asset classes. A typical ESG data provider covers less than 5% of the secured loans market, as measured by the European and US Credit Suisse indices. We have therefore developed bespoke methodologies to estimate emissions from secured loans and corporate credit in general, which can then be applied to collateralised loan obligation (CLO) portfolios.
Bespoke approach to measuring carbon
Gathering reported corporate carbon emissions across many companies globally and grouping them into granular and representative peer groups forms the basis of our methodology in estimating emissions. This allows us to obtain a reliable average estimation of carbon emissions attributable to a well-defined set of sectors and sub-sectors. Using estimation, we can then efficiently overlay carbon analysis on any portfolio with corporate credit exposure. As we continue our direct corporate engagement efforts, our estimates will gradually be replaced by reported carbon numbers from more companies, further refining our analysis.
Accounting for carbon in CLOs
CLO transactions, being primarily comprised of portfolios of corporate secured loans, naturally fit the approach described above, allowing us to have an early and comprehensive view on the carbon make up of these investments.
The largest proportion of carbon emissions in CLO transactions are those related to the underlying corporate borrowers in the CLO collateral pools and are captured at the aggregate level in Scope 3 emissions. In this analysis, we focus on Scope 1 and 2 emissions of those underlying corporate borrowers, represented through the Weighted Average Carbon Intensity (WACI) measure. This information is then aggregated at each CLO overall portfolio level, thus representing Scope 3, or ‘financed emissions’, attributable to these CLO transactions. Such emissions are defined more generally under the greenhouse gas emissions (GHG) Protocol1:
- Scope 1 accounts for direct emissions from sources that are owned and controlled by an organisation. These would include heating (fuel combustion on site) and company vehicles.
- Scope 2 accounts for indirect emissions from purchased electricity, heat or cooling, which is used by an organisation.
- Scope 3 accounts for all other indirect emissions, which are a consequence of the activities of an organisation from sources it does not control (i.e., emissions from downstream and upstream activities such as goods or services that are bought or sold, as well as ‘financed emissions’ attributed to investment portfolios of financial institutions such as banks and asset managers).
Higher carbon intensity for US versus European CLOs
In a recent analysis, we focused on data for a sample of European and US CLO transactions covering over 50 European and over 70 US CLO individual deals, representing a broad and representative data sample in our view. For comparative purposes, we also incorporated carbon analysis on Western European and US Credit Suisse leveraged loan indices.
As shown in Figure 1, European CLOs have an average WACI of around 138 tonnes of carbon dioxide equivalent2 per 1 million of revenue (tCO2e/m) calculated in dollars, marginally higher than the 133 tCO2e/m for a comparable leveraged loan index. We also looked at deal exposure to high WACI sectors, which are defined as those where WACI is over 300 tCO2e/m and these include Chemicals, Construction & Homebuilding, Metals & Mining, Oil & Gas, Paper & Packaging, Transportation and Utilities.
Figure 1: European CLOs WACI distribution – CLO sample average versus leveraged loan index average
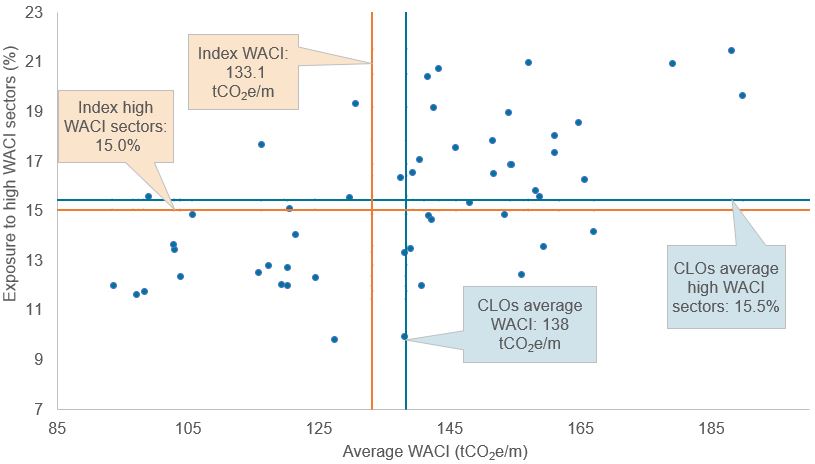
Source: Bloomberg, Credit Suisse, Sustainalytics, Janus Henderson Investors analysis, as at 31 October 2022. Credit Suisse Western European Leveraged Loan Index. Weighted average carbon intensity – WACI is measured as tonnes of carbon dioxide equivalent / 1 million of revenue (tCO2e/m) calculated in dollars. The blue dots represent CLO individual deals.
For US CLOs, average WACI is higher than in Europe, standing at 208 tCO2e/m (calculated in dollars) versus 184 tCO2e/m for a representative leveraged loan index (Figure 2). These charts highlight that not all CLO transactions are the same. In Europe, WACI ranges between 90 tCO2e/m to 190 tCO2e/m per deal; in the US, the range is broader between 110 tCO2e/m to over 400 tCO2e/m. This dispersion is primarily explained by sector allocation. We note an average of 15.5% exposure to high WACI sectors in European CLOs and 18.8% in the US, marginally higher than their respective leveraged loan index.
Figure 2: US CLOs WACI distribution – CLO sample average versus leveraged loan index average
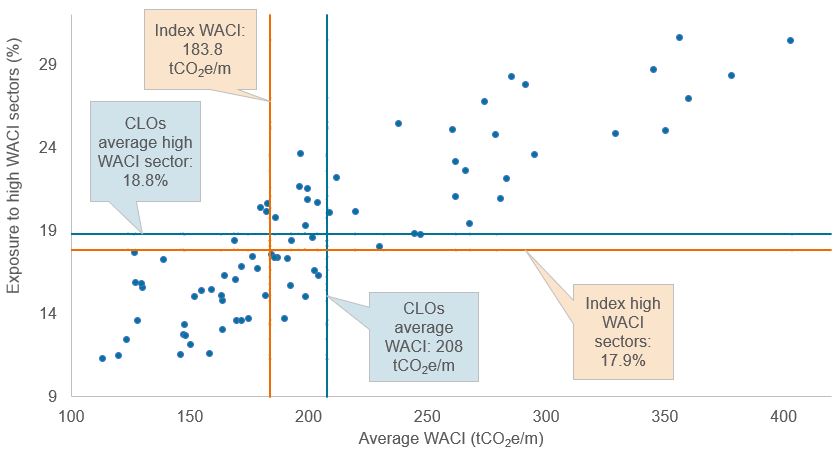
Source: Bloomberg, Credit Suisse, Sustainalytics, Janus Henderson Investors analysis, as at 31 October 2022. Credit Suisse Leveraged Loan Index. Weighted average carbon intensity – WACI is measured as tonnes of carbon dioxide equivalent / 1 million of revenue (tCO2e/m) calculated in dollars. The blue dots represent CLO individual deals.
Average sector concentrations and their respective WACI are presented in Figure 3 and 4 for European and US CLOs respectively. Higher average WACI in US CLOs compared to European CLOs is mostly due to relatively higher exposure to Utilities, Oil and Gas and Transportation sectors, where average carbon intensities are among the highest across industries.
Figure 3: European CLOs collateral sector breakdown and average carbon intensity per sector
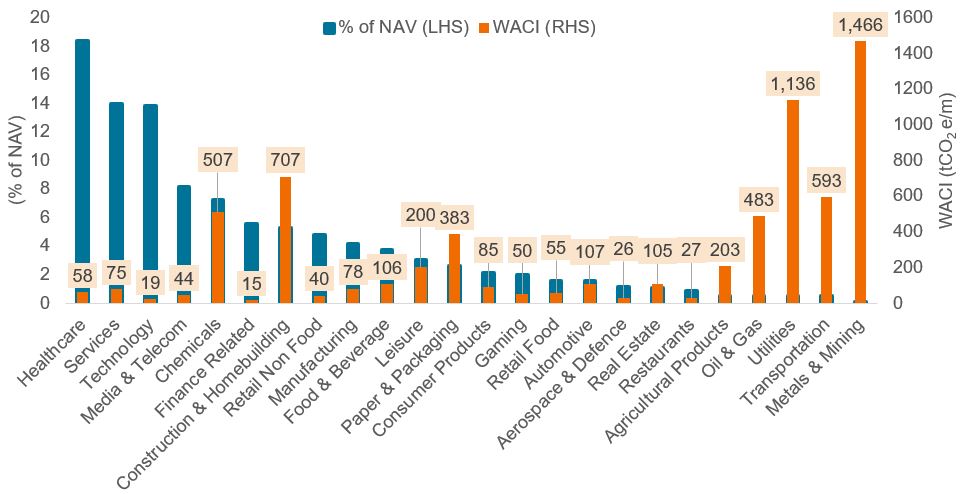
Source: Bloomberg, Credit Suisse, Sustainalytics, Janus Henderson Investors analysis, as at 31 October 2022. Credit Suisse Western European Leveraged Loan Index. Weighted average carbon intensity – WACI is measured as tonnes of carbon dioxide equivalent / 1 million of revenue (tCO2e/m) calculated in dollars. NAV = net asset value.
Figure 4: US CLOs collateral sector breakdown and average carbon intensity per sector
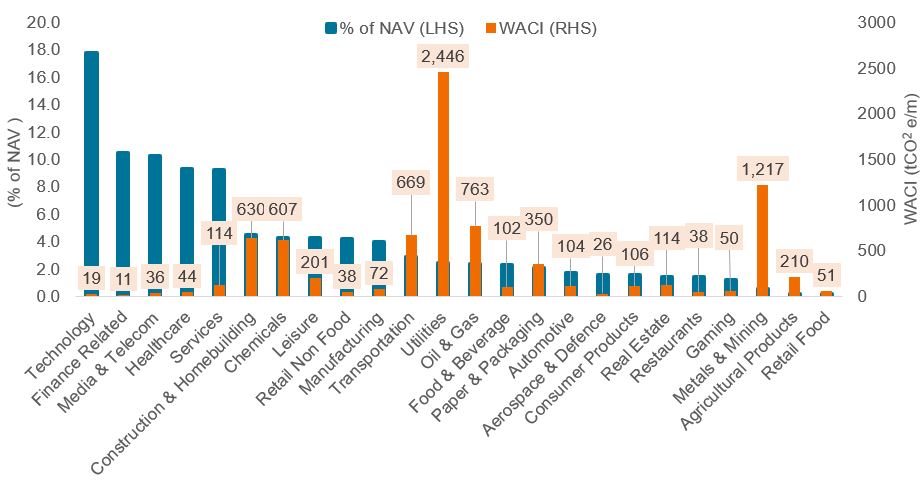
Source: Bloomberg, Credit Suisse, Sustainalytics, Janus Henderson Investors analysis, as at 31 October 2022. Credit Suisse Leveraged Loan Index. Weighted average carbon intensity – WACI is measured as tonnes of carbon dioxide equivalent / 1 million of revenue (tCO2e/m) calculated in dollars. NAV = net asset value.
Don’t wait for the data
Early-stage analysis of carbon emissions in CLOs, even when based on estimates, is an important step towards understanding climate-related risks within investment portfolios. This approach could help investors:
- Gain a fundamental understanding of carbon metrics and challenges related to their calculations.
- Undertake carbon relative analysis, establishing a clear view on where a particular investment sits within its universe as well as versus the overall global carbon emissions backdrop.
- Identify the largest carbon emitters, which in turn guides corporate engagement efforts to either obtain more refined data or probe companies on their current and future decarbonisations plans and encourage change.
- Determine critical pressure points in investment portfolios by identifying jurisdictions, sectors, and entities with higher exposure to current and future transition and physical climate-related risks.
- Refine and advance analysis by developing and incorporating over time a complete suite of climate metrics as recommended by TCFD3, further enhancing an understanding of underlying risks in investment portfolios.
Footnotes
1 This outlines a global standardised framework to measure GHG emissions from private and public sector operations.
2 Carbon dioxide equivalent or CO2e is a term for describing different greenhouse gases in a common unit.
3 TCFD, Task Force on Climate-related Financial Disclosures provides recommendations on the types of information that companies should disclose to support investors, lenders, and insurance underwriters in appropriately assessing and pricing a specific set of risks related to climate change. TCFD aims to improve and increase reporting of climate-related financial information.
These are the views of the author at the time of publication and may differ from the views of other individuals/teams at Janus Henderson Investors. References made to individual securities do not constitute a recommendation to buy, sell or hold any security, investment strategy or market sector, and should not be assumed to be profitable. Janus Henderson Investors, its affiliated advisor, or its employees, may have a position in the securities mentioned.
Past performance does not predict future returns. The value of an investment and the income from it can fall as well as rise and you may not get back the amount originally invested.
The information in this article does not qualify as an investment recommendation.
Marketing Communication.
7 minute read
Key takeaways:
- Getting a comprehensive picture on the carbon impact of portfolios presents unique challenges when it comes to non-traditional assets, such as loans and securitised products.
- Inconsistent data makes assessing Scope 3 or ‘financed emissions’ difficult – this is where the bulk of emissions in a typical finance-related business or securitisation transaction are accounted for.
- The CLO universe is diverse with differences in carbon intensity between European and US collateralised loan obligations (CLOs), according to Janus Henderson analysis. A deep dive into carbon data is needed to understand climate-related risks in CLO portfolios.