Valuing the improving credit quality in high yield
Several of our global high yield experts assess the value that rising credit quality could have on high yield spreads.


7 minute read
Key takeaways:
- The average credit quality (measured by credit rating) of the world’s high-yield bond markets has improved significantly since the Global Financial Crisis (GFC).
- Using our analysis, we think the value of this improved quality is worth about 25 basis points in the US and about 20 basis points globally in terms of the credit spread versus government bonds.
- Our calculations indicate that US high yield spreads could trade 10 basis points tighter than the January 2020 lows and still be at the same spread on a credit-adjusted basis
I could tell you my adventures … but it’s no use going back to yesterday, because I was a different person then.”
– Alice in Wonderland
We often hear about credit spreads (the difference in yield of corporate bonds over comparable government bonds of similar maturity) being ‘tight’ or ‘wide’ when discussing how a market is valued relative to its past levels. But what if, to paraphrase the old maxim, past spreads are not a good guide to present ones? What if the market has changed over time?
We have been, and remain, positive on the high yield market because we believe we are still early in the credit recovery cycle, default rates are expected to decline and companies – even the highly leveraged ones – have better access to capital thanks to the efforts of the US Federal Reserve (Fed) to keep the corporate bond markets liquid. But something else is different too: the average credit quality (measured by credit rating) in high yield bond markets has improved significantly since the last crisis.
The US high yield bond market is mostly made up of bonds rated BB (the highest sub-investment grade rating) through to CCC. Currently, BB rated bonds represent around 55% of the index, while CCC is near 12% and bonds rated below CCC are under 1%. In other words, about half the index holds the highest sub-investment-grade credit quality. But it was not always this way. In the months following the GFC, the portion of high yield bonds that were rated CCC peaked at 23% – nearly double the number today – and the total amount of bonds rated CCC or lower peaked at 30% of the index, almost three times today’s amount. In sum, over the last decade, about 15% of the high yield market rose from near the bottom of the credit spectrum to near the top.
Weights of the highest and lowest-rated sectors of the US High Yield Index
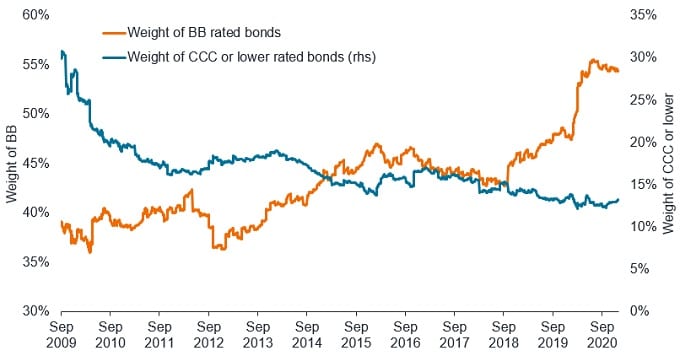
Source: Bloomberg, 30 September 2009 to 29 January 2021. Index is the Bloomberg Barclays US High Yield Bond Index.
To be fair, the change is not just because high yield companies became more creditworthy. In part, the evolution has to do with the worst-rated companies restructuring or leaving the market. And, as can be seen in the above chart, the percentage of BB bonds surged in 2020 when a number of large companies that were in investment grade indices fell (hence the moniker ‘fallen angels’) into the high yield market. Regardless of the reasons, the high yield market has steadily evolved to a higher-rated index.
Calculating the value
So what is that improvement worth? We think it is worth about 25 basis points. (100 basis points = 1%)
In the chart below, we plot the historical spread of the Bloomberg Barclays US High Yield Index, an adjusted spread, and the difference. The adjusted spread assumes that the index had the same weighted-average credit rating it has today. Given that credit quality has improved, it is intuitive that the adjusted spread is lower than the historical spread and, as shown by the orange line indicating the difference between the two, grows steadily lower as you go back in time. To put it plainly, the High Yield Index, when taking into account the improvement in credit quality, has gotten steadily cheaper.
The simple average of the difference between the historical and credit-adjusted spreads since 2009 is 28 basis points. As that average is skewed lower by the extreme difference a decade ago, we rounded down to 25 basis points – a level that also reflects the conservative side of the range between 20 and 40 basis points in which the difference hovered between 2011 and 2018.
Adjusting historical high yield spreads for improved credit quality
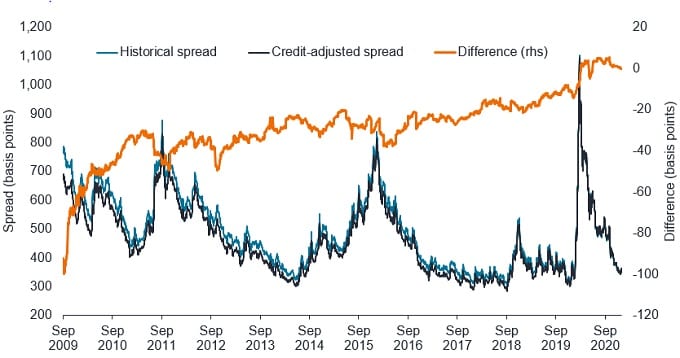
Source: Bloomberg, Janus Henderson calculations, as of 29 January 2021. Index is the Bloomberg Barclays U.S. High Yield Index.
Nevertheless, as the US high yield market is approaching its historical spread lows, it might be more helpful to look at the difference between the historical spreads and the credit-adjusted spreads at these low points. The most recent low in the historical spread, on 13 January 2020, was 312 basis points. When adjusted for the credit improvement since then, we calculate the comparable spread to be 302 basis points, or 10 basis points tighter. Compared to the post-GFC low, on 1 October 2018, when the spread was 309 basis points, we calculate the credit-adjusted spread to be 290 basis points, or 19 basis points tighter. The gap only grows from there, rising to 24 basis points at the 2014 low (on 23 June).
In our view, the gap – the difference between the historical spread and the credit-adjusted spread – matters. The High Yield Index when these prior spread lows were set was essentially a different index, with a lower average credit quality. As such, when investors discuss whether the US high-yield market can reach or exceed its prior lows, we think they should look at history on an adjusted basis. For example, using our analysis, high-yield spreads could trade 10 basis points tighter than the January 2020 lows they set just over a year ago and still be at the same spread on a credit-adjusted basis.
A global phenomenon
Improvement in the average credit quality of the high yield market is not just a US phenomenon. In Europe and in the emerging markets, the average credit quality has also improved dramatically. The chart below shows the change in weights for both single B and CCC rated bonds, from their historical maximums over the last 15 years to the end of January 2021. In all cases, the weights have fallen. Globally, the share of single B securities has fallen by 37.5%, and the share of CCC securities has fallen by 60%. These are not, in our view, minor changes to a major market.
The share of lower-rated securities has declined globally
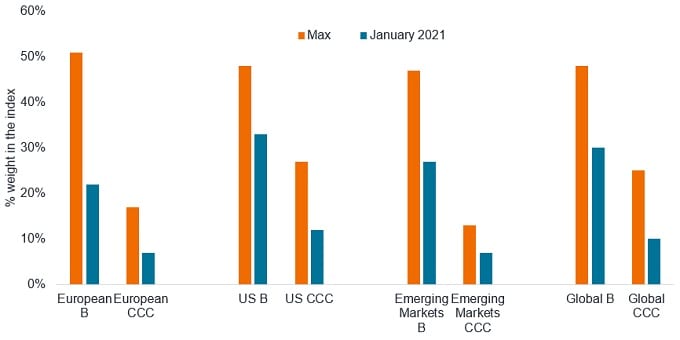
Source: Regional ICE BofA High Yield Bond Indices, 31 January 2006 to 31 January 2021.
Running the same analysis for the Global High Yield Bond Index we conclude that the improvement in credit quality is worth about 20 basis points in terms of spread. On a credit-quality-adjusted basis the global high yield spread could potentially have traded 8 basis points tighter at its 17 January 2020 low of 352 basis points in 2020 and 6 basis points tighter at the 10-year low of 311 basis points reached on 26 January 2018, which is some way below the 410 basis points spread at 31 January 2021.
The effect is less pronounced for European high yield. This is because the credit improvement occurred rapidly after the GFC so if we strip out 2010 the improvement in credit quality is only worth around 2 basis points. European high yield also escaped much of the credit deterioration that occurred in the energy sector in the middle of the last decade so the BB weighting has been stable for longer. Using our calculations, the European High Yield Index could potentially have traded 4 basis points tighter at its 20 January 2020 low of 316 basis points in 2020. Interestingly, the BB weighting in Europe was slightly higher back on 25 October 2017 when the spread hit a 10-year low of 248 basis points, so our calculations would adjust upwards by 12 basis points to a spread of 260 basis points. At 31 January 2021 European spreads were almost 100 basis points wider than this at 359 basis points, offering the potential for further spread tightening.
Source for Global and European high yield figures above: Bloomberg, Janus Henderson calculations, ICE BofA Global High Yield Bond Constrained Index, ICE BofA European Currency High Yield Constrained Index, as at 31 January 2021.
Please note these are Janus Henderson calculations and are not guaranteed. They are for information purposes only and should not be used or construed as an offer to sell, a solicitation of an offer to buy, or a recommendation to buy, sell or hold any security, investment strategy or market sector.
A fair comparison
In our view, investors can and should ask, “Can high yield spreads return to their historical lows?” However, when we talk about these lows, we need to know if we are comparing apples to apples, which is not the case when comparing today’s spreads to the lows since the GFC.
As Alice wisely said, there is little use in talking about the past as if it were the same as the present. High yield indices globally have better overall credit quality today than in any of the prior lows since the GFC. While investors can, and should, debate the fundamental outlook across regions, we think it is important to keep in mind that the world’s high yield markets have changed for the better.
Credit quality ratings: these are measured on a scale that generally ranges from AAA (highest) to D (lowest).
These are the views of the author at the time of publication and may differ from the views of other individuals/teams at Janus Henderson Investors. References made to individual securities do not constitute a recommendation to buy, sell or hold any security, investment strategy or market sector, and should not be assumed to be profitable. Janus Henderson Investors, its affiliated advisor, or its employees, may have a position in the securities mentioned.
Past performance does not predict future returns. The value of an investment and the income from it can fall as well as rise and you may not get back the amount originally invested.
The information in this article does not qualify as an investment recommendation.
Marketing Communication.
7 minute read
Key takeaways:
- The average credit quality (measured by credit rating) of the world’s high-yield bond markets has improved significantly since the Global Financial Crisis (GFC).
- Using our analysis, we think the value of this improved quality is worth about 25 basis points in the US and about 20 basis points globally in terms of the credit spread versus government bonds.
- Our calculations indicate that US high yield spreads could trade 10 basis points tighter than the January 2020 lows and still be at the same spread on a credit-adjusted basis