Is there a solvency crisis looming in credit markets?
Jenna Barnard, Co-Head of Strategic Fixed Income, and Nick Ware, Portfolio Manager, counter the bear argument that credit is set to face a solvency crisis by explaining that liquidity is solvency.


7 minute read
Key takeaways:
- High yield defaults are estimated to peak well below typical recessionary levels as the ample liquidity and stimulus packages put in place have bought time for companies to counter the problems brought on by COVID.
- Companies have had little trouble accessing capital markets, both bond and equity, which together with self-help tactics is allowing companies to weather the crisis; problems are predictably in areas that were structurally pressured pre-crisis.
- While credit metrics have deteriorated, much of the cash raised is sitting on balance sheets and an expected episode of deleveraging and recovery in earnings could see the deterioration reversed in 2021-22.
This is the fourth article that we have written since turning structurally bullish on credit during the COVID crisis (March 2020). The themes we discussed: exceptionally low default rates relative to the gross domestic product (GDP) decline and the COVID crisis driving the US investment grade (IG) market to a record low in yields have gone from being non-consensual views to reality. Here we aim to address the remaining “macro-tourist”1 bear argument: that having resolved liquidity concerns, credit markets are due to be hit by a solvency crisis, i.e. a new default wave from companies that cannot repay this debt. We disagree, arguing that for public credit markets (which focus on larger corporates, not the small business on your local high street) liquidity is solvency.
Many bearish commentators have propounded the view that the COVID-19 crisis would catalyse a major default cycle given the intersection of record amounts of corporate debt and the deepest recession in modern times. This builds on what we have felt to be a fallacious narrative about excessive BBB corporate debt from similar commentators in recent years.
The reality has not borne this out to date: high yield defaults in Europe look set to peak at around 4% in late 2020 whilst the US high yield market (with greater commodity exposure) should peak around 6.5% before declining in 20212. This is a historic decoupling of default rates from economic data (historically they reach 10-12% in recessions) and we have written in past articles about the unique nature of the policy response in this crisis. Every crisis has its own peculiarities and this one differs from the great financial crisis in 2008-09 where there has been ample liquidity available for corporate borrowers from both the investment grade and the high yield market. The stimulus has bought companies time to fix the problems brought on by COVID. Consumers too have been shielded from large income drops brought on by unemployment through furlough schemes and in some cases, notably sections of the US, are better off than before the crisis started.
Credit metrics in a historical context
It is worth stepping back to look at corporate balance sheet metrics in aggregate in order to judge the impact of the COVID crisis. At the aggregate level corporate debt has risen as companies have borrowed more (see Figure 1).
Figure 1: US Corporate debt as a % of gross domestic product (GDP)
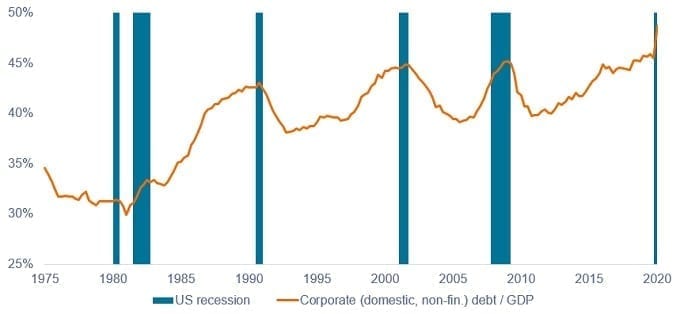
Source: Board of Governors of the Federal Reserve System. Q4 1951 to Q1 2020. Notes: domestic non-financial sectors.
Not unexpectedly corporate leverage ratios have increased materially as depicted below. However, the impact has been notably larger for gross leverage (which is at record highs) than net leverage, which simply sits at previous cycle highs. Not the unprecedented situation it is made out to be. Essentially, corporates raised a war chest of liquidity (which is thus far unspent) in case of further waves of the pandemic. Meanwhile, median interest coverage (the number of times a company’s available earnings can cover interest payments on its debt) weakened but is still healthy at 9.4x, reflecting record low interest costs, according to work completed by Morgan Stanley (as at 30 June 2020).
Figure 2: US investment grade gross and net leverage
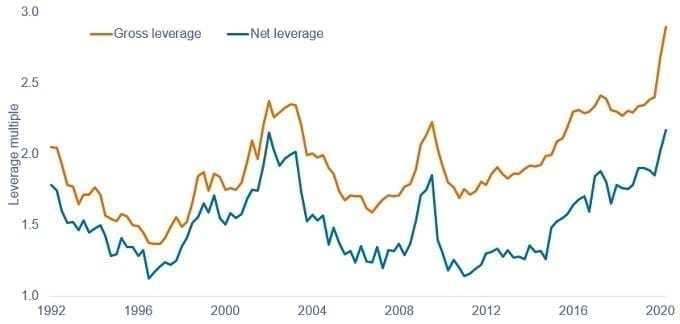
Source: Morgan Stanley Research, Bloomberg Finance LP, FTSE Fixed Income LLC, 31 March 1992 to 30 June 2020.
Gross leverage is a measure of the level of debt of a company. It is measured as total debt divided by earnings before interest, tax, depreciation and amortisation (EBITDA). Net leverage is net debt (interest-bearing liabilities minus cash and cash equivalents)/EBITDA.
Figure 3: US high yield median gross and net leverage
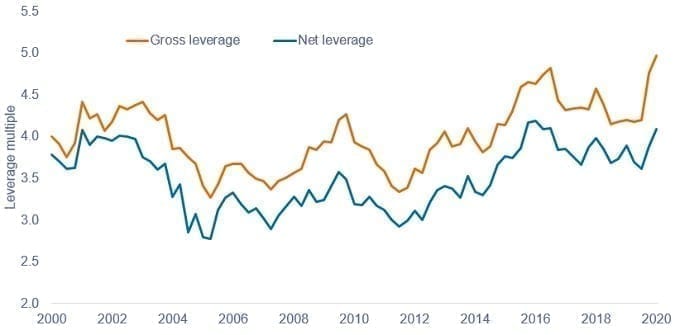
Source: Morgan Stanley Research, Bloomberg, S&P Capital IQ, 30 June 2020 to 30 June 2020.
Figure 4: US high yield interest coverage
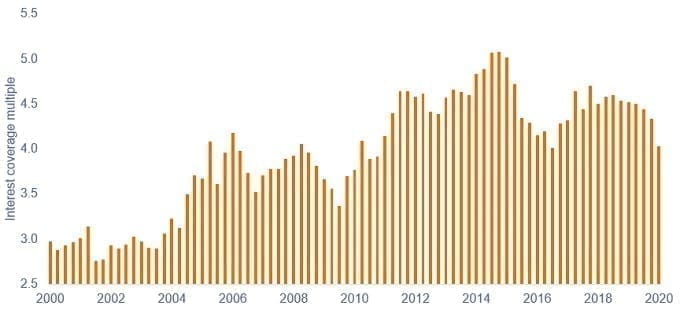
Source: Morgan Stanley Research, Bloomberg, S&P Capital IQ, 30 June 2020 to 30 June 2020.
It is perhaps worth mentioning that relative to the expected impact, corporates have managed the crisis better than expected. They have reduced expenses and capital expenditures to preserve their profitability and cashflow. As mentioned, companies also built up liquidity reserves to see through the crisis. S&P 500 companies have issued close to US$1.2trn of bonds in 2020 versus US$875bn in 2019 and US$96bn of equity too3. Capital markets have been wide open to COVID-impacted sectors such as cruise companies and airlines to raise liquidity to see through the crisis, with US IG issuance year to date as at 8 October standing at US$1.57trn4. High yield too has seen significant issuance, with cash being raised for precautionary purposes.
Figure 5: US high yield median cash as a % of debt
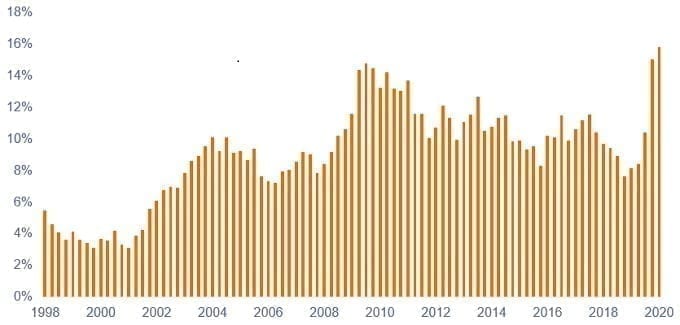
Source: Morgan Stanley Research, Bloomberg, S&P Capital IQ, 30 June 1998 to 30 June 2020.
Will this turn into a solvency crisis?
Increasing liquidity is clearly a necessary condition for survival but deleveraging is the only sustainable route to survival. This is true, but the ability to remain a “zombie” for years should not be underestimated. Interestingly, although we did see an initial spike in defaults in Q2 2020, default rates quickly subsided again. Indeed, default rate forecasts have been declining since the initial overdone and top-down driven forecasts in March. This has culminated in JP Morgan’s recent forecast of only 6.5% in US high yield defaults for 2020 and a modest 3.5% for 2021 (Figure 6).
Figure 6: US high yield default rate and forecast
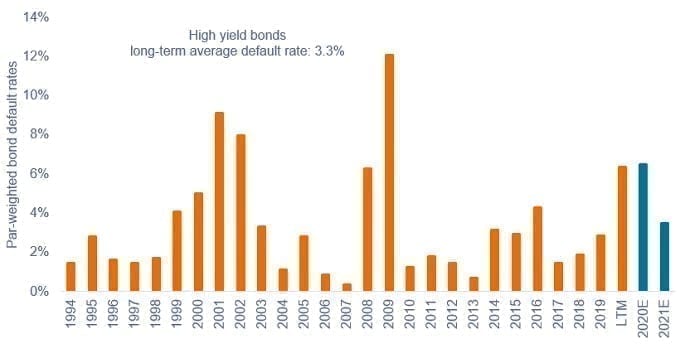
Source: JP Morgan US High Yield and Leveraged Loan Strategy, 5 October 2020. LTM = last twelve months. Forecasts are estimates, may vary over time and are not guaranteed.
The initial spike would not have surprised anyone in credit markets, coming as they did from companies that had long struggled with structural decline in their industry and could not deleverage their legacy balance sheets. For example, Frontier, a US telecom company, defaulted with US$16.7bn of debt in March and then Intelsat, a satellite company, defaulted with US$14.4bn of debt in April.
Looking at the sectoral composition produced by JP Morgan there are again no surprises. As portfolio managers we look at industries through a simple lens: is it an industry or company that can support leverage? By style we have no exposure to energy, metals and mining, and clothing retail, which have well-known structural problems, high operational leverage and excessive cyclicality5.
Figure 7: Industry defaults year to date (including distressed exchanges)
| Industry | Amount affected (US$m) | Number of actions | ||
|---|---|---|---|---|
| Automotive | 1,222.8 | 1.0% | 3 | 3.3% |
| Broadcasting | 0.0 | 0.0% | 0 | 0.0% |
| Cable & Satellite | 14,425.9 | 11.7% | 1 | 1.1% |
| Chemicals | 0.0 | 0.0% | 0 | 0.0% |
| Consumer Products | 3,993.7 | 3.2% | 9 | 9.8% |
| Diversified Media | 2,985.5 | 2.4% | 5 | 5.4% |
| Energy | 41,056.9 | 33.3% | 27 | 29.3% |
| Financial | 0.0 | 0.0% | 0 | 0.0% |
| Food & Beverages | 2,962.2 | 2.4% | 4 | 4.3% |
| Gaming, Lodging & Leisure | 4,834.0 | 3.9% | 7 | 7.6% |
| Healthcare | 5,483.2 | 4.4% | 4 | 4.3% |
| Housing | 1,110.0 | 0.9% | 2 | 2.2% |
| Industrials | 909.5 | 0.7% | 2 | 2.2% |
| Metals & Mining | 2,458.5 | 2.0% | 3 | 3.3% |
| Paper & Packaging | 0.0 | 0.0% | 0 | 0.0% |
| Retail | 14,327.8 | 11.6% | 11 | 12.0% |
| Services | 7,067.2 | 5.7% | 7 | 7.6% |
| Technology | 2,602.1 | 2.1% | 3 | 3.3% |
| Telecommunications | 16,690.7 | 13.5% | 1 | 1.1% |
| Transportation | 1,024.7 | 0.8% | 2 | 2.2% |
| Utility | 286.5 | 0.2% | 1 | 1.1% |
| Total | 123,441.1 | 92 | ||
| Energy and Metals & Mining | 43,515.4 | 35% | 30 | 33% |
| Ex Energy and Metals & Mining | 79,925.7 | 65% | 62 | 67% |
Source: JP Morgan US High Yield and Leveraged Loan Strategy, 5 October 2020.
The coming deleveraging cycle
In polar opposition to the narrative of a solvency crisis, one might reasonably expect a period of healthy balance sheet deleveraging. To state the obvious, as earnings recover, leverage will mathematically decline as we have seen in all previous cycles. Companies have entered the repair and recovery phase of the credit cycle which historically tends to be the period when credit investors do well. In addition, the experience of the COVID crisis could well leave a degree of corporate scarring in management psyches: a degree of resiliency being as valuable as maximising return on equity through leverage. The fundamental picture for 2021 for credit investors assuming COVID and vaccine news remains on track will be that a portion of the credit deterioration will be reversed in 2021-22.
Footnotes
1Macro tourist is an investor or commentator who leaves their comfort zone to make big pronouncements about how the economy works. A bearish view symbolises a pessimistic or negative view of the market, a bullish view symbolises a positive or optimistic view.
2Source: JP Morgan, US High Yield and Leveraged Loan Strategy, 5 October 2020.
3Source: JP Morgan US Equity Strategy and Global Quantitative Research, Bloomberg, 11 September 2020.
4Source: Bloomberg, 8 October 2020.
5Source: Janus Henderson, correct at 30 September 2020 for portfolios managed by the Strategic Fixed Income Team. Please note that portfolio holdings may vary over time.
Default: the failure of a borrower to meet their repayment obligations to bondholders.
Gross domestic product (GDP): a measure of overall economic activity.
High yield bond: A bond that has a lower credit rating than an investment grade bond. Sometimes known as a sub-investment grade bond. These bonds carry a higher risk of the issuer defaulting on their payments, so they are typically issued with a higher yield to compensate for the additional risk.
Investment grade bond: A bond typically issued by governments or companies perceived to have a relatively low risk of defaulting on their payments. The higher quality of these bonds is reflected in their higher credit ratings when compared with bonds thought to have a higher risk of default, such as high-yield bonds.
Leverage: the level of borrowing of a company; to deleverage is to reduce borrowing levels.
Liquidity: The ease with which companies can convert assets into cash to meet financial obligations and the fluidity of asset markets. Assets that can be easily traded in the market (without causing a major price move) are referred to as ‘liquid’.
Solvency: A measure of a company’s financial health. A company is solvent when it is able to operate and meet its financial obligations.
Yield: the level of income on a security, typically expressed as a percentage rate.
These are the views of the author at the time of publication and may differ from the views of other individuals/teams at Janus Henderson Investors. References made to individual securities do not constitute a recommendation to buy, sell or hold any security, investment strategy or market sector, and should not be assumed to be profitable. Janus Henderson Investors, its affiliated advisor, or its employees, may have a position in the securities mentioned.
Past performance does not predict future returns. The value of an investment and the income from it can fall as well as rise and you may not get back the amount originally invested.
The information in this article does not qualify as an investment recommendation.
Marketing Communication.
Important information
Please read the following important information regarding funds related to this article.
- An issuer of a bond (or money market instrument) may become unable or unwilling to pay interest or repay capital to the Fund. If this happens or the market perceives this may happen, the value of the bond will fall.
- When interest rates rise (or fall), the prices of different securities will be affected differently. In particular, bond values generally fall when interest rates rise (or are expected to rise). This risk is typically greater the longer the maturity of a bond investment.
- The Fund invests in high yield (non-investment grade) bonds and while these generally offer higher rates of interest than investment grade bonds, they are more speculative and more sensitive to adverse changes in market conditions.
- Some bonds (callable bonds) allow their issuers the right to repay capital early or to extend the maturity. Issuers may exercise these rights when favourable to them and as a result the value of the Fund may be impacted.
- If a Fund has a high exposure to a particular country or geographical region it carries a higher level of risk than a Fund which is more broadly diversified.
- The Fund may use derivatives to help achieve its investment objective. This can result in leverage (higher levels of debt), which can magnify an investment outcome. Gains or losses to the Fund may therefore be greater than the cost of the derivative. Derivatives also introduce other risks, in particular, that a derivative counterparty may not meet its contractual obligations.
- When the Fund, or a share/unit class, seeks to mitigate exchange rate movements of a currency relative to the base currency (hedge), the hedging strategy itself may positively or negatively impact the value of the Fund due to differences in short-term interest rates between the currencies.
- Securities within the Fund could become hard to value or to sell at a desired time and price, especially in extreme market conditions when asset prices may be falling, increasing the risk of investment losses.
- Some or all of the ongoing charges may be taken from capital, which may erode capital or reduce potential for capital growth.
- CoCos can fall sharply in value if the financial strength of an issuer weakens and a predetermined trigger event causes the bonds to be converted into shares/units of the issuer or to be partly or wholly written off.
- The Fund could lose money if a counterparty with which the Fund trades becomes unwilling or unable to meet its obligations, or as a result of failure or delay in operational processes or the failure of a third party provider.
Specific risks
7 minute read
Key takeaways:
- High yield defaults are estimated to peak well below typical recessionary levels as the ample liquidity and stimulus packages put in place have bought time for companies to counter the problems brought on by COVID.
- Companies have had little trouble accessing capital markets, both bond and equity, which together with self-help tactics is allowing companies to weather the crisis; problems are predictably in areas that were structurally pressured pre-crisis.
- While credit metrics have deteriorated, much of the cash raised is sitting on balance sheets and an expected episode of deleveraging and recovery in earnings could see the deterioration reversed in 2021-22.