From defence to offence in biotech
Biotechnology stocks are experiencing a historic period of relative underperformance. Portfolio Manager Andy Acker explains why he believes the selling does not match up with the sector's long-term growth prospects.

4 minute read
Key takeaways:
- Biotech’s historic downturn over the past year has caused some companies within the sector to trade below the value of the cash on their balance sheets.
- Rising interest rates and lingering headwinds could lead to further near-term volatility for the sector.
- In our view, valuations now underestimate the long-term growth potential of many biotech companies, particularly given the strength of the sector’s innovation.
A number of challenges have combined to weigh on the sector: uncertainty around drug-pricing reform following the 2020 U.S. election. Regulatory surprises and COVID-19 delays. A frothy initial public offering (IPO) market. Clinical trial setbacks, and more recently, the prospect that rising interest rates could weigh on the valuations of long-duration assets. In short, over the past year, biotech has faced significant pressure, and consequently beaten a fast retreat.
We don’t believe the sector is defeated. On the contrary, we think many biotech stocks now trade well below the long-term value of their underlying businesses, potentially creating a unique opportunity to buy into the sector’s rapid innovation – at unusually low prices.
A punishing sell-off
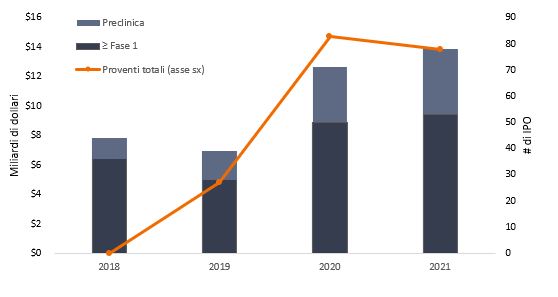
To be fair, biotech was due for some rationalization. Over the past two years, the sector has experienced a surge in initial public offerings (IPOs) and blank-check mergers known as SPACs.3 Many drug makers came public at sizable premiums, including some that had yet to deliver positive clinical data. In fact, nearly a third of companies that completed IPOs in 2021 were in the preclinical stage of development, compared with 18% in 2018 (Exhibit 1).

Source: BioPharma Dive, as of 31 December 2021. IPO figures based on companies that raised a minimum of US $50 million.
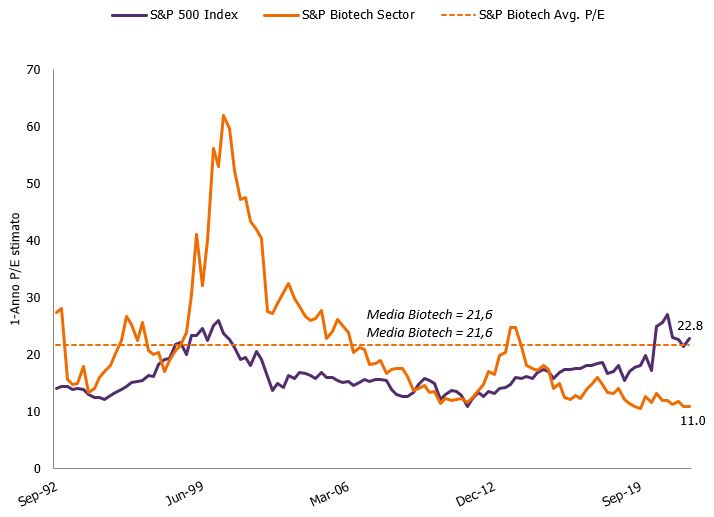
But whereas the typical biotech drawdown has historically resulted in a 28% loss and persisted for less than 70 trading days, the current pullback is much deeper and has lasted much longer (240+ days).4 Many companies now trade below the value of the cash on their balance sheets, and biotech’s average forward price-to-earnings ratio (P/E) lags that of the S&P 500 and the sector’s long-term average (Exhibit 2).

Source: Bloomberg, data are quarterly from 30 September 1992 to 31 December 2021. The S&P Biotechnology (Biotech) Sector Index is a capitalization-weighted index consisting of GICS-classified biotechnology companies.

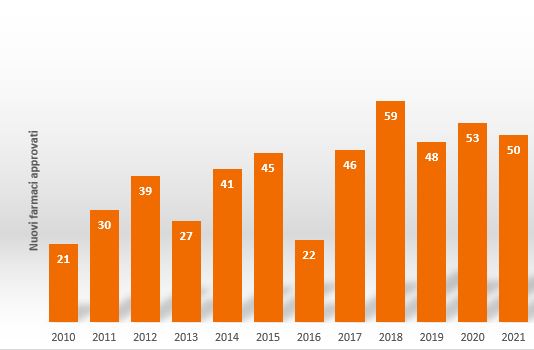
Source: U.S. Food and Drug Administration, as of 31 December 2021.
Is a bottom in sight?
Today, we see signs that some of the sector’s headwinds could start to abate. The Biden administration, for one, is working to nominate a permanent commissioner to the FDA, with a key deadline looming this year. A confirmed commissioner should bring more predictability to FDA decision-making, reducing downside surprises. Uncertainty around drug-pricing reform was prolonged when the Build Back Better bill failed to advance through Congress in late 2021. But we believe lawmakers will push for a resolution before midterm elections in November, with either no changes passed or with policy based on recent proposals, which we believe could have a modest impact on the sector.
A combination of low valuations and a cash-rich biopharma industry could also drive new mergers and acquisitions (M&A). Last year, biopharma M&A activity dropped to one of its lowest levels in a decade, totaling $108 billion, compared with $261 billion in 2019.7 Accordingly, some estimate that large-cap firms could have a combined $500 billion in cash to spend by the end of 2022.
So far, the industry has declined to pursue big deals (possibly due to worries about regulatory scrutiny). But large-cap companies have signaled their desire to bolster flagging pipelines through “bolt-on” acquisitions of smaller, innovation-driven firms. In mid-January, for example, UCB, a maker of epilepsy drugs, announced a bid for rare disease drug maker Zogenix for $1.9 billion, a roughly 70% premium. The deal will give UCB access to Zogenix’s Fintepla, which treats rare types of epilepsy, just as UCB’s own epilepsy drug, Vimpat, is set to lose U.S. market exclusivity. With so many factors lining up – large cash stockpiles, dramatically lower valuations, low interest rates and drug pricing clarity – we would expect to see a meaningful pickup in M&A activity in the coming year.
A sensible game plan
Not all of biotech’s problems are going away. This year, central bank tightening is likely to be a headwind for high-growth firms that don’t yet turn a profit, including areas of biotech. Against this backdrop, we believe revenue-generating companies or those in the later stages of pipeline development could be well positioned.
But we also are not discouraged. COVID-19 and the corresponding growth rally have overwhelmed returns for the last two years. Now, with the pandemic hopefully waning, we expect biotech to find a better balance. Clinical events over the next 18 months could help restore confidence, including gene therapy programs in muscular dystrophy, small molecule therapies for Huntington’s disease, and immuno-oncology programs in melanoma and lung cancer. The sector is also eyeing updates from a trio of medicines that aim to address Alzheimer’s disease, which could represent a multibillion-dollar market opportunity. Positive data could be positive for biotech – and put the sector back on the offensive.
1Bloomberg, data reflect total returns of -20% or worse in the XBI from 27 February 2006 through 27 January 2022.
2EY M&A Firepower, 10 January 2022.
3Regulatory Affairs Professionals Society (RAPS), as of 7 January 2022.
4Bloomberg, data from 31 January 2006 to 27 January 2022.
5Bloomberg, data from 8 February 2021 to 27 January 2022. The SPDR S&P Biotech ETF (XBI) is designed to correspond generally to the performance of the S&P Biotechnology Select Industry Index, an equal-weighted index that tracks biotechnology stocks listed on multiple indexes.
6Bloomberg, data from 31 January 2006 to 27 January 2022.
7Special purpose acquisition company (SPAC) = a publicly traded company created for the purpose of acquiring or merging with an existing company.
These are the views of the author at the time of publication and may differ from the views of other individuals/teams at Janus Henderson Investors. References made to individual securities do not constitute a recommendation to buy, sell or hold any security, investment strategy or market sector, and should not be assumed to be profitable. Janus Henderson Investors, its affiliated advisor, or its employees, may have a position in the securities mentioned.
Past performance does not predict future returns. The value of an investment and the income from it can fall as well as rise and you may not get back the amount originally invested.
The information in this article does not qualify as an investment recommendation.
Marketing Communication.
Important information
Please read the following important information regarding funds related to this article.
- Shares/Units can lose value rapidly, and typically involve higher risks than bonds or money market instruments. The value of your investment may fall as a result.
- Shares of small and mid-size companies can be more volatile than shares of larger companies, and at times it may be difficult to value or to sell shares at desired times and prices, increasing the risk of losses.
- If a Fund has a high exposure to a particular country or geographical region it carries a higher level of risk than a Fund which is more broadly diversified.
- The Fund is focused towards particular industries or investment themes and may be heavily impacted by factors such as changes in government regulation, increased price competition, technological advancements and other adverse events.
- The Fund may use derivatives to help achieve its investment objective. This can result in leverage (higher levels of debt), which can magnify an investment outcome. Gains or losses to the Fund may therefore be greater than the cost of the derivative. Derivatives also introduce other risks, in particular, that a derivative counterparty may not meet its contractual obligations.
- If the Fund holds assets in currencies other than the base currency of the Fund, or you invest in a share/unit class of a different currency to the Fund (unless hedged, i.e. mitigated by taking an offsetting position in a related security), the value of your investment may be impacted by changes in exchange rates.
- When the Fund, or a share/unit class, seeks to mitigate exchange rate movements of a currency relative to the base currency (hedge), the hedging strategy itself may positively or negatively impact the value of the Fund due to differences in short-term interest rates between the currencies.
- Securities within the Fund could become hard to value or to sell at a desired time and price, especially in extreme market conditions when asset prices may be falling, increasing the risk of investment losses.
- The Fund may incur a higher level of transaction costs as a result of investing in less actively traded or less developed markets compared to a fund that invests in more active/developed markets.
- The Fund could lose money if a counterparty with which the Fund trades becomes unwilling or unable to meet its obligations, or as a result of failure or delay in operational processes or the failure of a third party provider.
