Yield curve inversion: warning or opportunity for sterling corporate bonds?
Despite a challenging start to 2022 for sterling corporate bonds, the market's risk perception for the asset class is short of elevated levels. Should investors look through the recent volatility, they will find attractive levels of yields that remain backed by strong corporate fundamentals.

5 minute read
Key takeaways:
- Gilt rate inversion has been driven by a sharp rise in rates at the front end of the curve, which has been reflected in higher yields in short-dated credit.
- Spreads have widened from recent lows, but they remain short of elevated levels that are suggestive of recession.
- This pricing of spreads is reflective of stability in issuer fundamentals despite the hawkish tightening path.
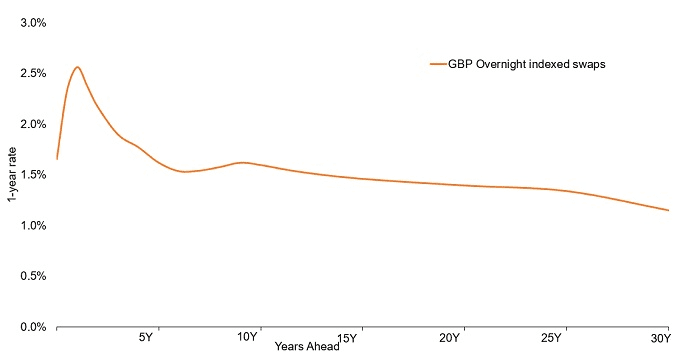
The gilt swaps curve has undergone a dramatic transformation. Spurred on by an uncertain economic outlook and anticipation that the Bank of England will have to deliver a series of rate hikes to deal with rising inflation, the curve – as indicated by sterling overnight indexed swaps – has inverted, with a peak in a year’s time from which rate expectations begin to fall.

Source: Bloomberg, 8 April 2022.
This inversion trend is due to a sharp rise in yields at the short end of the curve. From having a negative yield as late as February 2021, two-year gilts are now close to decade highs – reflecting not only three base rate rises from the Bank of England, but also expectations that further monetary tightening might be needed to curb inflation.
Longer-dated rates have risen over the same period1, but nowhere near the same extent. 10-year gilt yields are still well short of their past-decade highs.
Benchmark rates driving yields
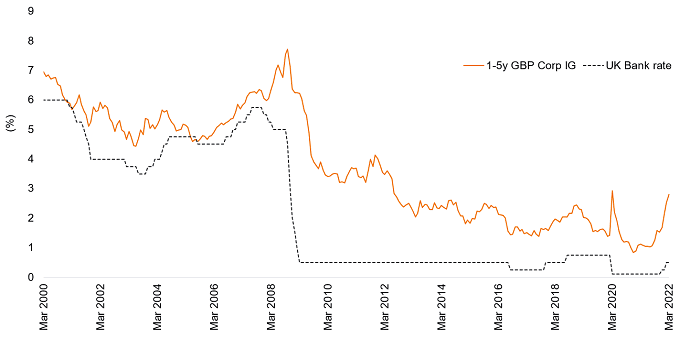
It is this shift in short-term sterling rates that has been driving up yields on short-term corporate bonds (1-5 years). Short-dated sterling corporate bonds were yielding 2.8% at the end of March 2022 – 82bps more than the 10-year average, and over three times the recent lows registered at the end of 2020 (Figure 2).

Source: Bloomberg, Janus Henderson Investors Analysis, as at 31 March 2022.
Should investors look through the rates noise, they can not only find yields for short-dated bonds close to decade highs, but an attractive risk-return potential relative to longer-dated assets due to the shape of the yield curve. This could present a potential opportunity for investors looking for yield enhancement to tactically enhance returns.
Spreads short of recent highs as fundamentals remain strong
Historically yield curve inversion was a negative signal for credit – indicating that the market was bracing for a potential recession, where rate hikes would need to be subsequently unwound to bolster economic activity. However, despite negative returns in the first quarter of 2022, following a spike in yields2, credit spreads indicate investors have not re-priced the risk of sterling corporate bonds to concerning levels.
Short-dated sterling corporate bonds began the year with lower-than-average spreads. The volatility seen over subsequent weeks, driven by conflict in Ukraine, has brought the extra yield required by investors to hold these bonds off recent lows. However, spreads to government bonds remain below the 75th percentile and even tighter on a swaps basis, trading at the lowest quartile levels at the end of March (Figure 3).
Figure 3: Spreads have widened, but are still short of recent highs
Short-dated sterling corporate bond spreads (31 December 2020 to 31 March 2022)
_
| Spread to Swaps | GBP Corp 1-5Y | GBP Corp All |
|---|---|---|
| Current | 87 | 136 |
| 31.12.2021 | 69 | 122 |
| 75th percentile | 148 | 192 |
| Median | 105 | 158 |
| 25th percentile | 85 | 141 |
Source: Bloomberg, Janus Henderson Investors Analysis, as at 31 March 2022.
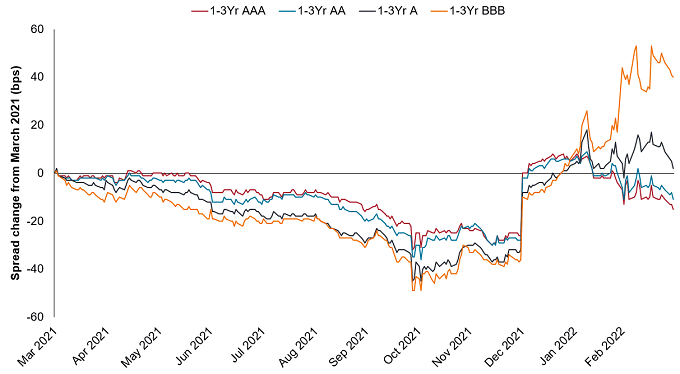
This is even more apparent when looking at the different silos of investment grade, where we see that spreads in the highest-rated part of the sterling corporate market have already returned to the same levels we saw a year ago. In fact, only spreads at the lowest rated (BBB) – and therefore more credit sensitive – part of the investment grade market remain materially higher than the levels registered a year ago, although even these have started to retreat from recent highs.

Source: Bloomberg, Janus Henderson Investors Analysis, as at 30 March 2022.
Throughout all this volatility, credit fundamentals in European credit remain robust, while borrowers can still access capital at low real rates. Leverage metrics for high quality borrowers in Europe remain healthy, and interest cover is at multi-decade highs3. European speculative grade default rates, meanwhile, remain broadly stable4. Bond spreads reflect this fundamental strength and shows the markets have not meaningfully re-priced risk in short-dated bonds.
Capturing value at the short end of the curve
We recognise that rising inflationary pressures – in conjunction with a slowdown in economic growth – means that monetary policy could overshoot and result in a policy mistake, as reflected in yield curve inversion. This brings uncertainty and volatility to rates markets. What is clear, though, is that the recent headwinds faced by corporate bonds have been largely driven by fluctuations in underlying benchmark rates, and not negative views about the creditworthiness of issuers. For investors with a gilt funding basis, this could present an attractive opportunity to capture short-dated cashflows to meet payment schedules or enhance returns while maintaining liquidity.
Sterling corporate bond: A bond issued by a company listed in pound sterling.
Gilts: British government bonds sold by the Bank of England in order to finance the British national debt.
Hawkish: indication that central bankers are looking to cut back on the money supply to achieve their policy objective.
Short-dated credit: Bonds with five years or less to their maturity date.
Spread/credit spread: The difference in the yield of a corporate bond over that of an equivalent government bond.
Swaps curve: Indication of interest rate expectations going forward based on how market participants are pricing swap contracts in which one side agrees to exchange financial instruments or cashflows or payments for a certain time.
Volatility: The rate and extent at which the price of a portfolio, security or index, moves up and down. If the price swings up and down with large movements, it has high volatility. If the price moves more slowly and to a lesser extent, it has lower volatility. It is used as a measure of the riskiness of an investment.
Yield: The level of income on a security, typically expressed as a percentage rate. For equities, a common measure is the dividend yield, which divides recent dividend payments for each share by the share price. For a bond, this is calculated as the coupon payment divided by the current bond price.
Yield curve: A graph that plots the yields of similar quality bonds against their maturities. In a normal/upward sloping yield curve, longer maturity bond yields are higher than short-term bond yields. A yield curve can signal market expectations about a country’s economic direction.
Fixed income securities are subject to interest rate, inflation, credit and default risk. The bond market is volatile. As interest rates rise, bond prices usually fall, and vice versa. The return of principal is not guaranteed, and prices may decline if an issuer fails to make timely payments or its credit strength weakens.
Credit quality ratings are measured on a scale that generally ranges from Aaa (highest) to C (lowest).
1 Source: Bloomberg, 19 February-31 March 2022.
2 Source: Bloomberg Sterling Aggregate Corporate Index, 31 March 2022.
3 Source: Morgan Stanley research, Bloomberg, MSCI, IBES, Factset. Net leverage European corporates, as at 30 September 2021. Note: MS use consensus GICS sector EBITDA growth estimates and zero debt growth to estimate median net leverage and interest coverage ratios based on a sample of European IG and HY corporates.
4 Source: Moody’s Investors Service, 12-month default forecasts, February 2022.
These are the views of the author at the time of publication and may differ from the views of other individuals/teams at Janus Henderson Investors. References made to individual securities do not constitute a recommendation to buy, sell or hold any security, investment strategy or market sector, and should not be assumed to be profitable. Janus Henderson Investors, its affiliated advisor, or its employees, may have a position in the securities mentioned.
Past performance does not predict future returns. The value of an investment and the income from it can fall as well as rise and you may not get back the amount originally invested.
The information in this article does not qualify as an investment recommendation.
Marketing Communication.