Emerging markets: Untangling the gordian knot of inflation
The inflation problem in emerging markets has become more complex to unravel and greater divergence between countries could emerge on the path to normalisation.

7 minute read
Key takeaways:
- Emerging markets (EMs) were on the front foot in tackling inflation, but this gordian knot remains an intricate problem for these economies.
- Stickier-than-expected inflation dynamics combine with food and energy being a higher proportion of EM consumer spend.
- Higher commodity prices are a double-edged sword for EM economies that tend to rely on either imports or exports. Countries’ fiscal resilience could be tested on the path to normalisation.
Unravelling the inflation knot
For Alexander the Great in the fourth century BC, cutting the gordian knot made light of an intractable problem, one that was easier to solve than the tangled knot of inflation facing emerging markets (EMs) today.
Volatility has been the foe of such countries, particularly in the currency space. During the depths of the Covid-19 pandemic, EM currencies suffered a significant, yet temporary, bout of weakness. Many EM currencies suffered high double-digit losses versus the US dollar over the first few months after the pandemic onset in March 2020, as risk assets sold off. As developed market central banks globally embarked on significant fiscal spending, sentiment quickly turned and those assets recouped most, if not all, of their losses in 2021.
The helping hand was so significant that EM central banks were anticipated to reach the peak of their hiking cycles. What was initially expected to be a quick bout of high inflation and return to average levels has stayed elevated for a long period of time and continues to grind higher. This is against a backdrop of countries in the developed world yet to clearly reach peak inflation.
Inflation reaches double-digits
Filling up your car with fuel has now become a stressful affair, as a paradigm of the squeeze on our purse strings. In the developed world, filling up your car at just shy of US$1.3 dollars per litre in the US feels steep. In EMs, such as the Central African Republic, the cost has passed US$2 dollars a litre1. Even lower fuel costs than this are hard for poorer consumers to absorb. As is inherent in EMs, there is variation in dynamics. Using some of the largest EM economies (ex-China) as barometers, a common factor is how relentless the inflation march higher has been. A simple average of these economies has crossed above 10% and every single country has had a significant increase over the year to date, with Turkey seeing as much as 80% inflation and Sri Lanka seeing nearly 55% (Figure 1). This has ignited social unrest in Sri Lanka as the country suffers a severe economic crisis amid sky high inflationary pressures. The government has restricted fuel supplies to deal with shortages while prices have more than doubled this year2.
Figure 1: Average EM inflation reaches double-digits
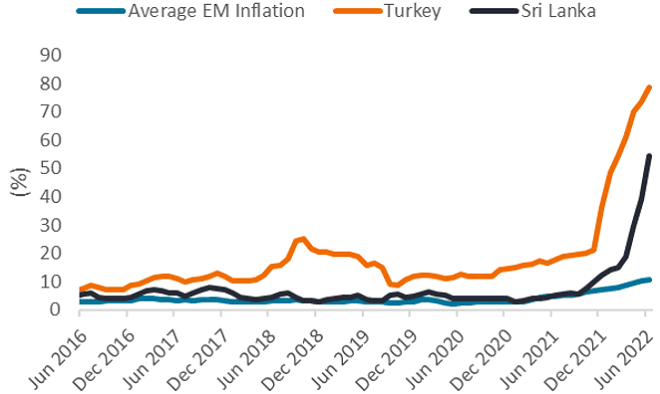
Source: Bloomberg, 30 June 2016 to 30 June 2022. Simple average of Mexico, Brazil, South Africa, Poland, Czech Republic, and South Korea (CPI y-o-y).
Despite EMs being further ahead in their hiking cycles, inflation data reports have continued to surprise and spook markets. Even as inflation has overshot expectations and forecasters have adjusted their numbers higher, markets have repeatedly been caught off guard. Since May 2021, inflation surprises have been consistently to the upside across EM regions and their amplitude has generally increased (Figure 2).
Figure 2: The amplitude of inflation surprises increased
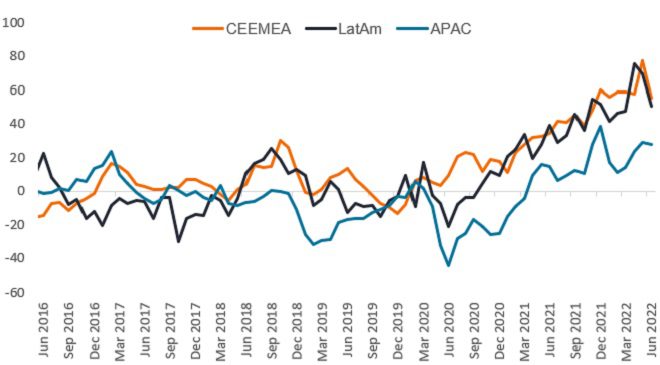
Source: Bloomberg, 30 June 2022. Above 0 is above consensus and below 0 is below consensus expectations. CEEMEA= Central and Eastern Europe Middle East and Africa. APAC= Asia Pacific. LatAm= Latin America.
A bigger food and energy tangle for EM
While higher inflation has been a global phenomenon, EM has suffered more due to the composition of spending patterns in these economies. Food and energy generally have a significant higher share of income expenditure in EM than developed economies. As such, with services inflation still moderate due to intermittent Covid-related lockdowns and re-openings coupled with disrupted supply chains, EM economies were the first in line to suffer the consequences of higher prices. Moreover, poorer countries (as shown in Figure 3 and 4 by lower GDP per capita) suffer from having a higher proportion of food and energy in their spending basket. This means that they are most exposed to swings in commodity prices and least able to endure such volatility given economic fragility.
Poorer countries proportionally suffer more on rising food and energy costs
Figure 3: GDP per capita versus food as % of CPI basket
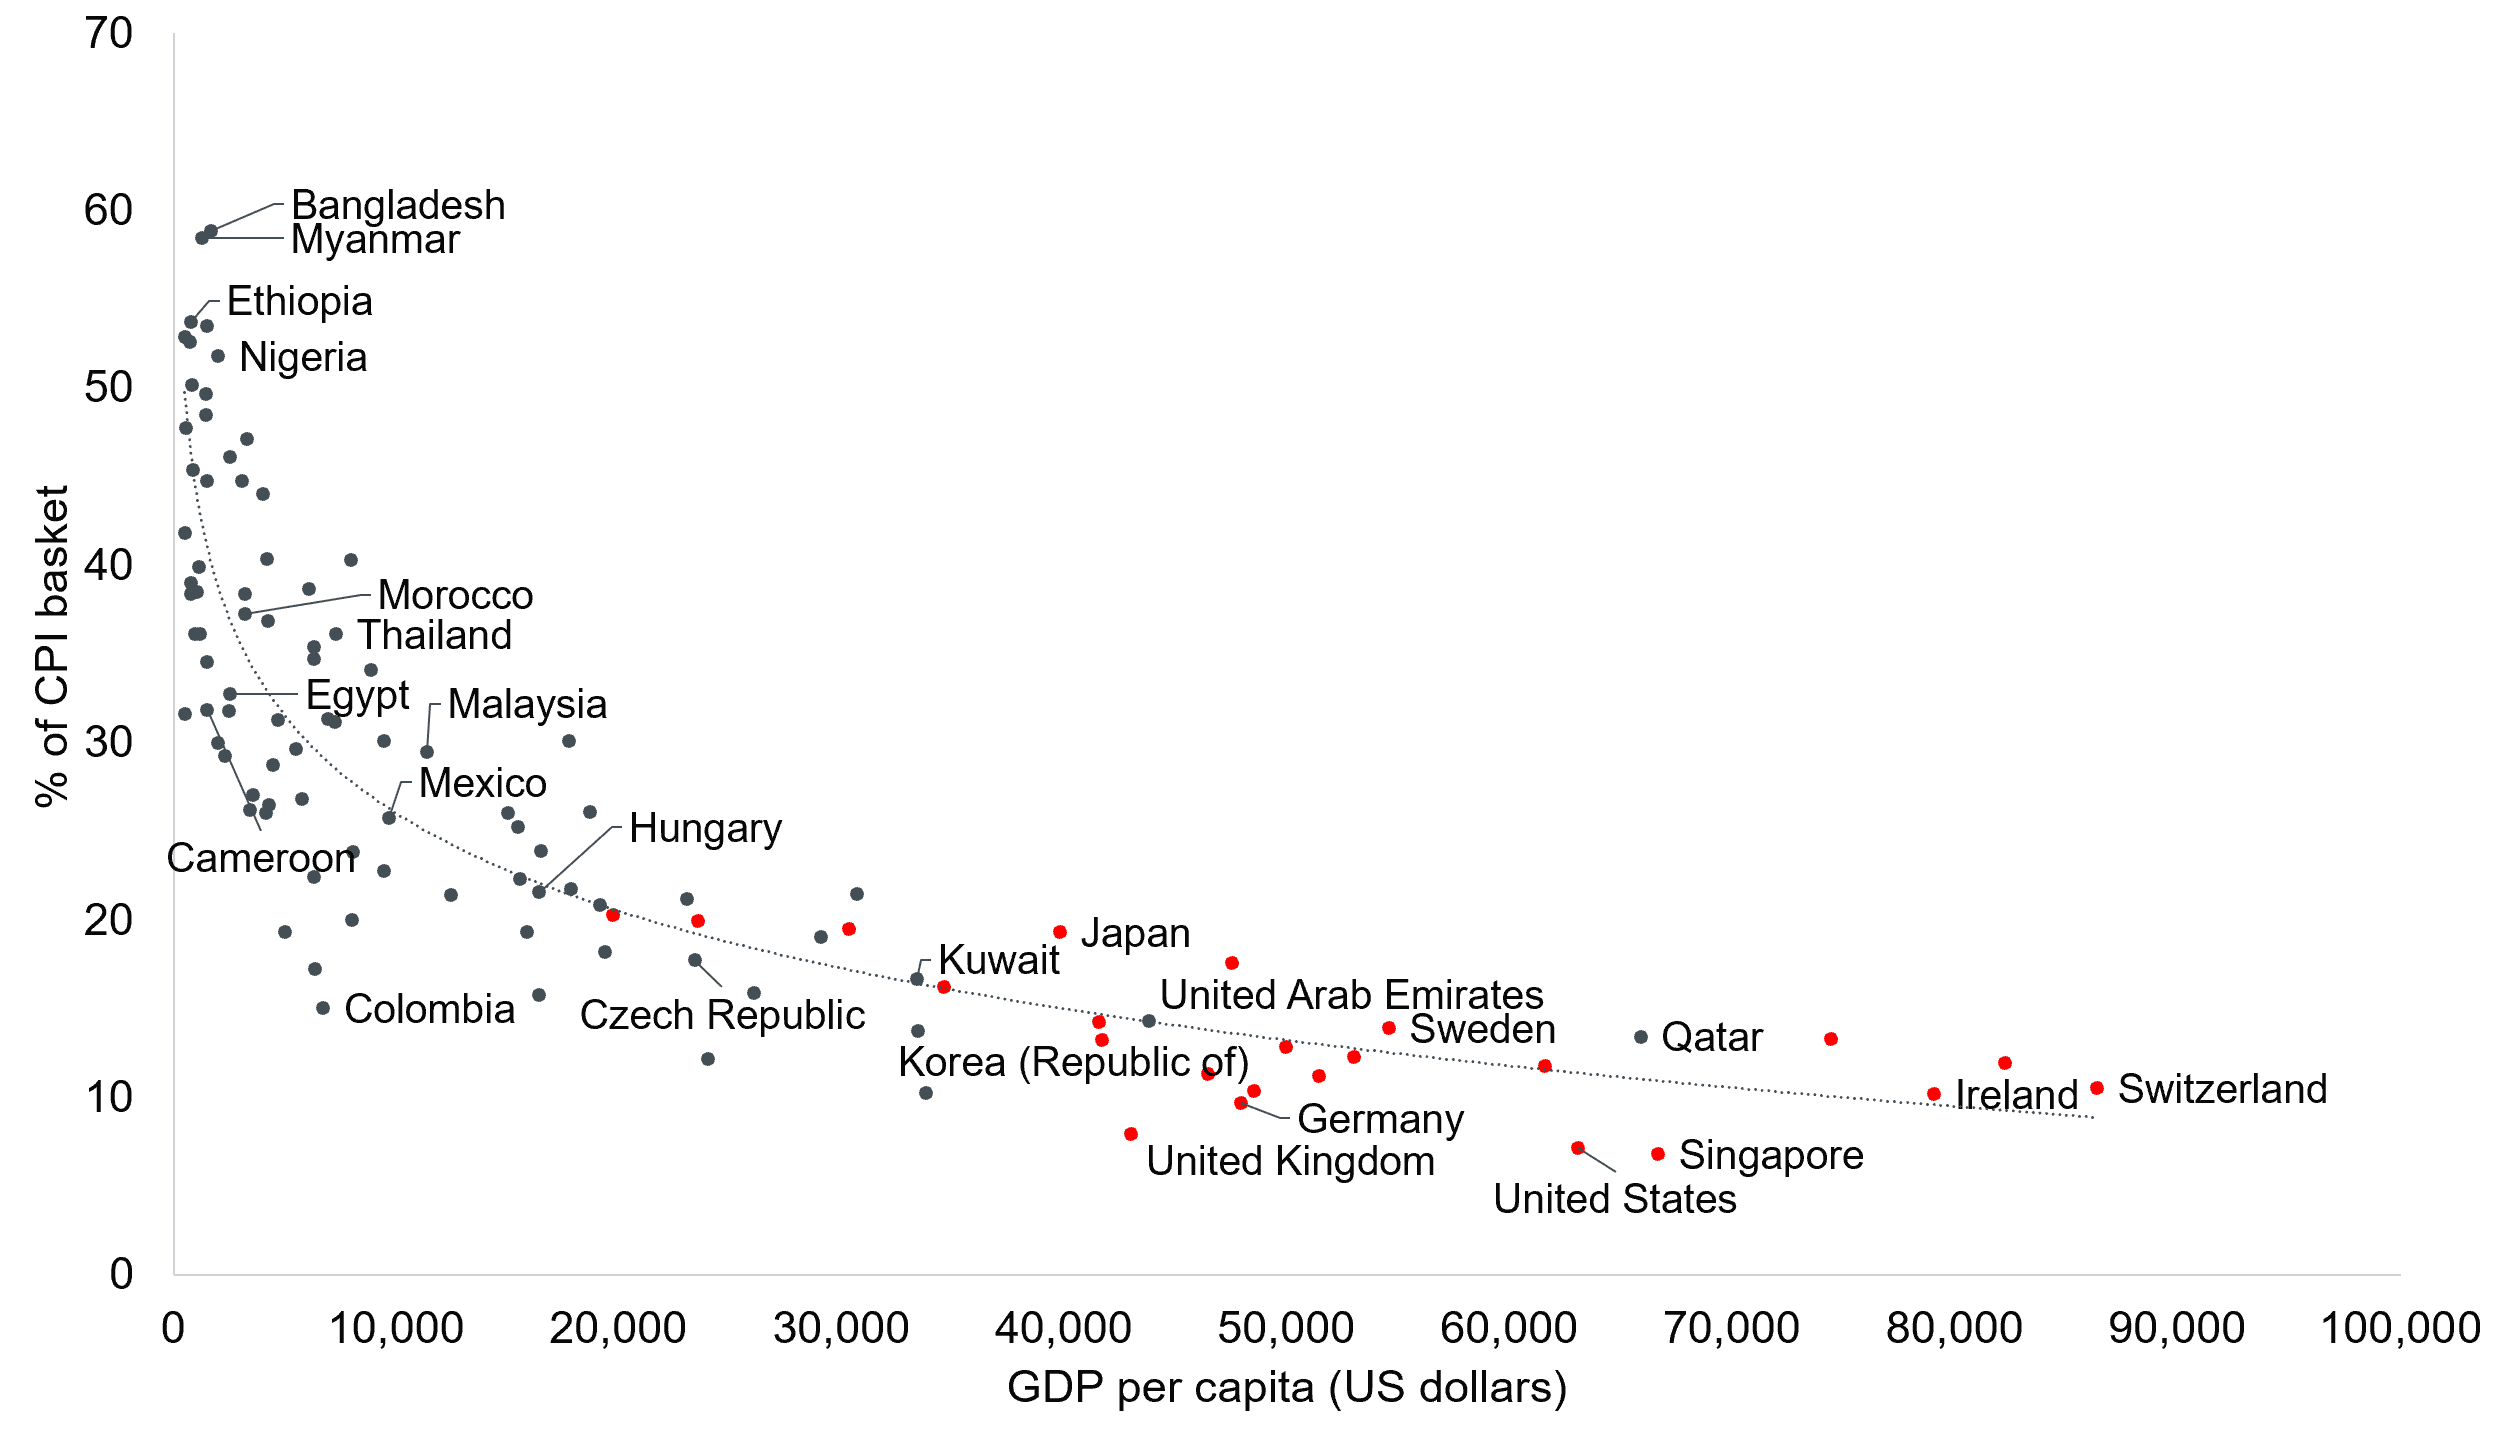
Source: IMF, Q3 2020. Developed market countries=red. EM countries=blue.
Figure 4: GDP per capita versus energy as % of CPI basket
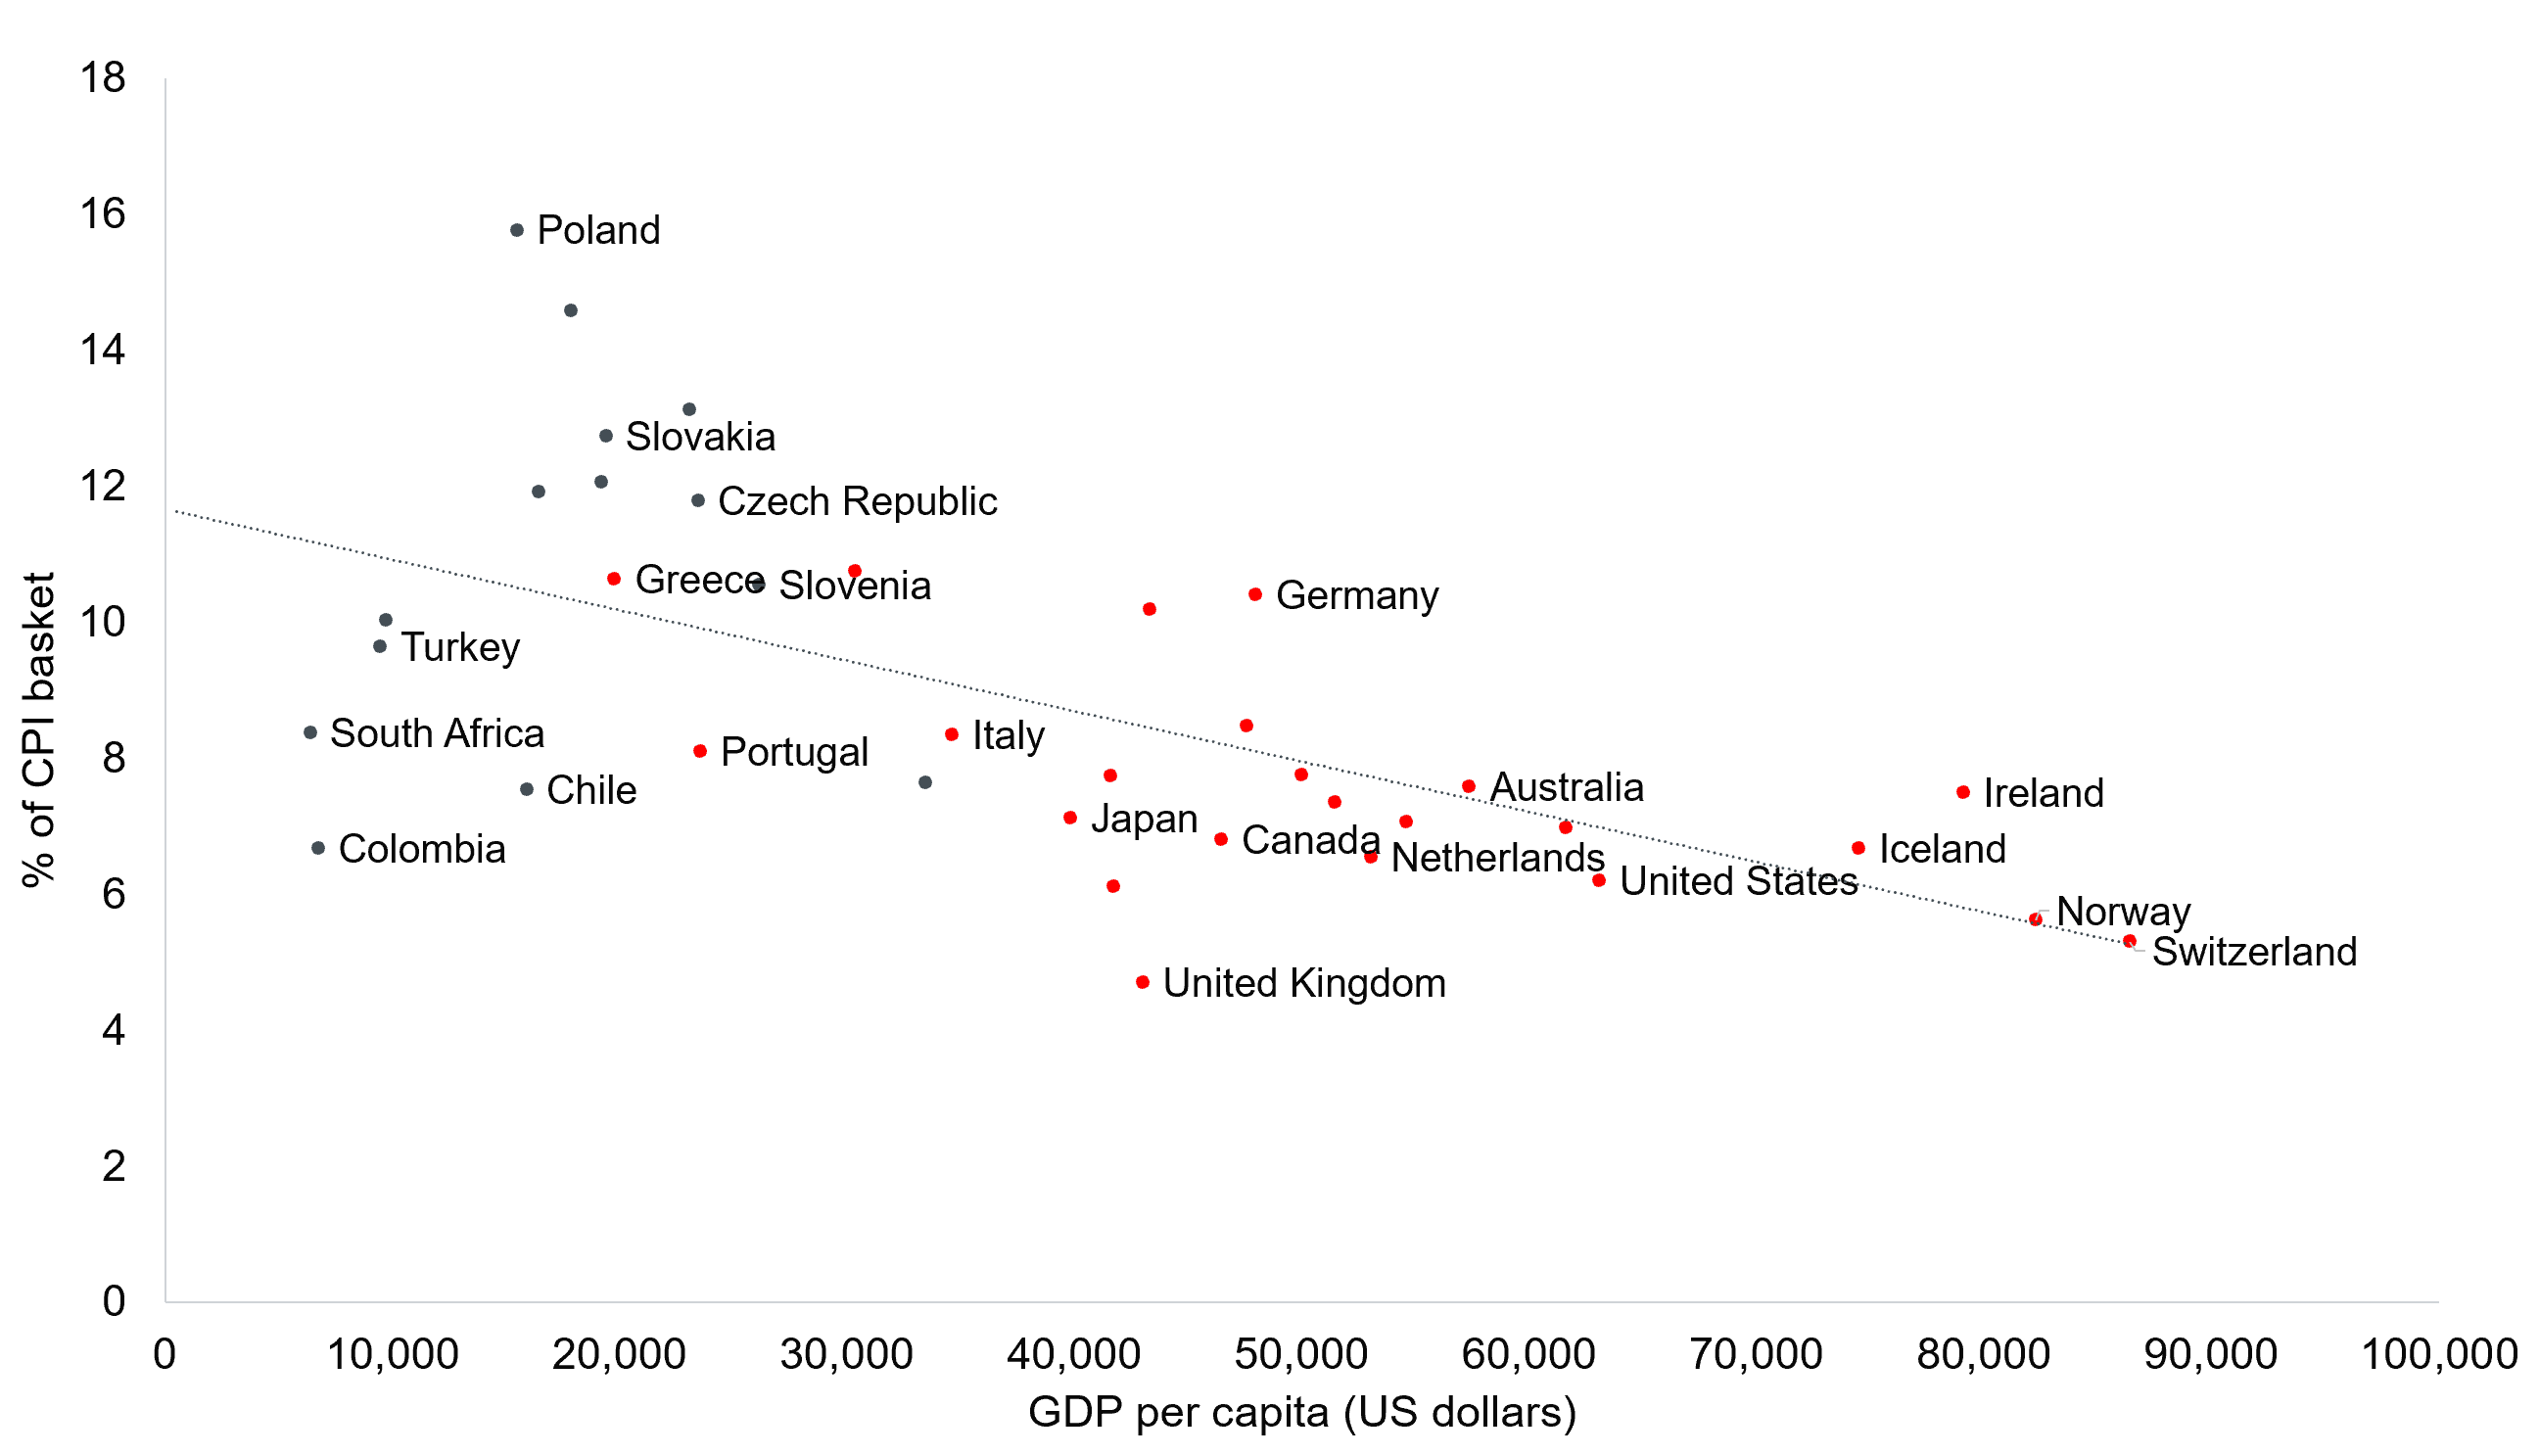
Source: IMF, Q3 2020. Developed market countries=red. EM countries=blue.
Higher commodity prices – a double edged sword
Nevertheless, for some EM economies higher prices can be beneficial. As many are significant commodity exporters (and often dominant ones), price increases have been very positive for their fiscal position. Terms of trade – the ratio between a country’s export prices and its import prices – have improved markedly for some economies. However, as the local population tends to be a stringent consumer of its export commodities, higher global prices create affordability and supply issues. As such, many countries opted for significant measures to reduce local prices and ensure availability, such as a palm oil exports ban in Indonesia and significant reductions in export quotas for soya producers in Argentina. Even as these measures are detrimental to the current accounts of these countries and their overall financial position, governments judged that a lack of basic staples for citizens would have worse consequences. There is still a risk of a pick-up in social unrest, like seen in Egypt, Ecuador and Sri Lanka. Governments have also been forced to offer subsidies on goods, which damages their fiscal positions, while current account resilience is dependent on countries’ terms of trade. This could culminate in a greater divergence in EM as those countries with stronger financial positions and political stability are likely more able to withstand the environment.
Price stabilisation in sight?
After a relentless climb higher in energy (up 450%) and food (up 70%) prices since the outbreak of the pandemic, recent stabilisation may give policymakers hope that the worst is behind them, see Figure 5. Such extreme inflationary pressures may start to abate towards the end of 2022. With a global recession broadly expected, EM central banks will most likely have a difficult job of keeping financial conditions tight enough to support their currencies, avoid second-round inflation pressures and provide enough liquidity for the system to support growth.
Figure 5: Food and energy prices have stabilised
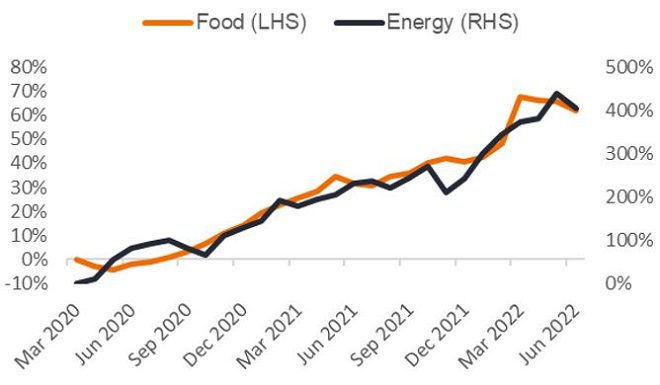 Source: Bloomberg, 30 June 2022. Food= FAO Food Price Index (FFPI). Energy= Brent crude (ICE).
Due to the extent and amplitude of these price moves, EM central banks have repeatedly revised their terminal rate – the one that is consistent with full employment and capacity utilisation and stable prices – higher. As many economies have significantly exceeded the level of rates pre-Covid, market participants have priced in a swift cutting cycle, but have been proved wrong many times. Nevertheless, some EM sovereign yield curves have cuts priced in within a year.
Divergence to increase
Our view is that central banks will first and foremost want to tame current price pressures and will likely hike rates until they believe these are under control. Moreover, bar a deep global recession causing sharp broad-based negative price pressures, we strongly believe central banks will be slow to start to undo recent hikes. While interest rate cuts may happen, we expect them to be very gradual. In addition, there are still some countries in EM, such as Indonesia, that have different inflationary dynamics. More divergence in EM is set to emerge as countries unpick the twists and turns of the various gordian knots. In addition, price stabilisation potential and much higher yield levels relative to DM highlights the opportunity of EM debt to add significant carry to portfolios, so long as careful due diligence can be performed to pick the stronger countries.
Footnotes
1 Source: Global Petrol prices, gasoline prices in US dollars per litre as at 18 July 2022.
2 Sri Lanka fuel inflation has risen by 165%. Ceylon Petroleum Corporation, as at 17 July 2022.
Volatility: The rate and extent at which the price of a portfolio, security or index, moves up and down. If the price swings up and down with large movements, it has high volatility. If the price moves more slowly and to a lesser extent, it has lower volatility. Higher volatility means the higher the risk of the investment.
Gross domestic product (GDP): The value of all finished goods and services produced by a country, within a specific time period (usually quarterly or annually). It is usually expressed as a percentage comparison to a previous time period, and is a broad measure of a country’s overall economic activity.
Fiscal/Fiscal policy: Connected with government taxes, debts and spending. Government policy relating to setting tax rates and spending levels. It is separate from monetary policy, which is typically set by a central bank. Fiscal austerity refers to raising taxes and/or cutting spending in an attempt to reduce government debt. Fiscal expansion (or ‘stimulus’) refers to an increase in government spending and/or a reduction in taxes.
Emerging market: Countries that are transitioning away from being a low income, less developed economy to one that is more integrated with the global economy and is making progress in areas such as depth and access to bond and equity markets and development of modern financial and regulatory institutions.
Fiscal position: This refers to fiscal balance – the amount of money that a government receives from tax revenue and the proceeds of assets sold, minus any government spending.
Liquidity: The ability to buy or sell a particular security or asset in the market. Assets that can be easily traded in the market (without causing a major price move) are referred to as ‘liquid’.
Capacity utilisation: This measures the extent to which the productive capacity of a business or nation that is being used.
Carry: The benefit or cost of holding an asset. For a bond investor, this includes the interest paid on the bond together with the cost of financing the investment and potential gains or losses from currency changes.
Terminal rate: The rate that is consistent with full employment and capacity utilisation and stable prices. Also called the natural or neutral interest rate.
These are the views of the author at the time of publication and may differ from the views of other individuals/teams at Janus Henderson Investors. References made to individual securities do not constitute a recommendation to buy, sell or hold any security, investment strategy or market sector, and should not be assumed to be profitable. Janus Henderson Investors, its affiliated advisor, or its employees, may have a position in the securities mentioned.
Past performance does not predict future returns. The value of an investment and the income from it can fall as well as rise and you may not get back the amount originally invested.
The information in this article does not qualify as an investment recommendation.
Marketing Communication.