Look beneath the surface for small- and mid-cap opportunities
The Portfolio Construction and Strategy Team discusses why they believe, by taking an active approach that focuses on profitable companies, the small- and mid-cap space may present opportunities in the current economic environment.


4 minute read
US small- and mid-cap companies are typically levered to the economic cycle and have historically outperformed large caps during the early stages of recoveries.
Recap Q1 2023
- Persistent inflation, a historic increase in interest rates, and recession fears were the major drivers of double-digit losses across many US equity asset classes in 2022.
- The increase in cost of capital – aka, discount rate – negatively impacted valuations and put greater downward pressure on longer-duration growth equities relative to value.
- Small caps typically lead large caps in losses going into periods of weakness, as evidenced by small caps reaching a 2022 low of -27% in June while large caps bottomed out in October at -25%.
Figure 1: Q1 2023 US equity returns by style and size
| Value | Core | Growth | |
|---|---|---|---|
|
Large
|
2.5% | 8.8% | 15.5% |
|
Mid
|
1.3% | 3.5% | 7.6% |
|
Small
|
-3.1% | 0.9% | 4.8% |
Source: Morningstar. Style/size in the table based on Russell indices. Past performance does not predict future returns.
Figure 2: Cumulative return from start of recession through next 12 months after recession
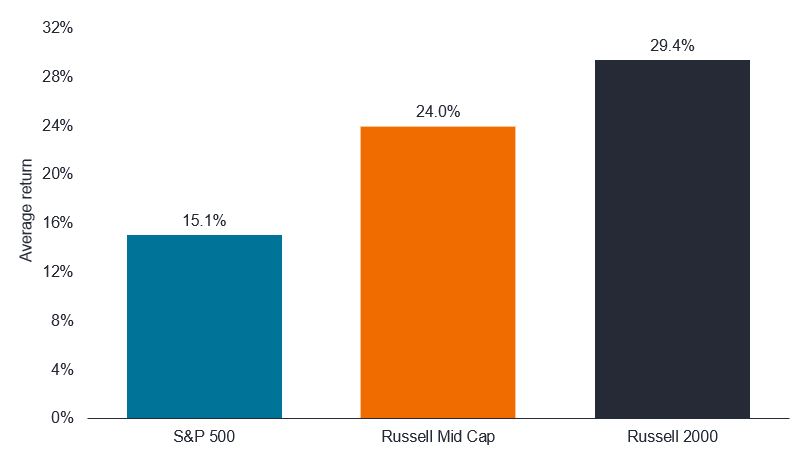
Source: 1980-2022. Morningstar, National Bureau of Economic Research, US Bureau of Labor Statistics, Bureau of Economic Analysis. As at 31 March 2023. Past performance does not predict future returns.
Outlook
- US small- and mid-cap companies are typically levered to the economic cycle and historically outperform large caps during the early stages of recoveries, as large companies are generally slower to respond to a changing economic environment.
- The excesses of the last several years have been shed in the small- and mid-cap universes, with absolute valuations now well below historical averages and relative valuations (vs. large caps) nearing the lows of the early 2000s.
- Small- and mid-cap companies tend to be more US-centric, potentially benefiting from long-term themes of reshoring/deglobalisation, while also being less sensitive to US dollar fluctuations.
Figure 3: Small- and mid-caps remain historically cheap vs. large-caps
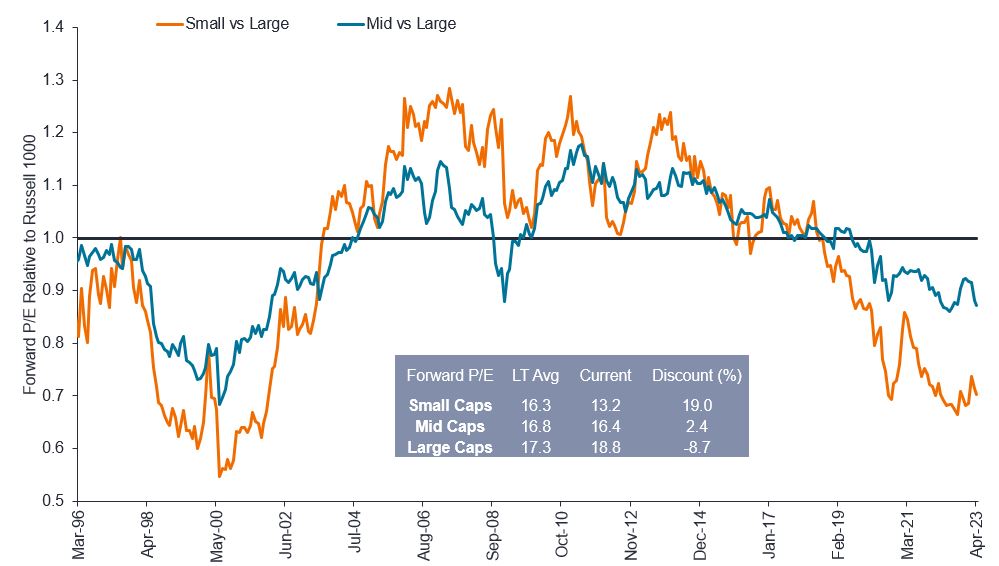
Source: FactSet, as at 30 April 2023. Small capitalisation = Russell 2000 index; Mid capitalisation = Russell Mid Cap Index; Large capitalisation = Russell 1000 index. Past performance does not predict future returns.
PCS Perspective
- Equity allocations are often top-heavy with an overweight to large caps, creating a potential opportunity to move down in cap size, broaden the equity footprint, and take advantage of the current market environment on two fronts:
- Valuations: Small/mid-cap valuations are near historical lows and look appealing from an absolute and relative (vs. large caps) standpoint; starting from these levels has historically been attractive when looking at forward returns.
- Economic recovery: Small/mid-caps can be quick to rebound as they are structurally overweight cyclical sectors such as industrials, financials, materials, and energy compared to large caps.
- Regional diversification: As small- and mid-cap companies tend to be more US-centric, non-US investors, such as European investors, can benefit from the regional diversification, in addition to a broadened cap size exposure.
- Finally, we believe it is prudent to take an active approach in the small/mid-cap space to focus on higher-quality companies and avoid unprofitable ones – roughly 25% of stocks in the Russell 2500 Growth Index currently do not earn money, which highlights the need for an experienced, active manager to identify opportunities in quality companies. 1
Footnotes
1Source: Janus Henderson Investors, as at 31 December 2022.
Price-to-Earnings (P/E) Ratio measures share price compared to earnings per share for a stock or stocks in a portfolio.
Russell 1000® Index reflects the performance of US large-cap equities.
Russell 2000® Index reflects the performance of US small-cap equities.
Russell 2500™ Growth Index reflects the performance of US small to mid-cap equities with higher price-to-book ratios and higher forecasted growth values.
Russell 3000® Index reflects the performance of broad US equities.
Russell Midcap® Index reflects the performance of US mid-cap equities.
S&P 500® Index reflects US large-cap equity performance and represents broad US equity market performance.
IMPORTANT INFORMATION
Actively managed portfolios may fail to produce the intended results. No investment strategy can ensure a profit or eliminate the risk of loss.
Growth stocks are subject to increased risk of loss and price volatility and may not realise their perceived growth potential.
Smaller capitalisation securities may be less stable and more susceptible to adverse developments, and may be more volatile and less liquid than larger capitalisation securities.
Value stocks can continue to be undervalued by the market for long periods of time and may not appreciate to the extent expected.
These are the views of the author at the time of publication and may differ from the views of other individuals/teams at Janus Henderson Investors. References made to individual securities do not constitute a recommendation to buy, sell or hold any security, investment strategy or market sector, and should not be assumed to be profitable. Janus Henderson Investors, its affiliated advisor, or its employees, may have a position in the securities mentioned.
Past performance does not predict future returns. The value of an investment and the income from it can fall as well as rise and you may not get back the amount originally invested.
The information in this article does not qualify as an investment recommendation.
Marketing Communication.