Is all the bad news over for the equity market?
Markets have been gripped by renewed and higher volatility in 2022, but has it turned equities into a buy? Portfolio Manager Oliver Blackbourn considers what current market indicators suggest.


12 minute read
Key takeaways:
- Higher interest rates are a problem for valuations, raising concerns about how the economic cycle may develop from here and the potential impact on corporate earnings.
- The biggest challenge for asset classes has been the rise in real bond yields over the past nine months, from what were historic lows.
- While positive shorter-term sentiment and positioning indicators suggest potential near-term bounces, these may fizzle out, rather than being the start of new market upswings.
As much as we have looked to engage with bear market rallies at times over the past few months, we have been bearish on many assets for much of 2022. The acceleration in inflation and the belated, but increasingly hawkish, central bank reaction has sent most asset classes tumbling. It is therefore no surprise that a frequent question we are asked is what might drive us to meaningfully increase our equity exposure.
We remain cautious for the time being, due to the messages that we are getting from the framework that we use to analyse markets. Our positioning and sentiment indicators are somewhat mixed, with tensions between shorter-term ‘oversold’ signals and longer-term indicators that suggest investors remain fully-invested bears. Increasingly hawkish monetary policy remains a real problem for valuations across asset classes and we are worried about how the economic cycle may develop from here and the potential impact on corporate earnings.
The framework
To understand how we see the current situation in markets, it is important to understand that our dynamic asset allocation framework focuses on three key areas: the cycle; policy; and sentiment/positioning.

Source: Janus Henderson Investors, as at 21 June 2022.
While pockets of information suggest we could be approaching a buying point (for example in some shorter-term sentiment indicators), we still struggle to put together a complete argument that would make us much more positive on equities. At the same time, there are still indicators that suggest the downward move still has significant momentum.
The real problem for equities
The biggest challenge for asset classes has been the reversal in real bond yields over the past nine months, from what were historic lows. Real yields were very negative as central banks continued with asset purchases in the face of a strong economic recovery in 2021 and rising inflation expectations. With nominal bond yields pinned close to lows by quantitative easing and very dovish forward guidance, increasing breakeven rates (suggestive of higher inflation) were crushing real yields. Markets used strong demand for US 10-year Treasury Inflation-Protected Securities (TIPS) as a justification for high price-to-earnings (P/E) ratio multiples on equities, particularly for growth-style stocks. This led to many stock market indices arguably looking very expensive coming into 2022, with the NASDAQ 100 Index playing the role of poster child.
The dramatic acceleration in inflation across most developed markets has seen a complete shift in central bank policy, most recently with the US Federal Reserve (Fed) increasing interest rates by 0.75%, following what appeared to be a very last-minute nod to markets that such a move was coming. The change in monetary policy stance to hawkishness across many developed market central banks has entirely revamped the real yield landscape. The real yields on 10-year US Treasury bonds have risen from lows around -1.20% in November 2021 to recent highs above +0.60%, with other major sovereign bond markets now rushing to catch up.
The impact on equity market valuations has been painful. The forward 12-month P/E on the S&P 500 Index has declined from 21.7 at the turn of the year to 15.9[1], a 25% compression in valuation. While this is back to a level consistent with the range seen in the latter half of the last decade, it is still far from low relative to the longer history. The impact on the NASDAQ 100 has been even greater, with the 12-month forward P/E ratio collapsing from 29.4 at the end of December 2021 to below 20, a stark retrenchment in the multiple that investors are willing to pay for what is considered a high-growth index. Overall, global equity valuations have fallen to levels that could be considered average, or arguably more like ‘fair value’, purely relative to their own history (Exhibit 1). However, it is more difficult to argue that P/E ratios are outright cheap and create a buying opportunity on their own merit.
Exhibit 1: Impact of US 10-year real yields on global equity valuations
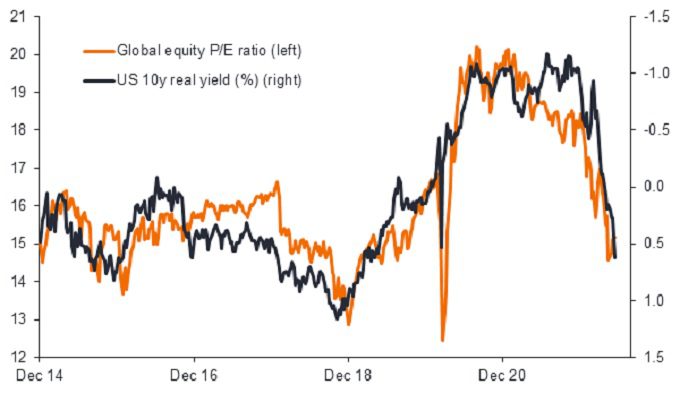
Source: Janus Henderson Investors, Refinitiv Datastream, as at 18 June 2022. Global equities = MSCI AC World, P/E ratio = price-to-earnings ratio. Past performance does not predict future returns.
Returning to our framework and the policy component, we tend to think of policy as creating catalysts that can lead to inflections in the direction of markets. Applying this to recent performance, it seems clear that a sharp change in monetary policy has been fundamental to the decline in equity markets this year. Therefore, in terms of reasons for markets to stabilise, we would look for a shift away from current extreme hawkishness to break the upward momentum in real yields and take the downward pressure off equity valuations.
If anything, however, we have seen the Fed shift in the opposite direction, with their latest 0.75% hike and Chair Powell indicating that this pace could continue. It is likely that we will need to see inflation peak and start to decline more rapidly than expected, while at the same time labour market tightness easing, to really drive a shift towards a more dovish stance. For the time being, the stance appears to be one of seemingly fighting inflation at any cost to growth.
To be or not to be a recession
Of course, economic growth is the balancing item when it comes to central banks looking to get high inflation under control. High inflation and rising interest rates have raised concerns among investors that we may see a recession in the next 18 months. This would represent a further challenge for equities, most likely affecting both earnings and valuations, as economic contraction could lead to a further decrease in the latter while directly leading to a fall in the former.
Bloomberg’s tracker of consensus probabilities for recessions in the US, Eurozone and UK over the next year have been rising since the end of February and now stand at around a third for each region[2]. This is not insubstantial, but the horizon is also a little earlier than many commentators who have elevated expectations for economic contractions in the second half of 2023. There is little sign that this is leading to concerns in analyst expectations for earnings over 2022, 2023 or even into 2024 just yet, as Exhibit 2 suggests.
Exhibit 2: Global equity earnings level forecasts
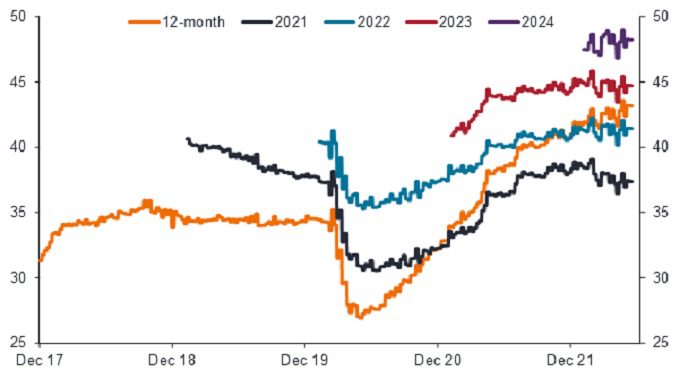
Source: Janus Henderson Investors, Refinitiv Datastream, as at 18 June 2022. Global equities = MSCI AC World Index. Chart shows the change in analysts’ forecasts for earnings per share (EPS). Despite recession concerns, the data shows no significant fall in earnings expectations.
While the outlook for global earnings over the next few years has stalled in 2022, there have yet to be any meaningful downgrades. The 12-month forward earnings figure continues to rise as analysts predict 8-10% growth in each of the coming years[3]. However, it would be unusual for analysts to predict a recession or earnings contraction so far out. If earnings forecasts do start to roll over, it is important to remember that recessions tend to lead to significant profit declines (commonly at least 20%), even for milder economic contractions.
Even without a recession, corporate earnings face a more difficult outlook given the starting point. Profit margins are at extremely high levels, with the prospect of further expansion likely compromised by the elevated levels of inflation and tightening monetary policy. Inflation is pushing up costs, with commodity prices rocketing, bottlenecks in supply chains leading to greater competition for inventory from suppliers, and the resurgent power of labour to demand higher pay. At the same time, central banks have been tightening monetary conditions, pushing up borrowing costs from historic lows as interest rates are hiked, government bond yields have risen and credit spreads have widened.
Exhibit 3: US corporate profits and employee salary costs
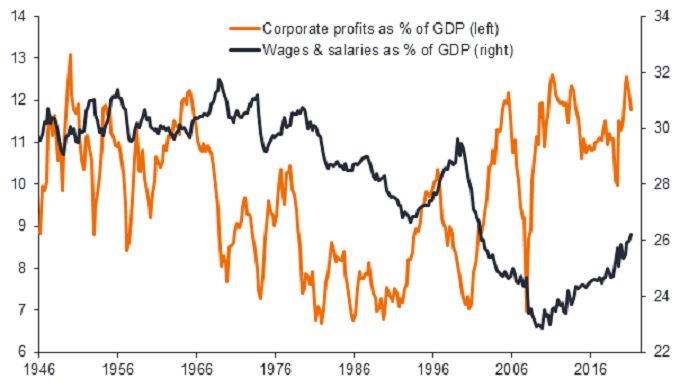
Source: Janus Henderson Investors, Refinitiv Datastream, 20 December 1946 to 15 February 2022. Past performance does not predict future returns.
The latest completed quarterly earnings reporting season for the S&P 500 Index showed sales growth at 13%, but profits only rising by nearly 8%[4]. Across the different sectors, less than half were able to meaningfully increase profits. In terms, of market capitalisation, these only make up around a fifth of the index. This came against the usual plethora of surprises, but paints a more challenging outlook for profits, even if sales remain solid.
While the prospect for recessions has been growing, in many commentators’ minds they remain in the balance. Analysts are unlikely to start wholesale downgrading of earnings without strong signs that growth is rolling over. Therefore, any deterioration in earnings is likely to be a lagging indicator of market behaviour, explaining rather than helping to forecast price moves. At the same time, it is difficult to see how the negative factors likely to weigh on earnings can reverse quickly. From a cycle perspective, it is thus difficult to be overly optimistic on the outlook for equities, with any short-term optimism about the ongoing economic recovery balanced by medium-term concerns about recession and likely profit margin compression.
The sentimental investor
With the economic backdrop looking challenging, and central bank policy driving sizeable valuation drawdowns in 2022 already, it is wholly unsurprising that shorter-term sentiment indicators are looking very bearish. However, we find the overall picture more mixed once we bring in positioning data, which suggests that investors have likely yet to fully capitulate.
A quick glance at our dashboard of shorter-term sentiment indicators shows a number flashing green, suggesting that investors have become too bearish and that price moves have become extended. Market surveys looking at individual investor and advisor sentiment are close to historic lows (Exhibit 4), with a reasonably negative picture emerging among active investment managers as well. The weekly individual investor net measure of bulls versus bears (optimists versus pessimists) is in the first percentile relative to its 35-year history and the adviser equivalent is in the bottom decile since it began in 1969[5], underlining this view on negative sentiment.
Exhibit 4: US individual investor sentiment survey net responses (%)
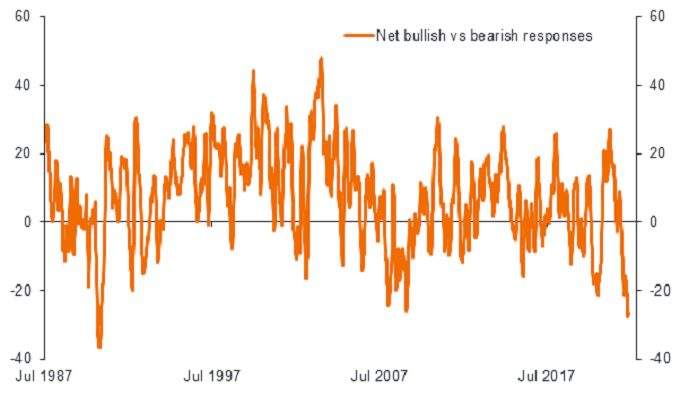
Source: Janus Henderson Investors, Refinitiv Datastream, 19 June 1987 to 18 June 2022. Eight-week moving average of the bullish (positive outlook) vs bearish (negative) responses.
At the same time, we can find significant protection buying in derivatives markets, indicating that investors are worried about declining stock prices and wish to hedge against further market falls. This comes despite price levels already being at historically low levels relative to analyst targets, and with indices trading at very low levels, both of which often suggest that moves are overdone in the short term.
However, the longer-term positioning picture gives a contrasting backdrop to this picture. In the latest release for the first quarter of 2022, the Fed’s survey of US households’ financial assets showed that the allocation to equities remains close to a peak at 40% (Exhibit 5). This is backed up by more frequent information on portfolio allocations from the wealth management departments at large US investment platforms. From such a high starting point, we would expect very low long-term returns. But it also complicates our efforts to understand the point at which markets have truly capitulated.
Exhibit 5: US household allocations to equities and 10-year forward returns
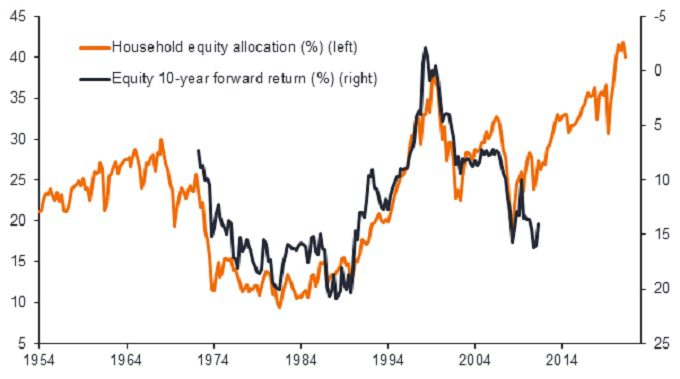
Source: Janus Henderson Investors, Refinitiv Datastream, as at 18 June 2022. US household allocations to equities as a % of financial assets. 10-year forward returns on Refinitiv US total equity market index. Past performance does not predict future returns.
The picture from flow data so far in 2022 further muddles the picture. Equities have seen over US$200 billion of inflows this year[6], despite stock markets being in drawdown essentially since the end of December. The buy-the-dip mentality appears to be strong in shares, particularly given that US$170 billion6 has been redeemed from fixed income markets. It is difficult to argue for widespread capitulation among equity investors when there have been net inflows into the asset class, despite the rapid market decline.
The overall sentiment and positioning picture remains more complicated than just looking at certain narrower selections of surveys might have you believe. We must respect the longer-term positioning at the same time as being aware of the stretched short-term data. However, more generally, stretched sentiment and positioning broadly creates conditions for a market inflection point, indicating fragility about the prevailing price direction. It generally takes a catalyst from one of the other two components – the cycle or policy – to push an investor re-think.
Looking forward
While we can find positive shorter-term sentiment and positioning indicators that could drive short-lived market rebounds, we think that these bounces are more likely to falter, rather than becoming a sustained upward shift in market direction. The longer-term positioning picture suggests that investors have yet to really capitulate across the board and remain fully invested bears, making it difficult to build an iron-clad case against the downward momentum on this basis. At the same time, with central banks fully committed to bringing down inflation at all costs, it seems unlikely we will see a rapid reversal in policy that has been so damaging to risk asset valuations. Finally, recession risks are rising and could challenge the solid earnings outlook forecast, creating a further downside risk to stocks.
So what are we looking for to change the overall direction of stock markets? Perhaps the single most important factor would be signs that central bank policy is softening, although to get this without a recession depressing demand is difficult to envisage. Easing supply constraints in the energy and labour markets would help but require structural shifts that are unlikely to happen in the short term. Beyond this, we would need to see evidence that investors have fully capitulated and that valuations have fallen so far as to make risk assets attractive regardless of any economic headwinds. However, this would only likely come after yet another precipitous collapse in prices.
In the meantime, UK equities have been beneficiaries in a world of rising inflation, while also showing some defensive characteristics. We can also see a better outlook for Chinese equities where fiscal and regulatory policy has shifted in their favour after a difficult period, and where the central bank has been actively trying to stabilise the economy. Markets also show greater signs of previous capitulation there, creating a better base for share prices as investors re-engage. However, outside of these two areas, we generally remain more cautious on the outlook for stock markets.
[1] Source for P/E data: Refinitiv Datastream, as at 21 June 2022.
[2] https://www.bloomberg.com/news/articles/2022-05-13/odds-of-a-us-recession-within-next-year-now-30-survey-shows
[3] Refinitiv Datastream, as at June 2022.
[4] Bloomberg, S&P 500 Index, results period ending 15 May 2022.
[5] Refinitiv Datastream, 11 June 1969 to 15 June 2022.
[6] Source: Bank of America Global Research, June 2022.
Monetary policy: The policies of a central bank, aimed at influencing the level of inflation and growth in an economy. It includes controlling interest rates and the supply of money.
Hawkish monetary policy: Policy from central banks using higher interest rates to try and curb inflation.
Dovish monetary policy: Monetary policies advocating low interest rates to stimulate economic activity.
Economic cycle: Fluctuations of the economy between periods of growth and contraction.
Bond yields: The level of income on a security, typically expressed as a percentage rate. For a bond, this is calculated as the coupon payment divided by the current bond price. Higher bond yields means falling bond prices.
Bearish/bear market rally: A bear market is where which the prices of securities are falling. A generally accepted definition is a fall of 20% or more in an index from its high. A bearish view is one that is negative on stock market expectations. A bear market rally refers to a sharp, short-term rebound in share prices during this period.
Central bank asset purchases: Central banks have used asset purchase programmes, such as quantitative easing (QE) to help improve financial conditions, revive lending/borrowing and stimulate economic activity. The purchases have been concentrated in government securities and related assets. The US Federal Reserve ended these purchase programmes in the first quarter of 2022.
Real yields/nominal yields: Nominal yield is coupon rate on a bond. The real yield is the nominal yield of a bond minus the rate of inflation.
Breakeven rates: The difference in yield between inflation-protected and nominal debt of the same maturity. Higher breakeven rates relative to real yields suggests expectations for inflation to increase.
TIPS: Treasury Inflation-Protected Securities.
Price/earnings (P/E) ratio: A popular ratio used to value a company’s shares, compared to other stocks, or a benchmark index. It is calculated by dividing the current share price by its earnings per share.
Growth stocks: Growth investors search for companies they believe have strong growth potential. Their earnings are expected to grow at an above-average rate compared to the rest of the market, and therefore there is an expectation that their share prices will increase in value.
Forward price-to-earnings (forward P/E): A version of the P/E ratio that uses forecasted earnings for the P/E calculation. A high forward P/E can suggest expectations for higher earnings in future, relative to companies with lower forward P/Es.
Basis points (bps): Basis points (bps) are a common unit of measure for interest rates and other percentages in finance. One basis point is equal to 1/100th of 1%, or 0.01%, A 75bps hike in interest rates is an increase of 0.75%.
Labour market tightness: Where there are numerous vacancies relative to the number of unemployed workers, which you would expect to push up wages.
Credit spreads: The difference in yield between bonds of a similar maturity but with different credit quality.
Recession: A period of economic contraction (decline) for a country, generally identified by a fall in gross domestic product (GDP) over two successive three-month periods (quarters).
Market capitalisation (market cap): The total market value of a company’s issued shares. It is calculated by multiplying the number of shares in issue by the current price of the shares. The figure is used to determine a company’s size.
Derivatives (buying protection): Derivatives are a financial product where price and performance is derived from that of another financial product, such as a share or bond. Trading in derivatives can be used speculatively, or to try and reduce (hedge) risk. Those investors buying ‘protection’ are looking to reduce the impact of a particular expected event, such as a market fall.
Volatility: The rate and extent at which the price of a portfolio, security or index, moves up and down. If the price swings up and down with large movements, it has high volatility. If the price moves more slowly and to a lesser extent, it has lower volatility. Higher volatility means the higher the risk of the investment.
These are the views of the author at the time of publication and may differ from the views of other individuals/teams at Janus Henderson Investors. References made to individual securities do not constitute a recommendation to buy, sell or hold any security, investment strategy or market sector, and should not be assumed to be profitable. Janus Henderson Investors, its affiliated advisor, or its employees, may have a position in the securities mentioned.
Past performance does not predict future returns. The value of an investment and the income from it can fall as well as rise and you may not get back the amount originally invested.
The information in this article does not qualify as an investment recommendation.
Marketing Communication.
12 minute read
Key takeaways:
- Higher interest rates are a problem for valuations, raising concerns about how the economic cycle may develop from here and the potential impact on corporate earnings.
- The biggest challenge for asset classes has been the rise in real bond yields over the past nine months, from what were historic lows.
- While positive shorter-term sentiment and positioning indicators suggest potential near-term bounces, these may fizzle out, rather than being the start of new market upswings.