The destructive power of portfolio volatility (and what investors can do about it)
Portfolio Managers Greg Wilensky and Jeremiah Buckley highlight two reasons why portfolio volatility creates risk for investors and discuss how they believe the risk can be mitigated.


6 minute read
Key takeaways:
- There are two main reasons why higher portfolio volatility equates to higher risk for investors.
- First, volatility may lead to emotion-driven capitulation, or selling when the market is down. Second, volatility has a big impact on portfolio longevity when withdrawals are being taken.
- We believe the 60/40, or balanced, portfolio has shown its worth in mitigating both risks and has helped investors stay invested over the long term.
A portfolio’s riskiness may be expressed in terms of its volatility, or standard deviation. Simply put, standard deviation quantifies how much a portfolio’s periodic return differs from its mean return over time. The higher the volatility, the higher the risk.
But why is a volatile portfolio a riskier portfolio?
While there are statistical answers to the question (which we won’t go into here), we highlight two key reasons why volatility matters.
1. Emotion-driven capitulation
Not all investors can stomach the volatility of a 100% stock, or equity, portfolio. While a 100% stock allocation has delivered impressive returns – for example, the S&P 500® Index returned 10.1% annualized from 1993 to 2023 – one cannot overlook the three large drawdowns during that period, plus many smaller ones in between.
In 2000-2002, 2007-2009, and 2020, the S&P 500 suffered peak-to-trough drawdowns of -45%, -51%, and -34%, respectively. In dollar terms, these returns are even more stomach churning: An investor with $1 million invested in the S&P 500 in October 2007 would have seen their account fall to under $500,000 by March 2009.
Granted, markets recovered their losses after each drawdown and went on to new highs. But that doesn’t change the fact that it can be a painful ride to the bottom.
If markets have typically recovered their drawdowns, then where is the risk in volatility? One risk is that the pain of a falling market becomes unbearable for the investor, who then sells their stocks or switches to a more conservative allocation near the market bottom, effectively locking in their losses.
On the other hand, a 100% allocation to bonds may not be appropriate for many investors, either. While bonds are typically much less volatile than equities, their returns have also been lower (the Bloomberg U.S. Aggregate Bond Index (U.S. Agg) returned 4.41% annualized from 1993 to 2023).
So, most investors require a mix of stocks and bonds – stocks for capital appreciation and long-term inflation protection, and bonds for income and limiting drawdowns. The appropriate ratio of stocks to bonds can be anywhere on the spectrum depending on an investor’s goals and risk tolerance, with the most common mix being the moderate 60/40 (60% stocks / 40% bonds), or balanced, portfolio.
Over time, the 60/40 strategy has worked effectively because bonds have exhibited low correlation to equities – that is, they have often (but not always) gone up when stocks went down. That low-correlation relationship has been a powerful driver of reducing volatility for investors. For example, in March 2009, when the S&P 500 was down 51% from its peak, a 60/40 portfolio was down 32% due to the U.S. Agg being up over 7% during that time.
Exhibit 1 compares the range of rolling 5-year annualized calendar year returns for stocks, bonds, and a 60/40 portfolio between 1981 and 2023. The 60/40 portfolio had an average 5-year annualized return of 9.9%, somewhere between that of stocks and bonds. More importantly, it had a higher minimum 5-year annualized return (0.6%) than either stocks or bonds alone – the positive result of combining assets with low correlations.
Notably, in no 5-year calendar period did the 60/40 portfolio register a negative return. Its 0.6% return was well above the lowest annualized 5-year return registered by an all-equity portfolio of -2.3% (-11% cumulatively). Psychologically, it can be tough for investors to contemplate their portfolio being down as much as 11% over a 5-year period. Therefore, the 60/40 portfolio might be a viable alternative to manage possible emotional discomfort.
It is worth noting that the 60/40 has given up some upside potential versus a stock-only portfolio. But for many investors who cannot stomach the volatility of equities, it seems a worthy tradeoff in exchange for better downside-risk mitigation and a tighter dispersion of returns.
Exhibit 1: Stocks and bonds: Better together
Range of rolling 5-year annualized calendar year returns (1981 – 2023)
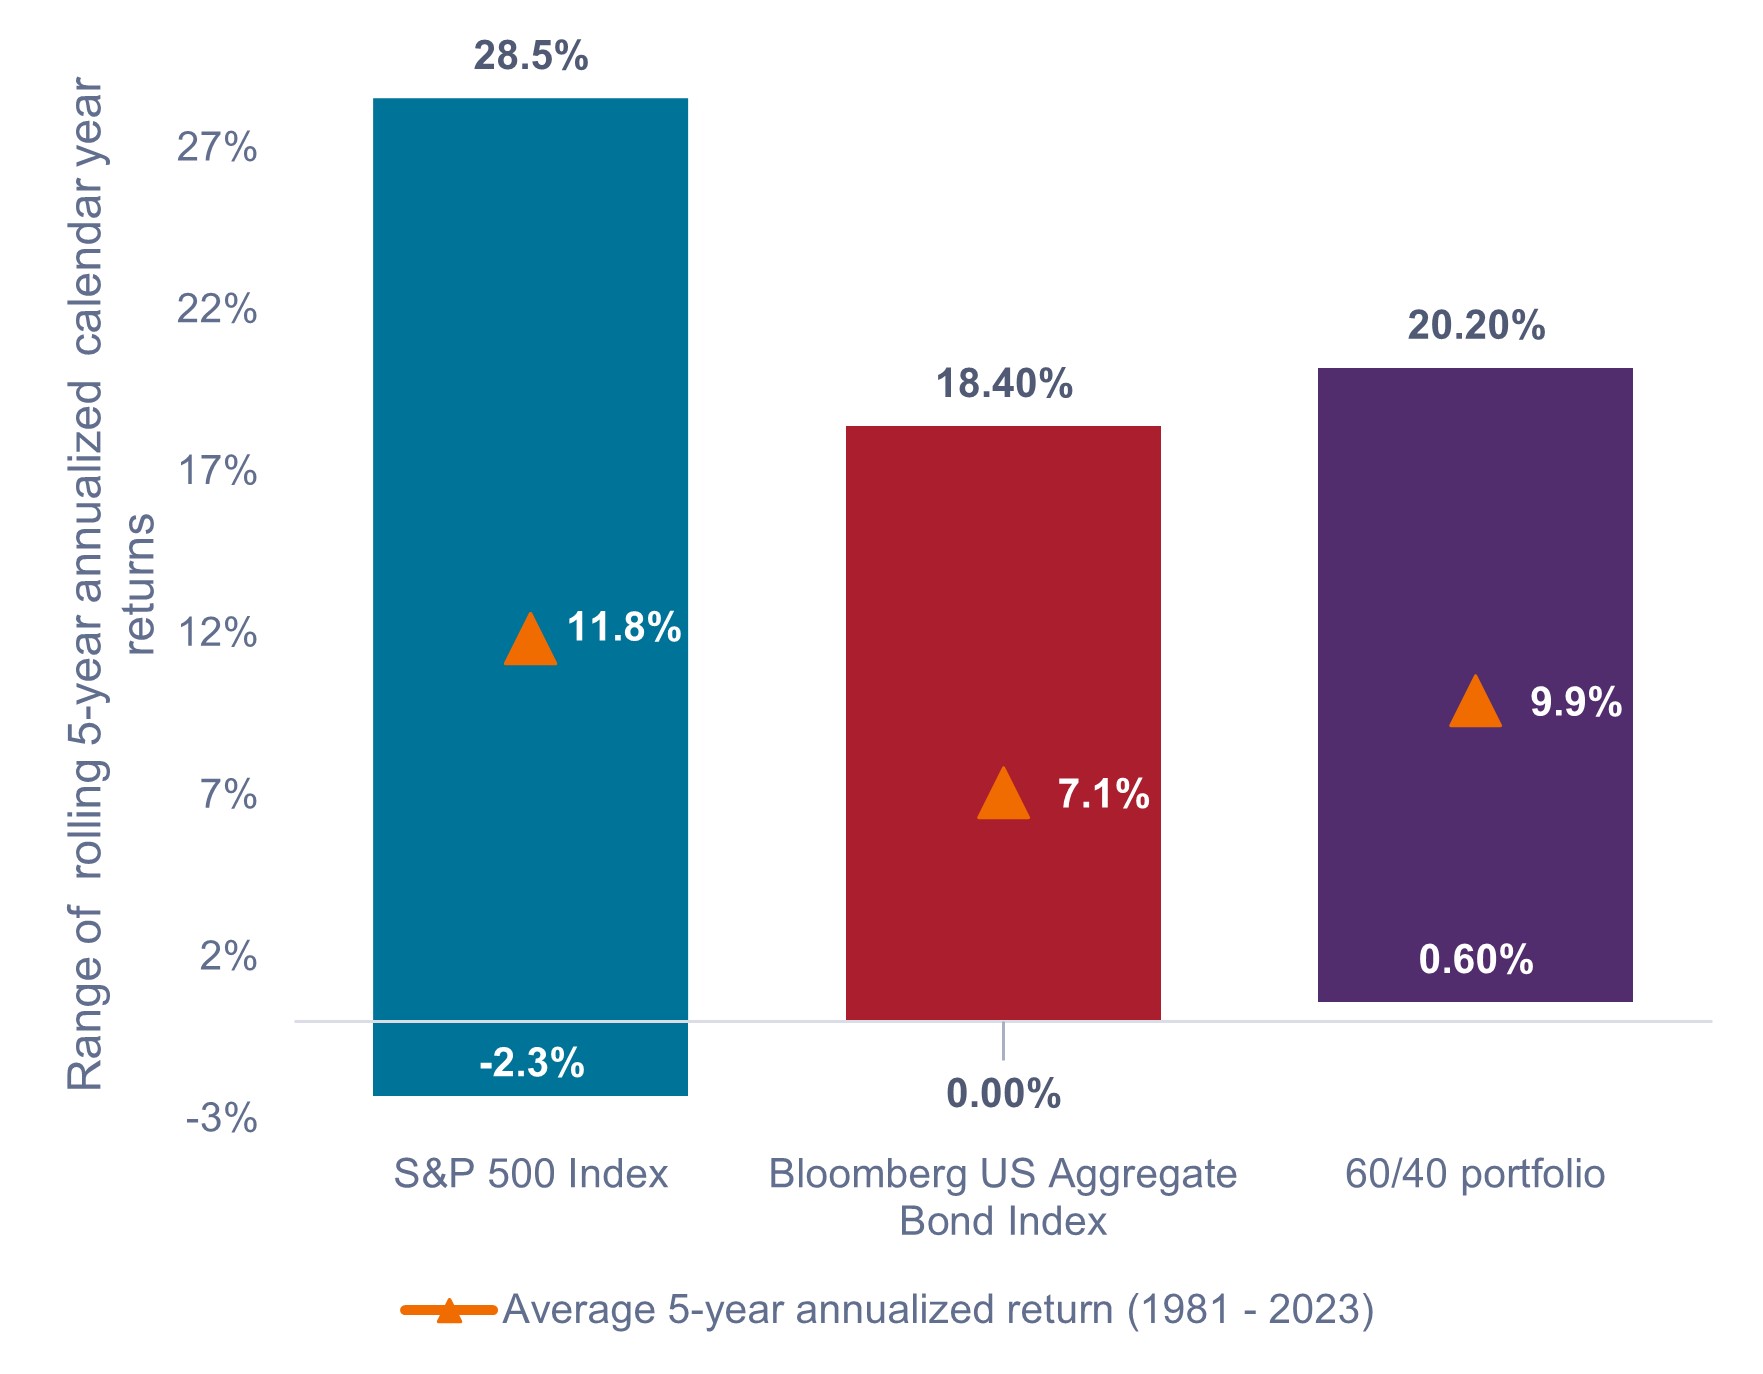 Source: Bloomberg, Janus Henderson Investors, as of 31 December 2023. Note: 60/40 portfolio (60% S&P 500 Index / 40% Bloomberg US Aggregate Bond Index) assumes annual rebalancing.
2. The math of taking withdrawals from volatile portfolios.
Taking systematic withdrawals has an influence on a portfolio’s longevity. All else equal, the more volatile the portfolio, the bigger the impact of withdrawals. Consequently, portfolio volatility is especially important for retirees and other investors, such as endowments and foundations, that take regular withdrawals.
Exhibit 2 shows a hypothetical scenario in which three investors each start with a $1 million portfolio in January 2000. Investor A invests in the S&P 500 and takes a $12,000 quarterly withdrawal. Their quarterly portfolio returns match those of the actual S&P 500 returns – i.e., the returns are volatile.
Investor B is invested in a hypothetical portfolio that earns the same annualized return over the period as investor A (7.0%). They also take a $12,000 quarterly withdrawal. However, in contrast to Investor A, Investor B earns the same return of 7.0% each year, meaning their portfolio has no return volatility. Investor A and B end up in very different places because investor A is forced to withdraw from capital in quarters when the market is down. When the market recovers, investor A’s portfolio must grow off a smaller base.
Investor C invests in a 60/40 portfolio (60% S&P 500 / 40% U.S. Agg), and even though their annualized return for the period (6.5%) is lower than Investor A’s 7.0% per year, the 60/40 portfolio’s lower volatility more than makes up for the lower annual return. While results vary based on the time period of the analysis, the example illustrates that there have been periods when a lower-return, lower-volatility portfolio outperformed a higher-return portfolio over time, when withdrawals are being taken.
Exhibit 2: Effect of volatility on portfolio longevity
All else equal, volatile portfolios will erode sooner when withdrawals are being taken.
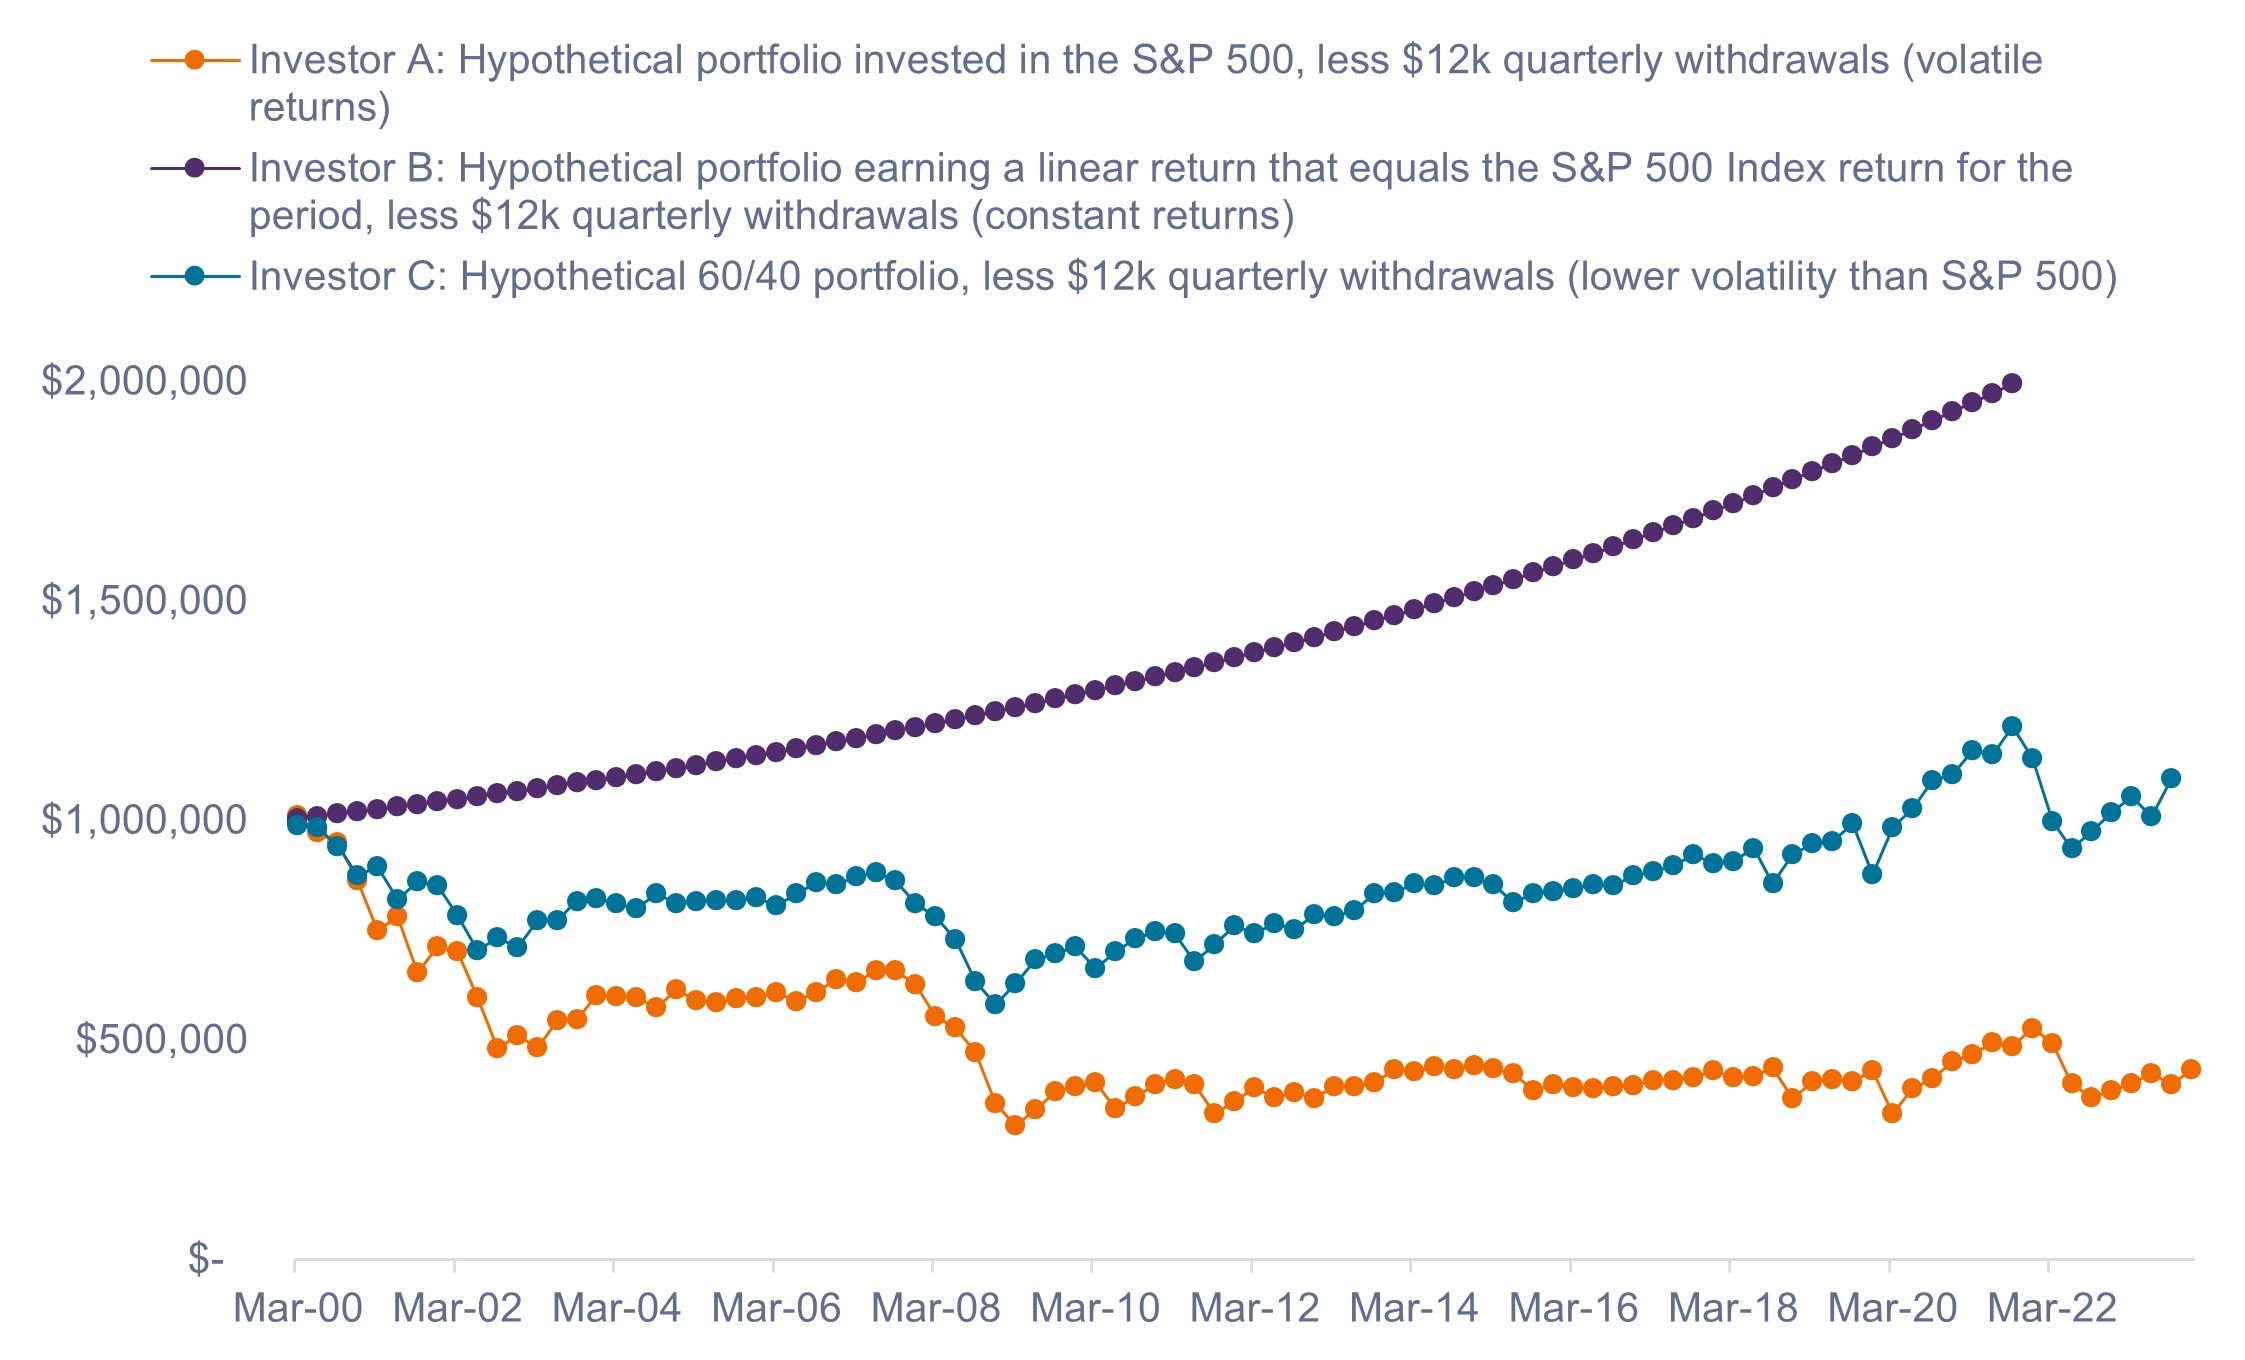 Source: Bloomberg, as of 31 December 2023. For illustrative purposes only. Past performance does not predict future returns. The 60/40 portfolio (60% S&P 500 / 40% U.S. Agg) assumes quarterly rebalancing.
Conclusion
We often talk about the importance of staying invested for the long run. Implied in that principle is the assumption that an investor is in a portfolio they have the stomach to hold through a full market cycle. (And, yes, that includes an equity drawdown of 30% or more.) Similarly, investors who take withdrawals need to pay close attention to managing volatility if they are to maximize portfolio longevity. The 60/40, or balanced, allocation has shown its worth in helping to mitigate both risks.
In short, managing volatility matters. And we believe the balanced portfolio remains one of the most effective methods to manage volatility over the long term.
IMPORTANT INFORMATION
Any risk management process discussed includes an effort to monitor and manage risk which should not be confused with and does not imply low risk or the ability to control certain risk factors.
Standard Deviation measures historical volatility. Higher standard deviation implies greater volatility.
Volatility management may result in underperformance during up markets, and may not mitigate losses as desired during down markets.
Bloomberg U.S. Aggregate Bond Index is a broad-based measure of the investment grade, US dollar-denominated, fixed-rate taxable bond market.
S&P 500® Index reflects U.S. large-cap equity performance and represents broad U.S. equity market performance.
Volatility measures risk using the dispersion of returns for a given investment.
These are the views of the author at the time of publication and may differ from the views of other individuals/teams at Janus Henderson Investors. References made to individual securities do not constitute a recommendation to buy, sell or hold any security, investment strategy or market sector, and should not be assumed to be profitable. Janus Henderson Investors, its affiliated advisor, or its employees, may have a position in the securities mentioned.
Past performance does not predict future returns. The value of an investment and the income from it can fall as well as rise and you may not get back the amount originally invested.
The information in this article does not qualify as an investment recommendation.
Marketing Communication.
6 minute read
Key takeaways:
- There are two main reasons why higher portfolio volatility equates to higher risk for investors.
- First, volatility may lead to emotion-driven capitulation, or selling when the market is down. Second, volatility has a big impact on portfolio longevity when withdrawals are being taken.
- We believe the 60/40, or balanced, portfolio has shown its worth in mitigating both risks and has helped investors stay invested over the long term.


