Subscribe
Sign up for timely perspectives delivered to your inbox.

The previous quarterly commentary suggested that the policy response to the covid-19 crisis would lead to a strong rise in global money growth, in turn suggesting strong economic growth in late 2020 / 2021. The monetary pick-up over the past three months has exceeded expectations, raising the prospect of a full-scale boom in 2021 with an accompanying inflation pick-up. “Excess” money may continue to buoy equities and other risk assets near term but could evaporate later in 2020 as a V-shaped economic rebound plays out.
The key monetary indicator used for economic forecasting here is the six-month change in real (i.e. inflation-adjusted) narrow money in the G7 economies and seven large emerging economies (the “E7”). This was at a modest level entering 2020 but surged over February-May, reaching the highest level on record in data extending back to the 1990s – see first chart. Allowing for an average nine-month lead, the suggestion is that global economic momentum will rise into early 2021, at least.
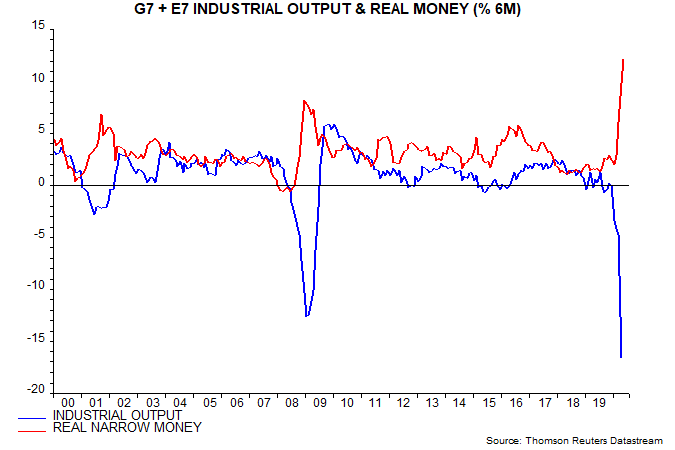
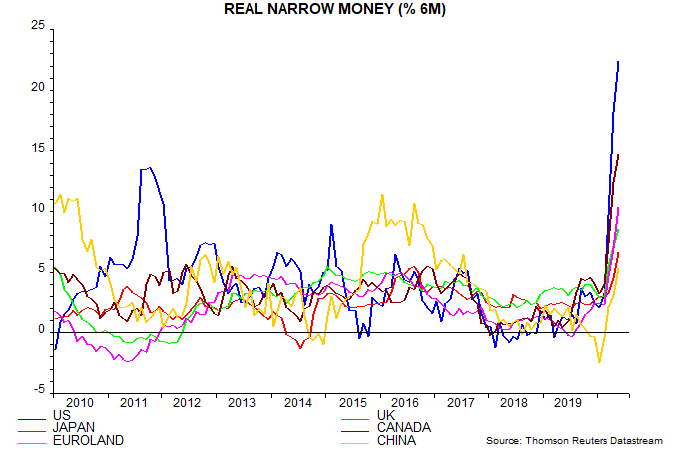
The global surge owes much to a 20.7% (not annualised) explosion in US narrow money since end-2019 but strong accelerations have occurred in almost all economies. China is lagging somewhat, reflecting more measured (and sensible) policy easing – second chart.
G7 plus E7 six-month real narrow money growth is probably at or close to a peak, which could signal a peak in economic momentum around end-Q1 2021. Base effects guarantee a slowdown in US nominal money by end-Q3, while G7 plus E7 six-month consumer price inflation is about to rebound in response to a recovery in the oil price. The expectation here, however, is that a further rise in Chinese money growth will take up some of the slack, maintaining global growth at a high level, with positive economic implications for later in 2021.
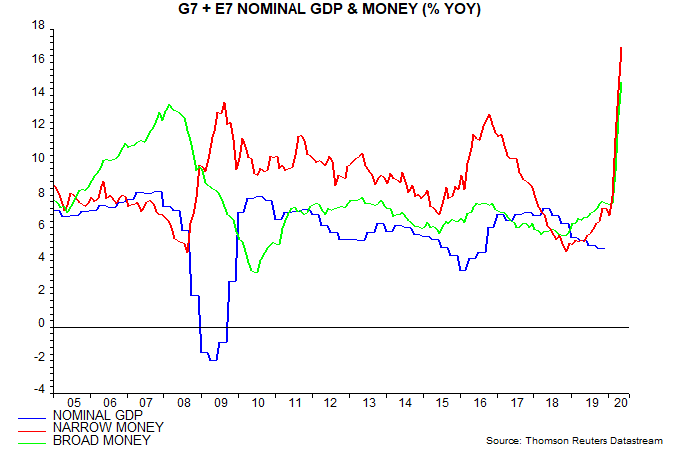
Narrow money is more useful for anticipating economic momentum turning points but broad money is a better guide to medium-term inflation prospects. Annual growth of G7 plus E7 nominal broad money, like that of narrow money, is the highest since the 1990s (at least) – third chart. The dual surge contrasts with late GFC developments, when a narrow money pick-up signalled an economic recovery but broad money weakness argued against an accompanying rise in inflation.
G7-only money data are available much further back. Annual broad money growth is the fastest since 1973 and not much below a post-WW2 peak in 1972 – fourth chart. US growth is above the corresponding peak and at its highest peacetime level since 1881.
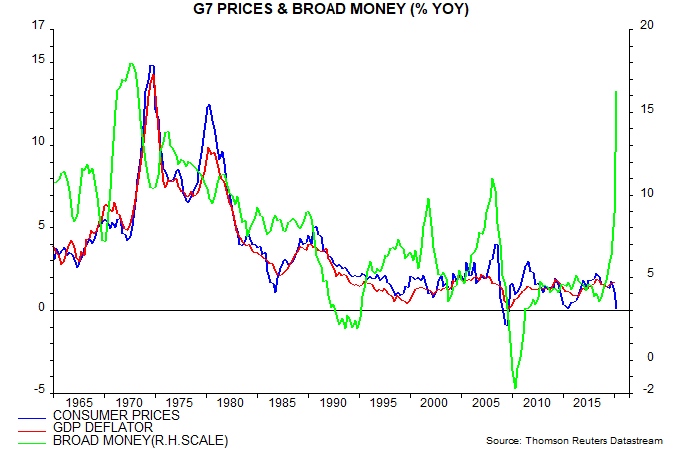
The early 1970s experience is instructive. G7 broad money growth rose from a trough of 7.2% in Q1 1970 to 18.0% in Q4 1972. Consumer price inflation of 5.1% in Q4 1972 was lower than at the start of the money growth surge in 1970. The money growth / inflation gap had reached a record 12.9 percentage points and commentators were no doubt opining about a collapse in velocity. Inflation then embarked on a sustained surge to a mid-teens peak in Q4 1974, two years after the money growth peak.
The recent inflation fall, incidentally, is consistent with prior monetary trends – G7 annual broad money growth weakened during 2018, bottoming at 3.4% in November.
The inflation upswing of the early 1970s was magnified by a quadrupling of the oil price following the Arab oil embargo of October 1973. Absent a similar shock, a reasonable expectation is that G7 inflation will reach 6-7% in 2021-22. This assumes that current broad money growth – 16.9% in May – is partly absorbed by strong real GDP growth of 3-4%, while velocity falls by 7% pa – two standard deviations more than the average rate of decline over the past 50+ years.
Some commentary argues that the monetary surge reflects a precautionary drawing-down of credit lines by companies and will reverse as the economy normalises and loans are paid back, cutting short any increase in inflation. This argument is not supported by an analysis of the drivers of faster broad money growth. Monetary financing of fiscal deficits has contributed significantly more than increased bank lending – see table.
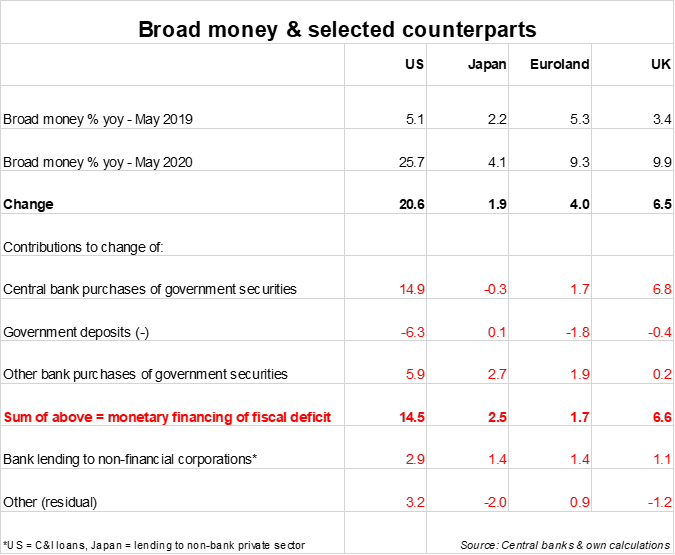
Much of the lending boost, moreover, reflects government schemes involving either future conversion to grants (the US Paycheck Protection Program) or guarantees on risky loans, a sizeable proportion of which is likely to be written off (e.g. the UK Bounce Back Loan Scheme). The grant / write-off element represents additional money-financed government spending, implying that the monetary financing numbers in the table are too low, and the lending numbers too high. Any negative impact on broad money from loan repayments, therefore, will be minor relative to the recent surge.
The consensus view that inflation will remain low or even weaken further assumes that the health crisis will result in a lasting negative impact on demand that outweighs damage to supply, implying a persistent negative output gap and labour market slack. The monetarist view, obviously, is that the demand impact, beyond the short term, will be positive not negative.
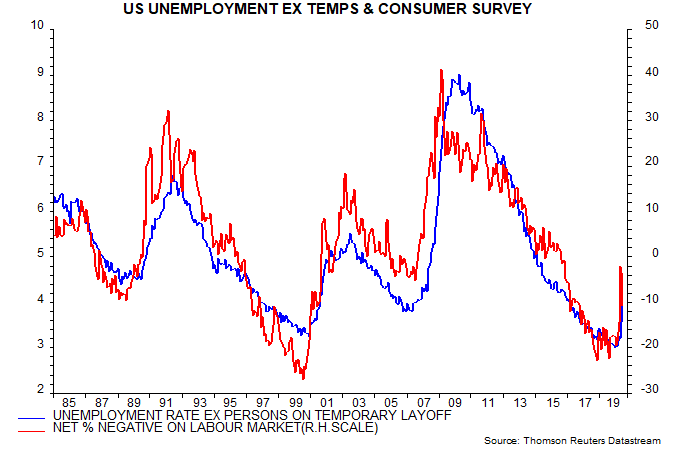
Recorded and hidden (by government schemes) unemployment has risen sharply but weakness, similarly, is likely to prove temporary. The US “permanent” unemployment rate – excluding those classified as being on temporary layoff – stood at 4.5% in June, below a long-term average (since 1985) of 5.1%. The suggestion of limited damage is supported by a still relatively favourable assessment of labour market conditions in the Conference Board consumer survey – fifth chart.
The global cycle analysis conducted here is consistent with the monetary signal of strong economic prospects and rising inflation risks. Recent business surveys confirm that the stockbuilding (inventory) and business investment cycles bottomed during H1, while an upswing in the longer-term housing cycle is regaining momentum in response to record low mortgage rates. Overlaying these activity cycles is the “long wave” price / inflation cycle, which averages 54 years and suggests a secular rise in inflation to a peak in the late 2020s.
The monetarist view that money is in excess supply helps to explain the strength of the bounce-back in equities and other risk assets in Q2. Historically, equities have outperformed cash significantly on average when global / G7 real narrow money growth has been above industrial output growth and / or above a long-run moving average. The real money / output growth gap was already positive while real money growth crossed above its long-run average in March.
Previous commentaries discussed a switching rule that holds equities only when both conditions are satisfied, defaulting to US dollar cash otherwise. The rule allows for data reporting lags and switches are made only at month-ends, so the latest move into equities was delayed until end-April. The sixth chart compares the hypothetical historical performance of the rule with that of being permanently invested in equities.
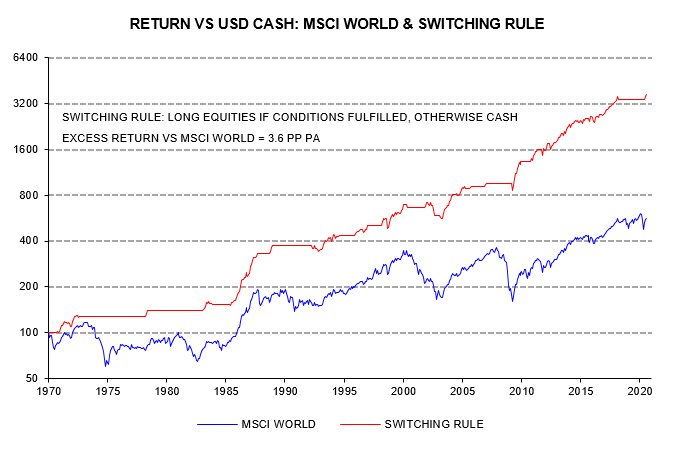
The rule is almost guaranteed to remain in equities during Q3 but a moderation of global six-month real narrow money growth coupled with a V-shaped economic rebound could result in the real money / industrial output growth gap turning negative around end-Q3, implying a Q4 switch into cash.
Any set-back in equities, however, is unlikely to mark the start of a bear market – these usually occur during stockbuilding cycle downswings but the cycle is now scheduled to be in an upswing until late 2021, at least. As discussed in previous commentaries, cyclical equity market sectors and emerging market equities usually outperform during such upswings, a trend that could be reinforced on this occasion by simultaneous accelerations in business / housing investment and associated strength in commodity prices.