Subscribe
Sign up for timely perspectives delivered to your inbox.


Equity markets have bounced back from their lows, credit spreads have retreated from their wides in March and economies are, for the most part, gradually reopening. Markets are suggesting better times ahead. Credit portfolio managers James Briggs and Tim Winstone consider whether investors should be increasing their allocation to investment grade credit.
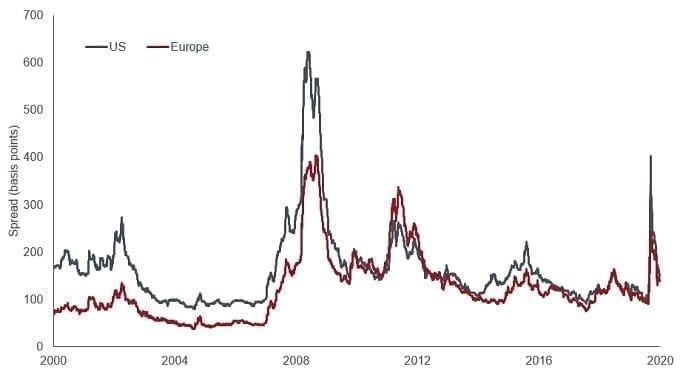
Credit markets have become distinctly average in recent weeks. Investment grade (IG) credit spreads in Europe (139 basis points at 14 July 2020) and the US (150 bps) are back around their 10-year averages, although they remain above their 5-year averages and well above their lows of the last 10 and 20 years, offering some potential for tightening.
| Spread (basis points) | US | Europe |
|---|---|---|
| 14 July 2020 | 150 | 139 |
| 5-year average | 138 | 120 |
| 10-year average | 153 | 143 |
| 20-year average | 163 | 123 |
| Low in last 10 years | 90 | 74 |
| Low in last 20 years | 79 | 36 |
Source: Bloomberg, ICE BofA US Corporate Index, ICE BofA Euro Corporate Index, 14 July 2000 to 14 July 2020.
We have experienced one of the biggest economic dislocations of our lifetimes so we should expect credit spreads to be above their lows. The low point for spreads was reached in the mid noughties, which was notable for a decline in volatility in markets. Today, calmer market sentiment ensuing from progress in dealing with COVID-19, further evidence of economic recovery, and possibly lower levels of corporate bond issuance in the second half of 2020, offer the potential for spreads to continue to grind tighter.
Yields on corporate bonds are essentially a summation of the yield on the government bond of equivalent maturity plus the spread which incorporates a premium for the credit risk attached to the bond (expected and unexpected default loss), an illiquidity premium and residual factors (such as the taxation environment for credit or options for borrowers to redeem a bond early).
In an environment of historically low and even negative government bond yields, the spread now makes up a significant portion of the corporate bond yield. In fact, as government bond yields have headed south, the ratio of US IG corporate yields to US government bond yields has reached elevated levels (see Figure 2). This is particularly pronounced at the shorter end of the yield curve where, for example, 3 to 5-year US IG corporates were yielding almost five and a half times the yield of the equivalent maturity US government bond at 30 June 2020. Negative government bond yields for much of the eurozone government bond market mean it is nonsensical to show a similar chart for Europe, such are the peculiarities of dealing with a negative yield.
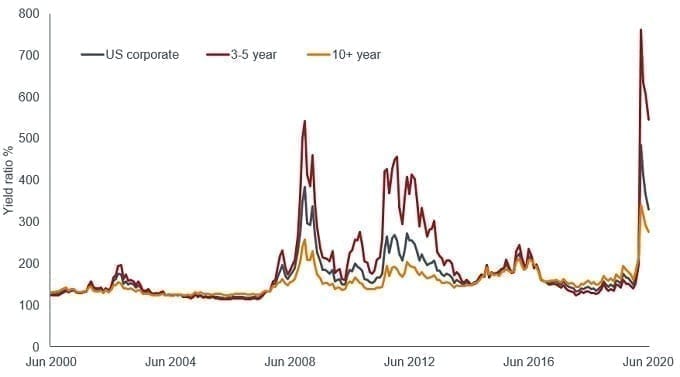
Source: Bloomberg, Bloomberg Barclays US Corporate Index, monthly data, 30 June 2000 to 30 June 2020
As explained above, the spread is what investors insist on being paid partly to compensate for defaults, yet defaults among IG corporates are relatively rare. Figure 3 represents data collected over a period of almost 30 years and shows the cumulative default rate of bonds from a starting credit rating. For example, on average, only 0.49% of bonds rated A would have defaulted after five years. We can see that the BBB rated bonds skew the IG cumulative default rate to 0.90% over this period. In comparison, the speculative grade (or sub-investment grade) part of the market has a cumulative default rate of 14.55% over five years, so we can observe that corporate defaults are primarily a speculative grade phenomenon.
| % | Time horizon (years) | ||||||
|---|---|---|---|---|---|---|---|
| Rating | 1 | 2 | 3 | 4 | 5 | 10 | 15 |
| AAA | 0.00 | 0.03 | 0.13 | 0.24 | 0.35 | 0.70 | 0.92 |
| AA | 0.02 | 0.06 | 0.12 | 0.22 | 0.32 | 0.73 | 1.04 |
| A | 0.06 | 0.14 | 0.23 | 0.35 | 0.49 | 1.28 | 1.98 |
| BBB | 0.17 | 0.46 | 0.80 | 1.22 | 1.64 | 3.44 | 4.87 |
| Investment grade | 0.09 | 0.25 | 0.43 | 0.66 | 0.90 | 1.96 | 2.80 |
| Speculative grade | 3.66 | 7.13 | 10.12 | 12.56 | 14.55 | 20.62 | 23.65 |
Source: 2018 S&P Annual Global Corporate Default and Rating Transition Study, April 2019.
That is not to say that we should be complacent about defaults for IG corporate bonds. After all, these figures are averages and we may be entering a more challenging default period than average. For example, the same study shows that the 5-year cumulative IG default rate reached a high of 2.39% for bonds initially rated IG at the start of 1998. The following five years would go on to include the fallout from the bursting of the dotcom bubble, the 9/11 terror attacks and the lead up to the Iraq War. The extent of the current economic dislocation and uncertainty means we should probably expect some pick-up in negative credit events.
Countering the economic uncertainty and likely to keep IG corporate defaults in check is the massive monetary and fiscal accommodation enacted by authorities. This was estimated globally to be at US$14 trillion in late May by Deutsche Bank1 and will continue to grow as new measures are announced. Developed market central banks are keen to keep official interest rates low and are undertaking quantitative easing, including asset purchase schemes, that are helping to anchor financings costs and government bond yields at low levels. Central banks globally have demonstrated a willingness to intervene to provide liquidity to markets and governments are prepared to borrow and spend heavily in an effort to make up for a hopefully temporary drop in consumer and corporate spending.
The scale of the stimulus is impressive and policymakers are keen to overdeliver to ensure the current growth shock averts a more protracted recession. In fact, it may be necessary to overdeliver with unconventional monetary measures to make up for the fact that the economy has not benefited as much from a traditional rate-cutting cycle this time around; the impact of which may be overlooked by market participants in their analysis of excess liquidity and multipliers.
A more immediate threat for bonds may be downgrades to below investment grade as credit quality has deteriorated. This is not just a recent phenomenon; it has been taking place for much of the last decade. There has been a migration to BBB, the lowest investment grade tier, from higher ratings, reflecting the fact that companies have been taking on more debt and BBB rated bonds now represent around 50% of both the US and European IG corporate markets.
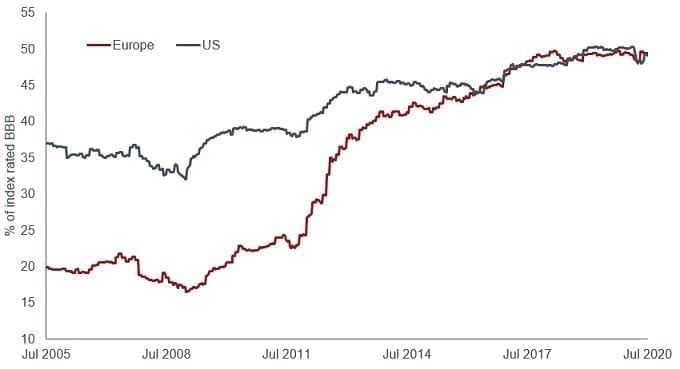
Source: Bloomberg, ICE BofA US Corporate Index and ICE BofA Euro Corporate Index, full market value of BBB as a percentage of overall index, 8 July 2005 to 10 July 2020
1Source: Deutsche Bank, COVID-19, Policy responses by G20 economies, 21 May 2020.
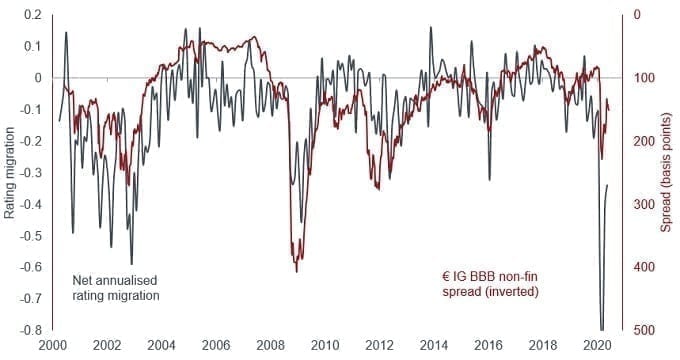
But could we already be past the worst of the downgrades? Recent research by Citi showed that credit spreads in Europe were much tighter than ratings migration would imply as shown in Figure 5. For example, the latest rating migration index figure for June 2020 was -0.4, implying that if this level were maintained for 12 months then the average company in Europe would expect to see its credit rating fall by 0.4 notches. This would typically demand a credit spread for BBB rated bonds around 100 basis points wider. Will ratings migration continue to improve to reflect current spread levels or are spreads reflecting too optimistic an outlook?
The fact is we are in an uncertain period where we need to differentiate between backward-looking data and where we expect credit quality to migrate to over the coming year. Markets respond to change as we have seen with the volatility around news about potential vaccines for COVID-19 and the data coming out on consumer confidence and purchasing manager index (PMI) surveys.
We need to be careful with diffusion surveys where improvements from a low base can suggest rapid recovery when actual levels of demand, output or income may still be at relatively weak levels. Their strength is in determining trends and inflection points so recent improvements in global PMIs are to be welcomed from a credit perspective. The economy is not out of the woods yet though, with economists expecting it to take around two years for the world to be back to the output levels seen at the start of 2020. Meanwhile, many companies will have shouldered an additional debt burden to help them through the revenue valley of the lockdowns and social distancing. It will be therefore be important to determine which companies can support the increase in the debt level and those for which the burden becomes unbearable, underscoring the need for careful fundamental research and a selective approach.
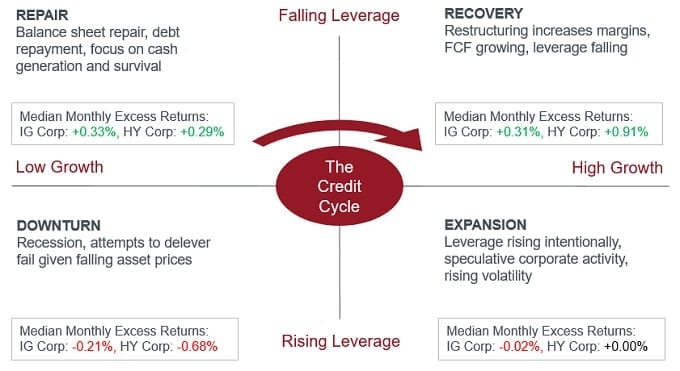
Ultimately, a desire to increase the allocation to IG corporates may come down to an investor’s perception of where we are in the credit cycle. Companies generally are starting from a weak balance sheet position but trend matters a lot; if, as seems likely, we are entering a period over the next twelve months where the corporate sector starts to repair its balance sheets, the “Repair” phase within Figure 6 below, then this has historically been a good time for credit returns. Of course, this assumes economies can return to normal – a second wave that sees a repeat of the nationwide lockdowns experienced earlier this year could see the shutters coming down for good on some companies.