Key takeaways:
- Valuations are towards the richer end of long-term ranges across many asset classes but Europe’s levered credit markets tell a different story
- Significant dispersion underlies the headline figures in the loan market, as reflected in the pricing of the distressed segment, which has been weakening for several months.
- Deep research and a disciplined portfolio construction process can help active managers identify risks early and avoid potential downside.
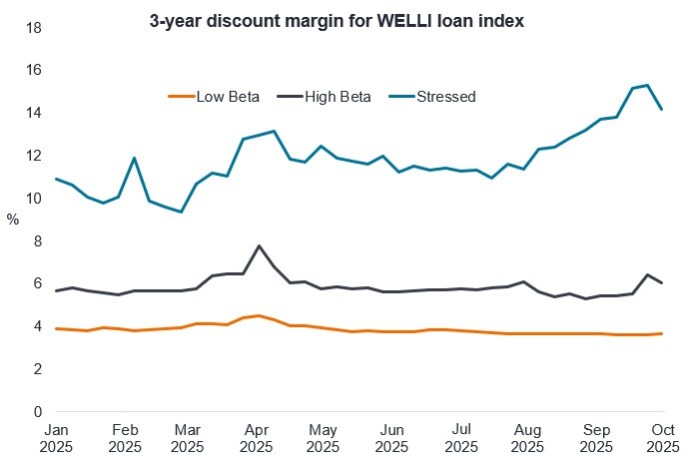
Source: Bloomberg, 3-year discount margin for S&P UBS Western European Leveraged Loan Index (WELLI), weekly datapoints, 10 January 2025 to 09 October 2025. The discount margin is the yield spread that when added to the floating reference rate (EURIBOR for EUR-denominated loans, SOFR for USD SOFR-based loans, SONIA for GBP-denominated loans), discounts all anticipated future cash flows (coupon payments and principal repayment) to the loan’s current market price. A higher discount margin means the loan (or segment of an index) is trading at a lower price and vice versa. Low beta reflects high quality credits (typically trading around par), high beta reflects not quite so strong credits (typically trading 0.25 points above to 6 points below the average price of the index), stressed reflects the weakest credits (typically trading more than 6 points below the average price of the index).
While valuations in most fixed income assets are toward the richer end of long-term ranges, Europe’s levered credit markets tell a different story with the WELLI (Western Europe Leveraged Loan Index) trading closer to its long-term average.
Significant dispersion underlies the headline figures and we divide this market into three segments – low beta, high beta, and stressed – demonstrate. Trading in the low and high beta segments has been orderly. Persistent demand and repricing activity have narrowed the margin of the low beta segment this year. The high beta segment trades with more volatility but has remained rangebound outside of a brief Liberation Day spike. The stressed segment has materially underperformed its counterparts. This segment has grown as a proportion of the overall index as vulnerable credits fall into it. Weak trading, often accompanied by challenged liquidity with few natural buyers, has exacerbated price declines which show up in higher discount margins. The larger and wider stressed segment is pushing out index-level spreads.
While the overall economy is in decent shape and many financial benchmarks are near their highs, it can be easy to overlook pockets of fragility. Deep research and a disciplined portfolio construction process can help active managers identify risks early and avoid potential downside.
– John Lloyd, Fixed Income Portfolio Manager.
For more views, visit our latest:
Multi-Sector Credit Asset Allocation Perspectives
Fixed income securities are subject to interest rate, inflation, credit and default risk. The bond market is volatile. As interest rates rise, bond prices usually fall, and vice versa. The return of principal is not guaranteed, and prices may decline if an issuer fails to make timely payments or its credit strength weakens.
S&P UBS Western European Leveraged Loan Index (WELLI) measures the performance of the investible universe of EUR, GBO and USD leveraged loans issued by companies domiciled within eligible countries.
Leverage: The level of borrowing at a company, often expressed as net debt as a multiple of earnings. Higher leverage equates to higher debt levels.
Loans: Also called ‘leveraged loans’. Loans to companies that tend to be rated below investment grade.
Spread: The spread that loans pay over a benchmark interest rate.