
Key takeaways:
- Tight credit spreads reflect strong corporate fundamentals, with low default rates making high yield bonds still attractive despite reduced compensation for credit risk.
- Despite tighter spreads, average bond prices remain below par, offering upside potential before call risk increases – especially relevant in a rate-cutting environment where yields may decline further.
- Investors can potentially enhance returns through strategic tools like security selection, thematic sector exposure, rising star identification, and exploiting relative value across capital structures and issuance types.
Income is the primary source of return on high yield corporate bonds. They are not called high yield bonds for nothing. But what happens when the credit spread – the difference between the yield on a corporate bond and that of a corresponding government bond of similar maturity – becomes historically low? Is an investment in high yield bonds justified and what tools might investors use to try and enhance returns?
First, spreads might be tight (the financial industry tends to refer to low spreads as tight and high spreads as wide), but that is reflective of favourable corporate conditions. Average leverage levels (debt as a proportion of earnings) and interest cover (the number of times companies can cover interest payments with earnings) remain at comfortable levels.1 Defaults also remain relatively contained (1.1% for US high yield and 2.9% for European High Yield for the last 12 months)2, so investors are prepared to accept less compensation (spread) for taking on credit risk.
Second, unlike spreads, yields are not particularly low. In fact, they have been lower 40% of the time over the last 20 years so there could potentially be room for them to move lower (see Figure 1). Recall that bond prices rise when yields fall and vice versa. Many investors, therefore, continue to view the yield on high yield bonds as attractive, particularly with the US Federal Reserve (Fed) leaning towards further rate cuts.
Figure 1: Spreads are low, yields less so (as at 31 October 2025)
| Global | US | Europe | |
|---|---|---|---|
| Spread (basis points) | 302 | -0.3 | -0.6 |
| Spread percent rank over 20 years (lower is tighter) | 6% | 6% | 8% |
| Yield (%) | 6.56% | 6.82% | 5.02% |
| Yield percent rank over 20 years (lower is lower) | 40% | 43% | 42% |
Source: Bloomberg, ICE BofA Global High Yield, ICE BofA US High Yield, ICE BofA Euro High Yield Index, yield to worst, option-adjusted spread, as at 31 October 2025. Percent rank over 20 years from 1 November 2005 to 31 October 2025. Yield to worst is the lowest yield a bond with a special feature (such as a call option) can achieve provided the issuer does not default. When used to describe a portfolio, this statistic represents the weighted average across all the underlying bonds held. One basis point equals 1/100 of a percentage point. 1 bp = 0.01%, 100 bps = 1%. Past performance does not predict future returns. Yields may vary over time and are not guaranteed.
For investors in high yield bonds the credit spread needs to more than compensate for defaults, otherwise there would be little point in taking on the risk of holding high yield corporate bonds. Back in April we wrote a piece Time for a bigger slice of high yield bonds, where we went into the mechanics of how high yield bonds over the last 20 years had typically delivered excess spread (i.e. more than was required to compensate for defaults), except for two short periods during the Global Financial Crisis and the start of the Covid pandemic.
Third, tight spreads can be justified because of a quirk of recent history. The sharp rise in rates in 2022 meant that bond prices dropped dramatically as bonds with lower coupons adjusted to reflect the higher yield environment. Figure 2 shows the average price of bonds (the orange line) and the spread (the black line) inverted. When bond prices rise, spreads typically fall and vice versa so by inverting spreads we can get the lines to track each other. We are showing just BB and B rated high yield bonds as this removes the distortions you get from distressed bonds rated CCC.
Figure 2: Average price is still below par, despite tighter spreads
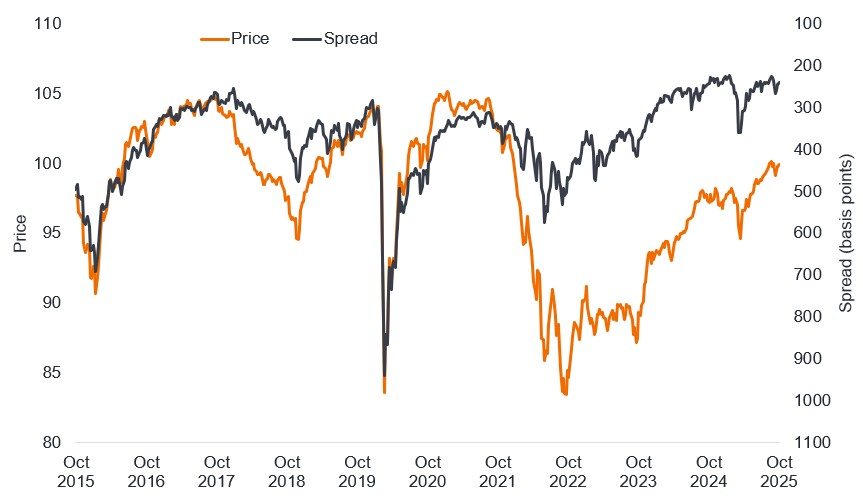
Source: Bloomberg, ICE BofA BB-B Global High Yield Bond Index, price and spread (Govt OAS), weekly datapoints, 30 October 2015 to 31 October 2025. Past performance does not predict future returns.
Normally, when spreads are this tight, you would expect prices to be around 105. Yet bonds are on average still trading below par. Why is that important? Because high yield bonds are typically callable, i.e. can be redeemed early. Callable bonds have specific call prices, which is the price the issuer must pay to redeem the bond early. This is typically set above par, so the more a bond moves above par and closer to its call price, the more likely it will get called as this typically signals that rates are lower and the issuer could benefit from calling the bond and reissuing new bonds at a lower interest rate. With average prices still below par, bondholders have more potential to benefit from upside from tightening spreads and falling yields as bond prices can still rise a few points before issuers are keen to call them.
Potential tools to enhance returns
We will be the first to say it gets harder to generate excess returns from high yield bonds as spreads get tighter but it is not impossible – 280 basis points of spread over government yields is still something of a cushion. But there are several tools that we can use as investors to try and generate outperformance during tight spreads.
Security selection
The most obvious is security selection. If we allocate wisely, we can seek to avoid defaults, potentially performing better than the benchmark and getting to keep more of the spread over government bonds. Think of it a bit like writing insurance: the fewer claims received, the more of the premium the insurer gets to keep.
Thematics/sector allocation
Credit operates in the same world as our equity counterparts so many of the themes that affect equities affect corporate bonds. The equity market may obsess about artificial intelligence (AI) but there are plenty of companies operating in or servicing the technology industry that are using the debt capital markets. Similar to equity investors, we can use these companies to gain exposure to the cash being generated in the technology sector.
Furthermore, all this extra computing power fuels a need for electricity and bonds issued by companies involved in meeting the required energy supply and associated infrastructure.
Figure 3: Demand for power for data centres is expected to rise significantly in the US
US data centre energy consumption (TWh) and share of US power demand (%)
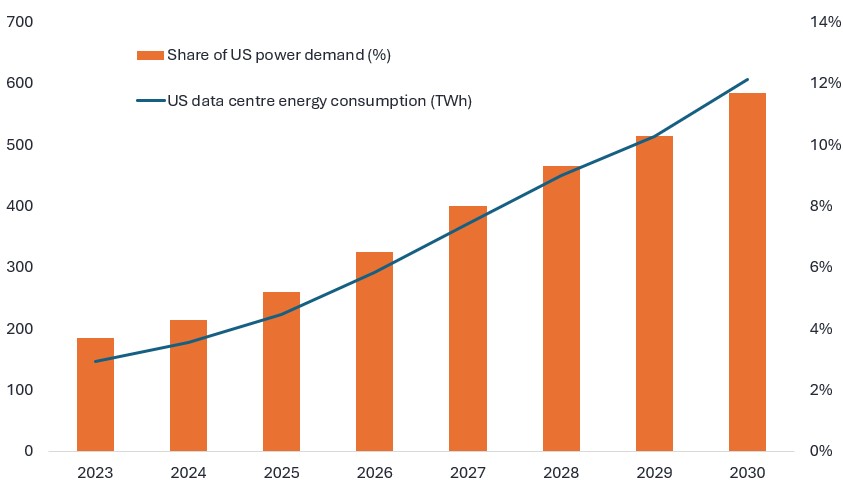
Source: McKinsey & Company, Global Energy Perspective 2023, October 2023. Share of US data centre energy consumption (TWh = Terawatt-hour) and data centre share of US power demand (%). Figures beyond 2024 are estimates. There is no guarantee that past trends will continue, or forecasts will be realised.
Rising stars/Event-driven investing
We are always on the lookout for companies that can be rising stars (i.e. companies that move from high yield to investment grade status). Usually, this is through identifying companies that have a pathway to improved cash flows or a strengthened balance sheet. Merger and acquisition (M&A) activity can often be a means of accelerating the rising star process.
For example, during 2025 we have been attracted to rate-sensitive sectors in the US in the expectation of rate cuts by the Fed. This led us to invest in high yield bonds from Foundation Building Materials (FMB), which has subsequently been bought by Lowe’s, the home improvement group. Lowe’s purchase of FBM means that FBM bonds come under the umbrella of an investment-grade rated company and Lowe’s stated an intention to maintain its BBB+ rating, pause share repurchases and seek to de-leverage.3 FBM bonds rallied as a consequence and were subsequently called.
Relative value
The capital structure of a company can also provide opportunities to enhance returns, for example a bond may be cheaper in a different currency, or spreads may be higher on the bonds of a subsidiary of a parent company. Take the example below. This shows the spread movement on two bonds that are part of the same ownership structure and mature in the same year. Essentially, by holding bond A instead of bond B, we can potentially gain from any narrowing of the spread between these two bonds. Of course, the reverse is also true.
Figure 4: Illustrative spreads (basis points) on bonds from same ownership structure
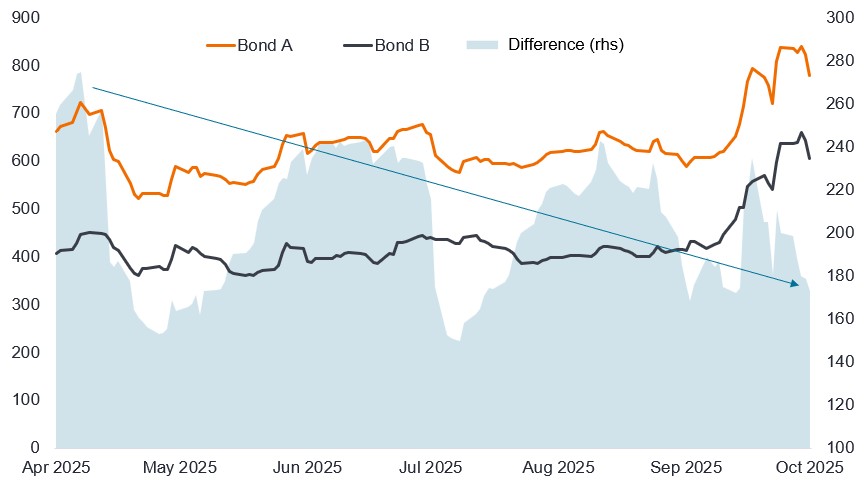
Source: Bloomberg, bond names have been disguised but spreads represent actual figures, 24 April 2025 to 24 October 2025. Past performance does not predict future returns.
Quantitative analysis
Quantitative models can be used to identify patterns in data and assist in uncovering relative value. This type of analysis is typically used in tandem with fundamental credit analysis to help filter ideas, support or question views, or provide directional insight.
Modes of issuance
The issuance market can present opportunities to generate returns. Newly issued bonds often come with a ‘new issue premium’ (an extra spread over a company’s existing bonds) to entice investors to participate in the debt financing.
- Syndication: The main way bonds come to the market is through syndication. Here, a company seeking debt finance approaches a bank or banks that then seek out investors to buy the bond, and underwrite the offering. Premiums tend to shrink when corporate conditions are strong and demand for bonds is high, so investors need to become more selective when spreads are tight.
- Wall crossing deals: This is where issuers confidentially pre-market securities with a limited number of potential investors. It is called wall crossing because potential investors are taken over an information wall. This can be an attractive way to get an allocation as the issuer is often less well known and there is typically a higher new issue premium to be extracted.
- Private credit/Private taps. This method allows the issuer to bypass producing a formal disclosure document (an offering memorandum). This is normally because the investors know the issuer well and have already conducted due diligence. Potential benefits for the issuer are fewer disclosures, direct interaction or contractual relationship with investors and a faster funding timeline. For investors, the benefit is typically picking up bonds at a discount.
Convertibles/hybrid bonds
Typically, when spreads are tight, equity markets are performing well. Convertible bonds are bonds that provide holders the right (but not the obligation) to convert into a specified number of shares of common stock in the issuing company. The appeal of these bonds is that they offer equity-like performance with bond-like protection. They are typically issued with lower coupons than an ordinary bond, with the holder benefiting from the potential for equity participation if the share price approaches the conversion price (the share price at which a convertible bond can convert). Convertibles potentially allow bond holders to have some participation in equity upside.
Summary
Taken together, a constructive outlook on the global economy leads us to believe that spreads can stay within a relatively tight range over coming months. There are also plenty of tools that high yield bond investors can utilise in their efforts to enhance returns for investors.
1Source: Morgan Stanley, Median gross leverage (3.7x earnings (earnings before interest, tax, depreciation and amortisation) for US and Euro high yield, Interest rate Coverage 4.7x earnings for US and 4.3x earnings for Euro high yield), 3 November 2025.
2Source: BofA Global Research, trailing par weighted 12-month default rates, at 31 October 2025.
3Source: Lowe’s, ‘Lowe’s Acquisition of Foundation Building Materials (FBM)’ presentation, 20 August 2025. There is no guarantee that past trends will continue, or forecasts will be realised.
Fixed income securities are subject to interest rate, inflation, credit and default risk. The bond market is volatile. As interest rates rise, bond prices usually fall, and vice versa. The return of principal is not guaranteed, and prices may decline if an issuer fails to make timely payments or its credit strength weakens.
High-yield or “junk” bonds involve a greater risk of default and price volatility and can experience sudden and sharp price swings.
References made to individual securities do not constitute a recommendation to buy, sell or hold any security, investment strategy or market sector, and should not be assumed to be profitable.
ICE BofA Euro High Yield Index tracks the performance of EUR denominated below investment grade corporate debt publicly issued in the euro domestic or Eurobond markets.
ICE BofA Global High Yield Index tracks the performance of USD, CAD, GBP and EUR denominated below investment grade corporate debt publicly issued in the major domestic or Eurobond markets.
ICE BofA BB-B Global High Yield Index is a subset of ICE BofA Gllobal High Yield Index, including all securities rated BB+ through B- inclusive.
ICE BofA US High Yield Index tracks the performance of US dollar denominated below investment grade corporate debt publicly issued in the US domestic market.
Basis point (bp) equals 1/100 of a percentage point, 1bp = 0.01%.
Callable bond: A bond that can be redeemed or paid off by the issuer prior to the agreed maturity date.
Cash flow: The net balance of cash that moves in and out of a company. Positive cash flow shows more money is moving in than out, while negative cash flow means more money is moving out than into the company.
Cloud computing: The provision of IT services remotely by specialised service providers over the internet.
Corporate bond: A bond issued by a company. Bonds offer a return to investors in the form of periodic payments and the eventual return of the original money invested at issue on the maturity date.
Credit metrics: A set of financial ratios such as debt levels versus assets or interest payments as a proportion of earnings that help lenders determine a borrower’s ability to repay debt.
Credit rating: An independent assessment of the creditworthiness of a borrower by a recognised agency such as S&P Global Ratings, Moody’s or Fitch. Standardised scores such as ‘AAA’ (a high credit rating) or ‘B’ (a low credit rating) are used, although other agencies may present their ratings in different formats. BB, B and CCC are high yield ratings in declining order of creditworthiness.
Credit spread: The difference in yield between securities with similar maturity but different credit quality. Widening spreads generally indicate deteriorating creditworthiness of corporate borrowers, and narrowing indicate improving.
Default: The failure of a debtor (such as a bond issuer) to pay interest or to return an original amount loaned when due. Par weighted default rate reflects the proportion of the par value of the index that has defaulted over the last 12 months.
Fundamentals: The underlying financial and operational factors, such as profitability, cash flow and management quality, that indicate a company’s ability to meet its financial obligations.
High yield bond: Also known as a sub-investment grade bond, or ‘junk’ bond. These bonds usually carry a higher risk of the issuer defaulting on their payments, so they are typically issued with a higher interest rate (coupon) to compensate for the additional risk.
Inflation: The rate at which prices of goods and services are rising in the economy.
Investment grade bond: A bond typically issued by governments or companies perceived to have a relatively low risk of defaulting on their payments, reflected in the higher rating given to them by credit ratings agencies.
Issuance: The act of making bonds available to investors by the borrowing (issuing) company, typically through a sale of bonds to the public or financial institutions.
Maturity: The maturity date of a bond is the date when the principal investment (and any final coupon) is paid to investors. Shorter-dated bonds generally mature within 5 years, medium-term bonds within 5 to 10 years, and longer-dated bonds after 10+ years.
Par value: The original value of a security, such as a bond, when it is first issued. Bonds are usually redeemed at par value when they mature.
Yield: The level of income on a security over a set period, typically expressed as a percentage rate. For a bond, at its most simple, this is calculated as the coupon payment divided by the current bond price.
Yield to worst: The lowest yield a bond with a special feature (such as a call option) can achieve provided the issuer does not default. When used to describe a portfolio, this statistic represents the weighted average across all the underlying bonds held.
Volatility: A measure of risk using the dispersion of returns for a given investment. The rate and extent at which the price of a portfolio, security or index moves up and down.