
Are investors being sufficiently compensated for taking asymmetric risk? In this article, portfolio manager Aneet Chachra and David Elms, Head of Diversified Alternatives, evaluate changing market conditions for equity volatility in the US and UK.
Last week I received a letter from Warren Buffett (well from GEICO1 actually) notifying me that my car insurance premium will go up 20%. This was a surprise – my cars and I are getting older, no claims in the last five years, and no tickets either. I pointed this out to customer service but received no sympathy: “California rates have recently been adjusted after a review of average claim and repair costs”. I decided to switch insurers, but after searching for an hour realized the major firms all have near-identical rates. As I must buy car insurance, I have no choice but to take the price hike. GEICO and its US peers have strong pricing discipline to charge a healthy margin over expected claims.
Across the pond, my colleague in London is having the opposite experience. UK claim costs are also rising, but car insurance premiums are falling due to increased competition. Industry consultants estimate that claims this year will be 104% of premiums collected2. This is irrational underwriting but the British car insurance market is highly fragmented. Incumbents want to stay in and preserve their market share. Selling car insurance is not naturally profitable – only if priced appropriately to cover expected losses.
Volatility trading has a similar profile to insurance. In both, the buyer pays to be protected from rare but costly outcomes, while the seller collects premiums, but makes occasional payouts. In general, we expect the seller to be compensated for providing this service and for premiums to exceed payouts over the medium term. We also expect rates to rise after a period of elevated losses for the seller to continue accepting large downside risks.
The outcome from selling volatility has historically followed both these expectations. The most popular volatility strategy is systematically selling 1-month at-the-money puts on the S&P 500 Index while investing the collateral cash in a money market account3. The CBOE publishes an index called PUT which tracks simulated returns back to July 1986. Broadly, the PUT index has performed in-line with the S&P 500, but with only about two-thirds of the volatility and maximum drawdown. These characteristics make PUT look attractive as an equity replacement strategy.
Figure 1: CBOE PUT index vs S&P 500 index (total returns, rebased to 100 at start)
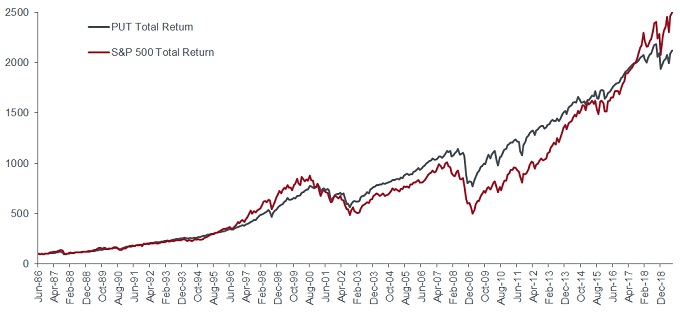
Source: Bloomberg, Janus Henderson, July 1986 to July 2019.
Note: Monthly data from index series, excludes transaction costs.
Past performance is not a guide to future performance.
Based on this past performance, numerous research reports and investment firms have popularized option selling over the last few years. New products that track PUT and similar strategies have launched with many pensions/endowments implementing in-house as well.
Although the long-term backtest looks great, PUT has been underperforming the S&P 500 since December 2016. The PUT strategy takes both equity and volatility risk, but we can isolate the volatility component. Roughly, for each put option sold, the equity position is equivalent to being long 0.5 units (on average) of the underlying index for a month. Very approximately4:
1-month volatility-only return = (1-month total return on the PUT index) – (0.5 x 1-month total return on the S&P 500 index)
We computed this simplified volatility return for each day from July 1986 to July 2019. The 1-month volatility-only return has averaged +0.43% per month over the period from July 1986 to November 2016. However, since then the volatility-only return has been negative, averaging -0.14% per month from December 2016 onwards. Selling S&P 500 volatility has generally been unprofitable for over two years now, despite a fairly benign economic environment. Premiums being collected are below recent payouts. Unlike US car insurance, a wide range of market participants can sell volatility while relatively few participants are mandated to buy volatility.
Crossing the ocean back again to the UK – there is no readymade equivalent to the PUT index. But using historical FTSE price/implied volatility/dividend forecasts along with UK rate data, we put together a series that approximates the daily estimated cost and payoff at expiry from selling 1-month at-the-money puts on the FTSE 100 index. We also add estimated interest on collateral to build a rough UK equivalent to the PUT index from October 2007 to July 2019 (the period we have data for)5.
Figure 2: UK put selling vs equity index (total returns, rebased to 100 at start)
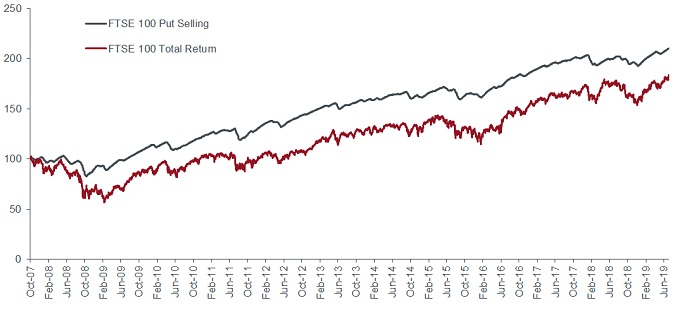
Source: Bloomberg, Janus Henderson, October 2007 to July 2019.
Note: Option prices calculated using market implied volatility and Black-Scholes formula, excludes transaction costs.
Past performance is not a guide to future performance.
We also similarly compute the volatility-only return for each day in this new UK series. The 1-month volatility-only return has averaged +0.29% per month in the UK, which compares to +0.15% per month in the US over the same time period (October 2007 to July 2019).
Notably, since December 2016 we can estimate the volatility-only return in the UK to be about +0.10% per month. Although small, it is well above the volatility-only return in the US of -0.14% per month. Selling FTSE volatility has been slightly profitable6 on average over the last two years despite weak UK equity returns, Brexit issues, and a sharp drop in the British pound.
There are likely fewer participants selling UK volatility (compared to the US) while Brexit-related turmoil is perhaps creating more demand from volatility buyers. The UK volatility market appears to have been priced to reflect some risk of a disorderly Brexit which still remains a possibility ahead. Meanwhile, US volatility pricing is not even covering realized market moves nor building any profit buffers for a more severe 1987, 2000-2002, or 2008-2009 type environment.
Both volatility and car insurance sellers take left tail risk while truncating right tail return. Therefore the seller should be well-compensated for assuming asymmetric risk. For GEICO, the best-case outcome is receiving $1700 in annual premium from me but the worst-case is a $1 million payout. I’m sure that Warren Buffett/Ajit Jain7 are pricing this risk correctly hence the 20% price hike. Recent evidence suggests that US equity volatility players are being less circumspect than them. Like insurance, the market for volatility is a function of supply-demand imbalances. Just because selling volatility has historically performed well doesn’t predict future profits if there is additional passive supply from automated selling programs.
We don’t believe in selling equity volatility without evaluating pricing and market conditions. The juice should be worth the squeeze. At present, systematic sellers are not even covering costs in a historically mild volatility environment and are unprepared for more difficult conditions.
Instead we think it currently makes sense to opportunistically buy, not sell, dips in equity volatility especially as a way to protect and add new positions elsewhere in our portfolio during market selloffs. We also like holding some deep tail hedges8 that can be carried at very low cost but provide significant payoffs if large market moves suddenly occur.
1 GEICO is a wholly-owned subsidiary of Berkshire Hathaway2 UK motor insurers face losses this year, Financial Times, June 13, 2019
3 The number of options put sold is matched so that the notional value exposed is equal to the cash in the account. In the extremis case that the underlying index falls to zero, the cash would be wiped out, but there is no leverage beyond that
4 This is a simplification – it assumes the option delta at inception (~0.50) holds for the entire month. In reality, there is a time-varying component as the market moves and the delta changes. But this dynamic component averages to zero over time. For most investors, the direct comparison between PUT and S&P 500 is appropriate as they are unlikely to be delta-hedging intra-month
5 This is a simplified model as we price the option using the Black-Scholes formula with historical market inputs and then calculate the subsequent net payoff (option value at expiry + interest on collateral – initial option price). The entire net payoff is recognized at expiration, which ignores intra-month moves. The end result is the same, but this has a smoothing effect on the dark grey line shown in Figure 2
6 Actual profits would be quite slim after incorporating realistic transaction costs
7 Ajit Jain is Vice Chairman of Insurance for Berkshire Hathaway and a possible successor to Warren Buffett
8 We frequently hold delta-hedged out-of-the-money long option positions which leave us positively exposed to gap risk