
Key takeaways:
- The UK market has outperformed the US over the last couple of years, supported by improving fundamentals and a rotation away from expensive US growth stocks.
- UK market returns have become increasingly concentrated, with the top 20 stocks accounting for a disproportionate share of performance, particularly during the second half of 2025.
- The dominance of a small number of stocks has left large parts of the UK market — including more domestically-exposed larger stocks as well as the FTSE 250 — trading at attractive valuations, presenting opportunities for active managers to generate further returns.
The FTSE All-Share Index returned almost 24% in 2025 and has continued to perform strongly in 2026, outperforming the US market after many years of playing catch-up (Figure 1).
After the turmoil of ‘Liberation Day’ on 2 April 2025 – when US President Donald Trump announced new tariffs – fears of an artificial intelligence (AI) bubble intensified, driving volatility in AI-related stocks as the year progressed. The Magnificent 7 (Mag 7), which had powered US market performance in recent years and had largely moved in tandem, began to underperform and diverge.
Figure 1: UK equities regain momentum, outperforming the US after years of underperformance
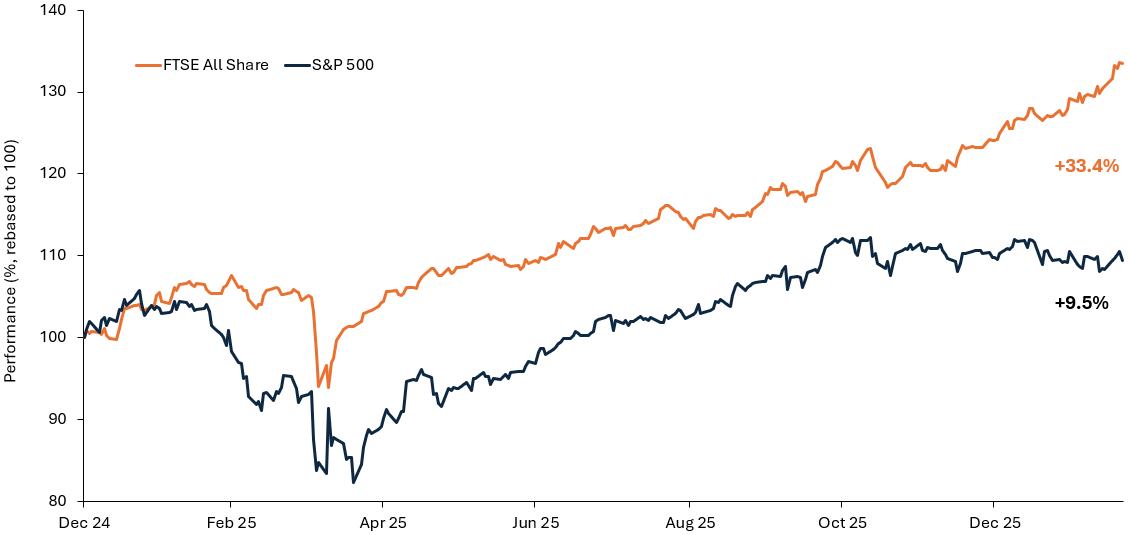
Source: Refinitiv DataStream, Janus Henderson Investors, 31 December 2024 to 23 February 2026, rebased to 100 at start date, in sterling. Past performance does not predict future returns.
At the same time, more value-orientated stocks and markets, such as the UK, started to outperform US growth stocks, as investors questioned the scale of AI-related capital expenditure, the returns it would generate, and the valuation level of some stocks (Figure 2).
Figure 2: Divergence of performance – UK and US value stocks versus growth stocks
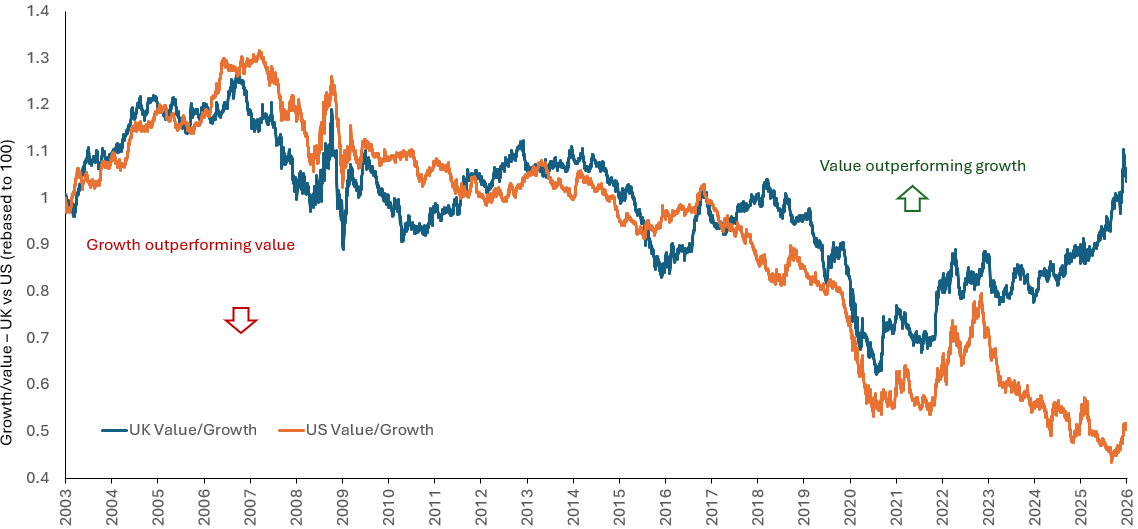
Source: Refinitiv DataStream, Janus Henderson Investors, 3 March 2003 to 3 March 2026, rebased to 100 at start date, showing relative performance between value vs growth stocks for the FTSE All-Share Index and S&P 500 Index. Past performance does not predict future returns.
How headline outperformance masks growing concentration in equity markets – not just in the US
Market concentration in the S&P 500 has come under increased scrutiny in recent years, with a small group of stocks – the Magnificent 7 – accounting for a significant share of overall market returns. These seven stocks alone accounted for around a third of the S&P 500’s market capitalisation at the time of writing).1
By contrast, there has been less awareness of similar market concentration dynamics in other markets, including the UK. While it is well-documented that the FTSE 100 has outperformed the FTSE All-Share Index over the past five years – its longest period of annual outperformance since the FTSE100 was launched in 1986 – this trend masks more nuanced underlying patterns, notably larger, more internationally-exposed stocks outperforming their smaller more domestically-exposed counterparts.
In particular, the top 20 stocks in the FTSE 100 have significantly outperformed the remaining 80 constituents in recent years. These top 20 stocks make up around 60% of the FTSE All-Share Index, supporting performance there, and meaningfully outperforming the remaining 80 FTSE 100 constituents and the FTSE 250 Index (Figure 3).
Figure 3: Concentration at the top has shaped UK equity returns
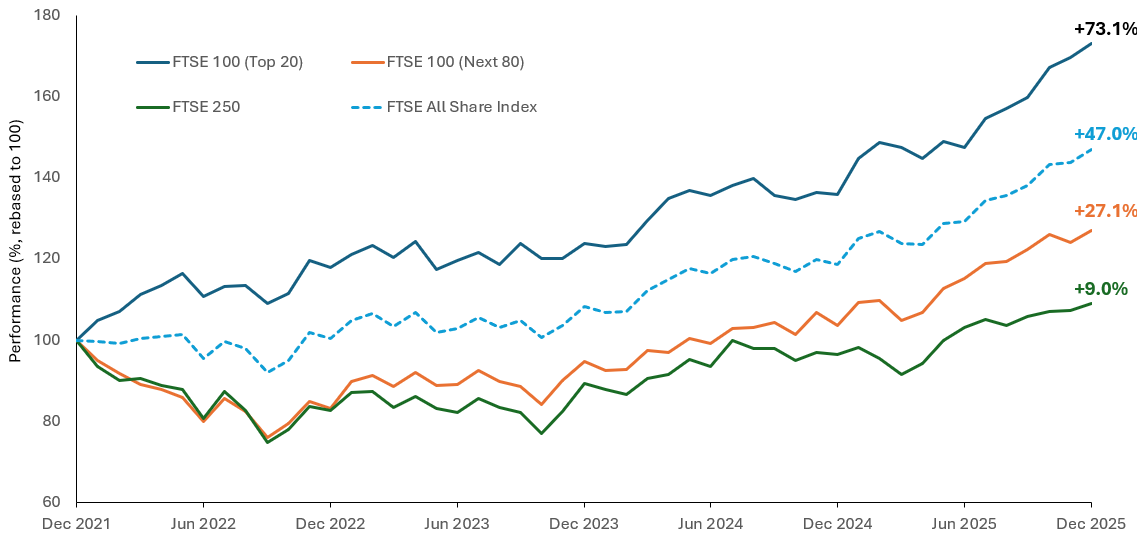
Source: Refinitiv Datastream, Janus Henderson Investors, 31 December 2021 to 31 December 2025, rebased to 100 at start date. Past performance does not predict future returns.
In 2025, and particularly the second half of the year, this trend was particularly pronounced:
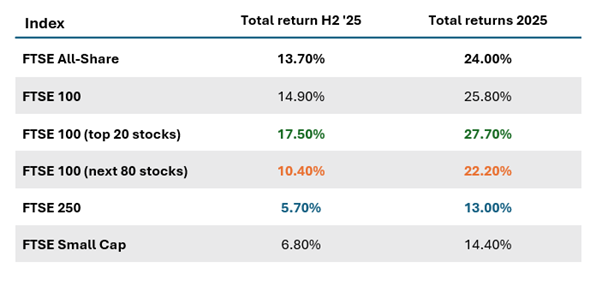
Source: Janus Henderson, FactSet, total returns in sterling. Past performance does not predict future returns.
This meant that the driver of UK market performance in the final six months of 2025 was even more concentrated than that of the US.
Figure 4 shows the % of companies within a number of major indices that outperformed in the second half of 2025. This analysis highlights the UK as the most concentrated market, with just 23% of the FTSE All-Share constituents outperforming by more than 5%.
Figure 4: UK equity returns were driven by a narrow group of stocks
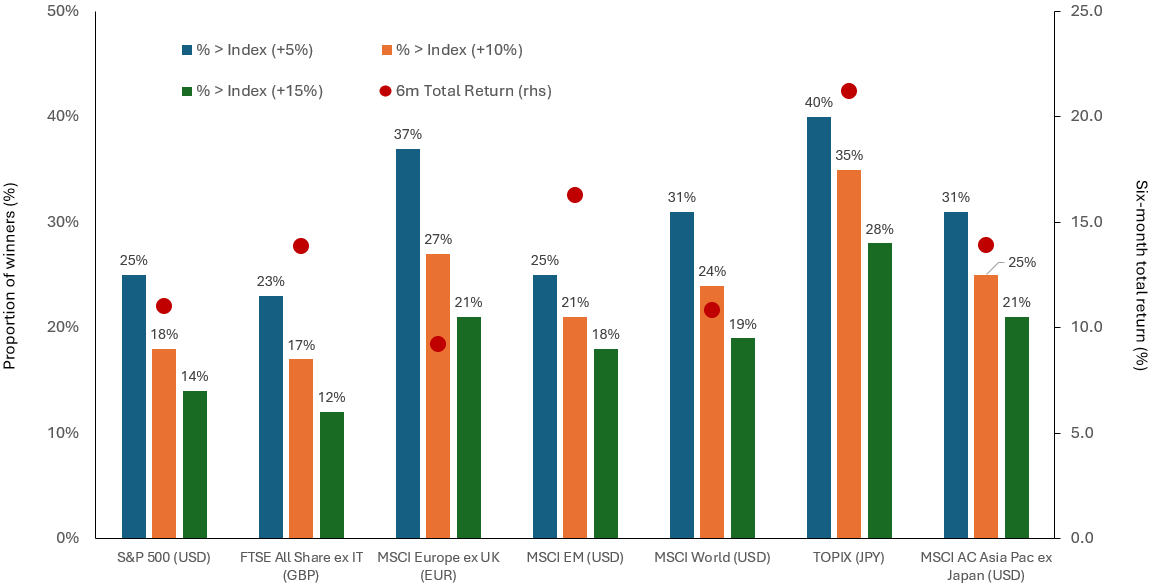
Source: FactSet, Janus Henderson Investors, six months to 31 December 2025, in local currency or US dollars. Left-hand side shows the percentage of stocks in each index that outperformed by over 5%, 10% or 15%. Right-hand side shows total return for each index, as a percentage. Past performance does not predict future returns.
Market valuation potential
The UK market’s recent strong performance has seen valuations increase, with the overall valuation now in-line with its long-term historical average.
Figure 5: Attractively valued versus other global regions
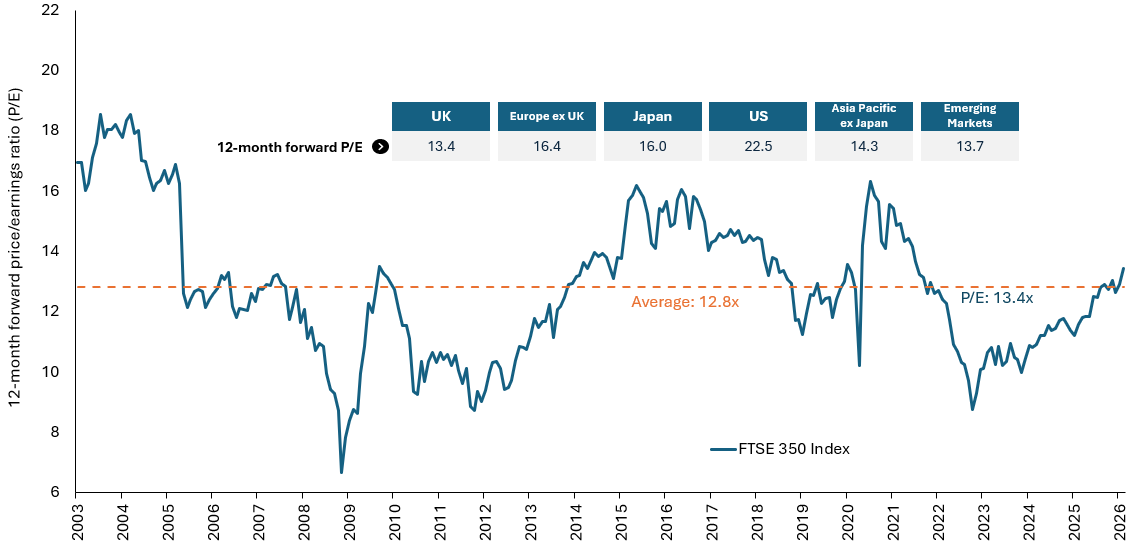
Source: Refinitiv Datastream, Janus Henderson Investors Analysis, as at 31 January 2026.Note: UK – FTSE 350, Europe ex UK – MSCI Europe ex UK, Japan – TOPIX, US – MSCI United States, Asia Pacific ex Japan – MSCI AC Pacific ex Japan, Emerging Markets – MSCI EM. Forward price-to-earnings (forward P/E) is a version of the ratio of P/E that uses forecasted earnings for P/E calculation. There is no guarantee that past trends will continue, or forecasts will be realised. Past performance does not predict future returns.
However, it remains cheap versus other global markets, notably the US, and segments of the market, such as stocks outside the top 20 of the FTSE 100 and those within the FTSE 250, are still trading at what appear to be particularly attractive valuation levels.
Figure 6: FTSE 250 is good value vs FTSE 100
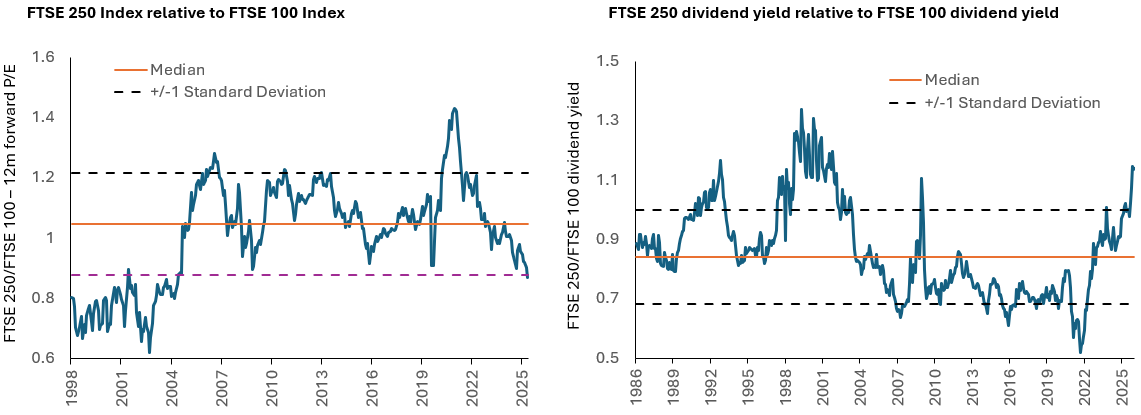
Source: Refinitiv Datastream, Janus Henderson Investors analysis, as at 31 December 2025. Past performance does not predict future returns. Standard deviation: A statistic that measures the variation or dispersion of a set of values/data in relation to a mean. In terms of valuing investments, standard deviation can provide a gauge of the historical volatility of an investment.
We believe the disconnect in performance between the top 20 stocks and the rest of the market provides investors with an opportunity. The FTSE 250’s dividend yield relative to the FTSE 100’s is now at highs only previously seen after the Global Financial Crisis and the dotcom bubble.
Looking ahead, the outlook for UK equites appears well-supported. Inflation is expected to continue to fall, and while near-term interest cuts may now be less likely due to recent events in the Middle East, corporate earnings are forecast to grow by around 10% this year. There are also early signs that overseas investor interest in UK equities is beginning to improve, as global investors seek to reduce their reliance on the US and diversify their exposure. Against this backdrop, the case for reassessing allocations to UK equities is becoming increasingly compelling – particularly for active investors looking beyond the top 20 names.
1MotleyFool.com; Apple, Amazon, Alphabet, Meta, Microsoft, NVIDIA and Tesla market capitalisation vs S&P 500 Index as at end February 2026.
Dividend yield: The income received on an investment relative to its price, expressed as a percentage.
Dot-com bubble: A period of excessive speculation in internet-related companies during the late 1990s, when share prices rose sharply despite many businesses having unproven or unsustainable business models. The bubble peaked in 2000 and subsequently burst, leading to a steep market decline and the collapse of many technology companies.
Forward price-to-earnings (P/E): A stock valuation metric that is calculated by dividing the current share price by projected earnings for the next 12 months to value a company’s shares.
Fundamentals: Information that contributes to the valuation of a security, such as a company’s earnings or the evaluation of its management team, as well as wider economic factors.
Global Financial Crisis (GFC): The global economic crisis from mid-2007 to early 2009 that began with losses related to mortgage-backed financial assets in the US and spread to affect financial markets and banks globally. Also known as the ‘Great Recession’.
Magnificent Seven (MAG 7): The term ‘Magnificent Seven’ refers to the seven major technology stocks—Apple, Microsoft, Nvidia, Amazon, Tesla, Alphabet, and Meta—that have dominated markets in recent years.
Market capitalisation: The total market value of a company’s issued shares. It is calculated by multiplying the number of shares in issue by the current price of the shares. The figure is used to determine a company’s size and is often abbreviated to ‘market cap’.
Market concentration: A portfolio with high weightings to a particular market or markets. These portfolios typically have greater risk than more-diversified portfolios, given that an adverse event could result in significant volatility or losses, but the potential to outperform is also greater.
Valuation: The assessment of the worth of a company, investment, or asset based on future cash flows, financial statements, and other key indicators.
Volatility: The rate and extent at which the price of a portfolio, security, or index, moves up and down. If the price swings up and down with large movements, it has high volatility. If the price moves more slowly and to a lesser extent, it has lower volatility. The higher the volatility, the higher the risk of the investment.