Vooruitzichten voor vastrentende waarden: Veerkracht opbouwen in 2026
Alex Veroude, Global Head of Fixed Income, explains why the credit cycle in fixed income still has further to run in 2026, but investors should build some resilience into their portfolios.

12 beknopt artikel
Kernpunten
- US rate cuts and subdued inflation should broadly support fixed income, but scrutiny over policy motives will shape yield curve dynamics.
- We think corporate bond yields remain attractive, but investors should monitor historically tight credit spreads and the impact of increased AI-driven debt issuance on supply dynamics.
- Securitised assets and private credit can provide diversification, high credit quality, and income potential, which in our view makes them a strategic consideration for resilient portfolios.
Nature abhors a vacuum. Shorn of official US economic data in late 2025, markets began to speculate, with some high-profile bankruptcies and a torrent of AI-related debt issuance unsettling markets. But we should not confuse idiosyncratic issues at a few companies and shifting supply dynamics as spelling the end of the credit cycle. The economic picture looks broadly supportive for fixed income in 2026 but will demand vigilance. As such, we believe investors should look to build some resilience into their portfolios.
Liberation Day to Independence Day
One thing is for certain: If the US dominated headlines in 2025, things are not likely to change in 2026. The US will celebrate 250 years since its foundation as an independent country, so expect a party – perhaps the biggest you’ve ever seen. Whether the year’s festivities translate into stronger economic growth is debatable, but there are plenty of factors that should support economic activity in 2026. Consumers and companies will benefit from tax cuts enacted in the One Big Beautiful Bill Act; de-regulation has the potential to alleviate corporate roadblocks and encourage M&A; and monetary policy in the US is likely to see further interest rate cuts.
On the negative side of the ledger, the distorting impacts on data following the government shutdown may be a source of volatility in the near term, particularly in relation to jobs. Additionally, while we are arguably past peak tariff volatility – unless the Supreme Court throws them out – we still need to be watchful for any second-order effects on inflation.
Central bank policy supportive, but credibility is key
Rate cuts in the US should be broadly supportive for fixed income. But markets may be paying closer attention to the “why” rather than the “what” around rate decisions.
Jerome Powell’s term as Chair of the US Federal Reserve (Fed) ends in 2026. The White House favours the next Chair to be “Team Trump”, implying accommodative monetary policy. Whoever is appointed to the role will help shape not just US monetary policy but the risk-regime of markets globally. Expect greater scrutiny over whether cuts are justified (responding to weakness in economic growth or employment) or seen as pro-cyclical (easing despite strong growth or above-target inflation). Regardless, we expect cuts to pull down the front end of the yield curve. The outlook further along the curve is more ambiguous, causing us to generally favour shorter-dated securities, with duration (rate sensitivity) played more tactically across the year.
Exhibit 1: US yield curve is relatively flat compared to other developed markets
Difference between yield on 2-year and 10-year government bond (%)
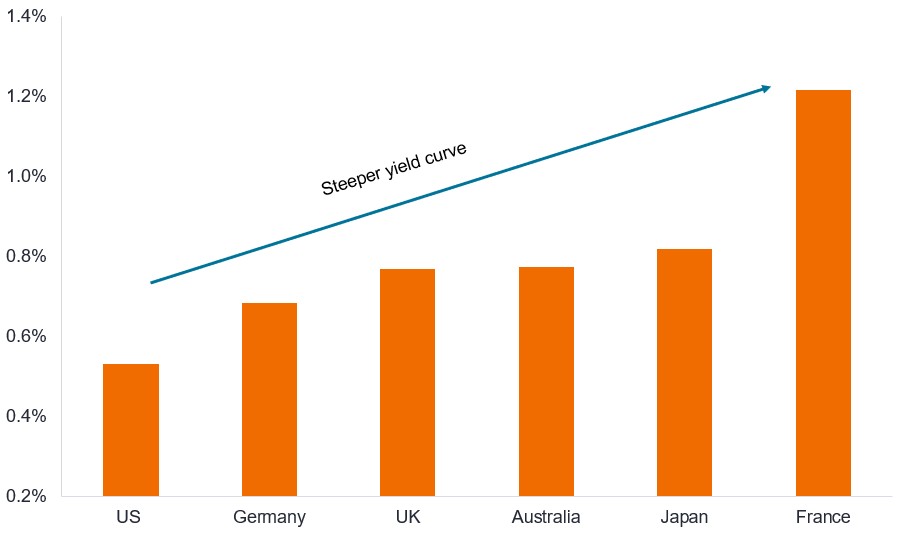
Source: Bloomberg, 10-year government bond yield minus 2-year government bond yield of various countries, as of 24 November 2025. The yield curve is a graph that plots the yields of similar quality bonds against their maturities. In normal conditions, an upward sloping yield curve is expected, where yields for shorter-maturity bonds are lower than yields for bonds with a longer maturity. The bigger the difference between a shorter dated bond and a longer-dated bond the steeper the yield curve. Yields may vary over time and are not guaranteed.
Elsewhere, contained inflation should generally keep monetary policy on the side of fixed income investors. We expect further cuts from the Bank of England and the European Central Bank to be on hold, while in emerging markets Brazil is likely to see reductions. The Bank of Japan is likely to be the main outlier among developed markets as it raises rates as part of its policy normalisation process.
AI debt issuance: Too much of a good thing?
Supply and demand for corporate bonds were supportive through most of 2025 as investors sought the yield uplift from credit. Whilst we see ongoing appetite for corporate bonds throughout 2026, we recognise the market will have to absorb heavy financing related to artificial intelligence (AI), particularly for data centres.
Having been the poster child for self-funded growth, hyperscalers’ successive debt capital raisings in late 2025 came as a surprise, even if this was mostly from investment grade (IG) companies. With claims that global AI infrastructure CapEx could total US$3-4 trillion by 2030, this is likely to exceed cashflows among tech companies, requiring debt financing (both public and private) and pushing technology as a share of the US IG market well above its current level of 7%.1 If this is wasteful spending, then it may express itself more in equity volatility. IG bondholders should still get paid, because many of the hyperscalers are starting from a low- or no net-debt position and have healthy cash flows from existing operations.2
Opportunities may arise in sectors benefiting from AI expenditure such as utilities, where revenues may be more stable and obsolescence of electricity and water infrastructure less of an issue. Given the size of recent deals, we should probably expect AI debt funding to put upward pressure on spreads in 2026, with ripple effects across ratings and sectors. Europe may be less impacted given AI debt supply is likely to be skewed more to the US.
Holding tight and seeking resilience
The supply picture may be more challenging for corporate bonds in 2026, but the fundamentals appear robust. Leverage levels, in aggregate, are around the average for the last 10 years, and interest cover remains high for both investment-grade and high-yield credits in the US and Europe3. Earnings expectations for 2026 are broadly positive4, which should underscore cashflows and repayments to bond investors, helping to keep defaults contained.
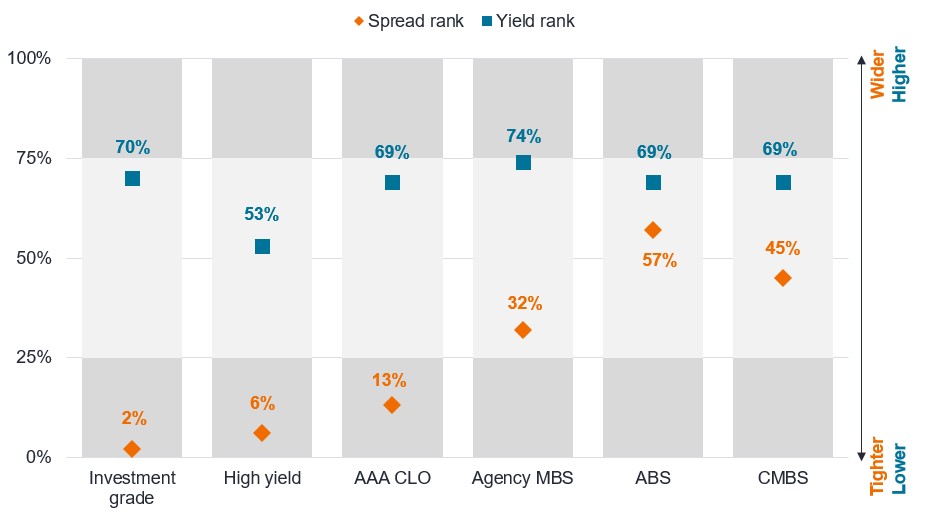
Confidence to lend to borrowers is high, hence credit spreads (the additional yield that corporate bonds pay over government bonds of similar maturity) are at historically tight (low) levels, although are closer to average levels for securitised assets such as asset-backed securities (ABS) and mortgage-backed securities (MBS) (see Exhibit 2).
With corporate spreads tight, we view active management as increasingly important, with a focus on avoiding issuers with deteriorating cash flow but also seeking to extract relative value between richly valued and under-loved credits. Yields, however, remain elevated compared with much of the period since the 2008 Global Financial Crisis (GFC), which may prove valuable against a backdrop of falling rates in the US. This offers some room for yields to fall, but how much investors might benefit depends on how spreads behave.
Exhibit 2: Yields are above average, but spreads are tight in corporates
Current percent ranking for spreads and yields in US compared with last 10 years
| Metrics | Investment grade | High yield | AAA CLO | Agency MBS | Door activa gedekte effecten | CMBS |
|---|---|---|---|---|---|---|
| Spread (bps) at 31/10/25 | 78 | 281 | 131 | 28 | 95 | 121 |
| 10y tight (bps) | 74 | 261 | 110 | 7 | 56 | 77 |
| 10y wide (bps) | 272 | 880 | 302 | 75 | 75 | 75 |
| 10y average (bps) | 116 | 401 | 161 | 37 | 98 | 138 |
| Yield at 31/10/25 | 4.8% | 6.8% | 5,2% | 4.7% | 4.7% | 4.9% |
Source: Janus Henderson Investors, Bloomberg, as of 31 October 2025. One basis point (bp) equals 1/100 of a percentage point, 1bp = 0.01%. Investment grade = Bloomberg US Corporate Bond Index, High yield = Bloomberg US Corporate High Yield Bond Index, AAA CLO = J.P. Morgan Collateralised Loan Obligation AAA Index, Agency MBS = Bloomberg US Mortgage Backed Securities (MBS) Index, ABS = ICE BofA US Asset Backed Securities Index, CMBS = ICE BofA US Commercial Mortgage Backed Securities Index. AAA CLO spreads experienced a one day spread widening of 26bps on 28 June 2023 when J.P. Morgan transitioned the referenced rate from LIBOR to SOFR. A lower (tighter) percent ranking means yields are relatively low and spreads are relatively low (tight), i.e., below average compared with the last 10 years. For example, a ranking of 25% means over the past 10 years only 25% of observations have been lower and 75% have been higher. A ranking of 75% means 75% of observations have been lower and only 25% have been higher. There is no guarantee that past trends will continue or forecasts will be realised. Yields may vary over time and are not guaranteed.
Just because spreads are tight does not mean they cannot remain at tight levels for long periods if conditions are benign. For example, if we take the US high yield bond market going all the way back to 1998 and compare how many weeks spreads have been tighter than their rolling 10-year average, there were 20 periods. Some of these periods were short, e.g., less than a month, so are just noise. If we only include periods lasting more than eight weeks, however, we can narrow it down to nine “tight episodes”, the shortest of which was nine weeks (to 30 April 2010) and the longest 198 weeks (to 21 February 2020). The average length of these tight episodes is 72 weeks, so the current episode we are in may have longer to run.
Exhibit 3: Corporate bond credit spreads can remain tight for extended periods
| US high yield bonds | Metriek |
|---|---|
| Number of episodes where bond spreads were below 10-year average | 20 |
| Number of “tight episodes” where bond spreads were below average for more than 8 weeks | 9 |
| Shortest length of tight episodes (weeks) | 9 |
| Longest length of tight episodes (weeks) | 198 |
| Average length of tight episodes (weeks) | 72 |
| Current tight episode length (weeks) | 32 |
Source: Janus Henderson Investors, Bloomberg, Bloomberg US Corporate High Yield Bond Index, spread, weekly data, 27 November 1998 to 21 November 2025. Current tight episode length is from week ending 18 April 2025 to week ending 21 November 2025. There is no guarantee that past trends will continue or forecasts will be realised. Past performance does not predict future returns.
Exhibit 2 demonstrated that spreads remain relatively wide among securitised assets. Opportunities should abound within securitised sectors of the market, where regulatory changes (i.e., Solvency II capital recalibration, and Basel III reproposal) could lead to potential reductions in risk weights, increasing the appetite for higher-quality loan tranches and mortgages from banks and insurers. We continue to view AAA collateralised loan obligations (CLOs) as offering attractive yields above those offered by money markets.
Regarding asset-backed securities (ABS), we think concerns about consumer credit are overblown outside a narrow subset. We recognise that lower-income borrowers face challenges from weak income growth and benefit less from the wealth effect of rising asset prices, which creates stress in some areas. This argues for selectivity, but in the main, US consumers continue to service debts well. It is often overlooked that borrowing standards evolve with consumer health, leading to more conservative lending practices as the consumer weakens.
In our view, securities linked to real estate continue to offer select opportunities. Agency mortgage-backed securities (agency MBS) have spreads closer to average levels historically. The technical backdrop is strong and improving, as regulatory relief in the US and Europe and lower short-term interest rates should boost demand for MBS.
For residential credit, fundamentals remain solid, with disciplined underwriting, earlier home price appreciation, and structural housing supply constraints providing support. As Exhibit 4 demonstrates, the more recent vintages of residential credit are much better quality than those leading up to the GFC.
Exhibit 4: Key credit characteristics of US residential credit
| 2024 vintage | Pre-GFC crisis | ||
|---|---|---|---|
| CES | HELOC | CES | |
| FICO credit score (higher is better) | 735 | 740 | 679 |
| Combined loan to value (lower is better) | 68% | 66% | 96% |
| Combined loan to value (lower is better) | 68% | 66% | 96% |
Source: Janus Henderson Investors, Core Logic, Freddie Mac, Nomura, as of 20 March 2025. Notes: 2024 vintage versus 2000-2007 vintage for second lien loans. Closed End Second (CES) = a second mortgage that allows a homeowner to tap into their home equity without affecting the rate on their first mortgage. HELOC = Home Equity Line of Credit (A bit like a credit card, the homeowner can borrow and repay the loan at will). Combined loan to value = outstanding loan balance (this includes all loans and liens such as first mortgage, second mortgage or home equity line of credit) divided by the appraised value of the property. Past performance does not predict future returns.
Private matters
The private credit market continues to expand and evolve as institutions, in particular, look for the income potential and quality risk-adjusted returns offered by private credit. The narratives that will play out in public credit markets will have their equivalent in private markets. Private credit needs to – and is – playing a role in the build-out of tech infrastructure, not least because private markets are leading the charge in areas such as fintech.
The high-profile failures at Tricolor and First Brands we do not see as indicative of systemic problems with private credit but more a confluence of the lagged effect of higher rates on over-leveraged companies and weak oversight. Just as public credit has many facets, so does private credit. Early growth in private credit was fuelled by direct lending, which offered attractive yields but relies heavily on a borrower’s operational success. By contrast, asset-backed finance (ABF) ties loans to tangible or financial assets such as receivables, inventory, or real estate. In stressed conditions, these assets can be liquidated to support repayment. Private credit deals can be layered in a way that aims to absorb losses before senior debt is at risk.
For investors looking for opportunities in private credit in 2026, robust deal structuring should be top of mind, together with rigorous oversight and transparency. Managers who can demonstrate superior risk controls will be the likely winners, in our view.
Samenvatting
Taken together, we believe that income will be the primary driver of returns from fixed income in 2026. Rich valuations mean investors need to be more discriminatory, but we think it is too early to call the end of the credit cycle. In our view, investors should consider the broad fixed income spectrum, making use not just of conventional areas such as sovereign and corporate bonds, but also considering the opportunities and income potential afforded by securitised assets and private credit.
The focus on tech spending may also mean 2026 is a year in which investors increasingly look at the innovation taking place within the world of fixed income, from increasing use of quantitative analysis to tokenisation – factors we believe will shape fixed income for years to come.
Belangrijke informatie
Diversificatie garandeert geen winst. Ook neemt diversificatie het risico op beleggingsverliezen niet weg.
Fixed income securities are subject to interest rate, inflation, credit and default risk. The bond market is volatile. As interest rates rise, bond prices usually fall, and vice versa. The return of principal is not guaranteed, and prices may decline if an issuer fails to make timely payments or its credit strength weakens.
High-yield or “junk” bonds involve a greater risk of default and price volatility and can experience sudden and sharp price swings.
Securitized products, such as mortgage- and asset-backed securities, are more sensitive to interest rate changes, have extension and prepayment risk, and are subject to more credit, valuation and liquidity risk than other fixed-income securities.
1Source: Nvidia earnings call, 27 August 2025, Nvidia CEO Jensen Huang predicts global $3-4 trillion AI infrastructure opportunity by the end of the decade; ICE BofA US Corporate Index, tech as a % of index market value at 31 October 2025. There is no guarantee that past trends will continue, or forecasts will be realised.
2Source: Hyperscalers here include Alphabet, Amazon, Microsoft, Meta. Correct at end of Q3 2025 earnings results.
3Source: Morgan Stanley, US and Europe investment grade and high yield fundamentals, at end Q2 2025.There is no guarantee that past trends will continue, or forecasts will be realised.
4Source: LSEG Data & Analytics, 2026 estimated earnings growth across various regions, at 21 November 2025. There is no guarantee that past trends will continue, or forecasts will be realised.
Bloomberg US Corporate Bond Index measures the investment grade, fixed rate, taxable corporate bond market.
Bloomberg US Corporate High Yield Bond Index measures the USD-denominated, high yield, fixed rate corporate bond market.
Bloomberg US Mortgage Backed Securities (MBS) Index tracks fixed rate agency mortgage backed pass-through securities guaranteed by Ginnie Mae, Fannie Mae and Freddie Mac.
ICE BofA AAA US Fixed Rate CMBS Index tracks the performance of US dollar denominated investment grade AAA rated fixed rate commercial mortgage backed securities publicly issued in the US domestic market.
ICE BofA US Fixed Rate Asset Backed Securities Index tracks the performance of US dollar-denominated investment grade fixed rate asset backed securities publicly issued in the US domestic market.
ICE BofA US Corporate Bond Index tracks the performance of US dollar-denominated investment grade debt publicly issued in the US domestic market.
J.P. Morgan Collateralised Loan Obligation AAA Index tracks the performance of AAA-rated debt tranches of broadly syndicated, arbitrage US dollar-denominated debt.
Agency Mortgage-backed Securities (Agency MBS): A type of asset-backed security that is specifically secured by a collection of mortgages. These securities are issued by one of the three government-sponsored enterprises (GSEs): Fannie Mae (Federal National Mortgage Association), Freddie Mac (Federal Home Loan Mortgage Corporation), or Ginnie Mae (Government National Mortgage Association).
Asset-backed Securities (ABS): These are financial instruments that are backed by a pool of assets—typically those that generate a cash flow from debt, such as loans, leases, credit card balances, or receivables.
Basis point: One basis point (bp) equals 1/100 of a percentage point, 1bp = 0.01%.
Collateral: In a securitisation, collateral refers to the pool of financial assets that are bundled together to form the basis of a security.
Collateralised Loan Obligations (CLO's) zijn schuldeffecten die in verschillende tranches met verschillende risiconiveaus worden uitgegeven, en die gedekt worden door een onderliggende portefeuille die hoofdzakelijk is opgebouwd uit leningen aan bedrijven onder investment-grade kwaliteit. Terugbetaling van de hoofdsom is niet gegarandeerd en de koersen kunnen dalen als betalingen niet tijdig gedaan worden of wanneer de kredietwaardigheid afneemt. CLO's zijn onderhevig aan het liquiditeitsrisico, het renterisico, het kredietrisico, het callrisico en het risico dat de onderliggende activa in gebreke blijven.
Commercial Mortgage-backed Securities (CMBS): A type of mortgage-backed security that is secured by the loan on commercial real estate properties rather than residential real estate.
Credit cycle: The changing availability and pricing of credit that is linked to economic expansion and contraction. It is seen as having four distinct phases: downturn, repair, recovery, and expansion. Borrowing and spending is expansionary and helps sustain economic growth but when lenders restrict lending this can lead to a downturn and businesses and households have to repair their finances until the economy moves back into recovery and expansion.
Kredietwaardigheid: Een score die wordt gegeven door een kredietbeoordelaar zoals S&P Global Ratings, Moody's en Fitch over de kredietwaardigheid van een kredietnemer. S&P rangschikt bijvoorbeeld investment grade obligaties van de hoogste AAA tot BBB en hoogrentende obligaties van BB via B tot CCC in termen van afnemende kwaliteit en groter risico, d.w.z. Kredietnemers met een CCC-rating lopen een groter risico op wanbetaling.
Kredietspread: Het renteverschil tussen effecten met dezelfde looptijd maar van verschillende kredietkwaliteit. Verruimende spreads duiden over het algemeen op een verslechtering van de kredietwaardigheid van zakelijke kredietnemers, en vernauwingen duiden op een verbetering.
Wanbetaling: het onvermogen van een debiteur (zoals een emittent van obligaties) om rente te betalen of om het oorspronkelijk geleende bedrag op de vervaldag terug te betalen.
Duration: Duration measures the sensitivity of a bond’s or fixed income portfolio’s price to changes in interest rates. The longer a bond’s duration, the higher its sensitivity to changes in interest rates and vice versa.
Diversification: A way of spreading risk by mixing different types of assets/asset classes in a portfolio, on the assumption that these assets will behave differently in any given scenario.
Fundamentals: In the context of corporate debt, “fundamentals” refer to the essential financial health indicators and characteristics of a company that suggest its ability to meet debt obligations.
Federal Reserve (Fed): The central bank of the US which determines its monetary policy.
Fiscaal beleid: Beschrijft het overheidsbeleid met betrekking tot het vaststellen van belastingtarieven en uitgavenniveaus. Begrotingsdiscipline houdt in dat overheden niet buitensporig lenen, d.w.z. dat ze de schuldenlast als percentage van de economische productie laag houden, zodat de totale schuldenlast niet agressief toeneemt.
High yield bond: Also known as a sub-investment grade bond, or ‘junk’ bond. These bonds usually carry a higher risk of the issuer defaulting on their payments, so they are typically issued with a higher interest rate (coupon) to compensate for the additional risk.
Inflatie het tempo waarin de prijzen van goederen en diensten in een economie stijgen.
Interest cover: A measure of how easily a company can pay interest on its outstanding debt. The interest coverage ratio is typically calculated by dividing a company’s earnings before interest, taxes, depreciation and amortisation by its interest expense during a given period.
Investment grade bond: A bond typically issued by governments or companies perceived to have a relatively low risk of defaulting on their payments, reflected in the higher rating given to them by credit ratings agencies.
Issuance: The act of making bonds available to investors by the borrowing (issuing) company, typically through a sale of bonds to the public or financial institutions.
Leverage: The level of borrowing at a company, typically referred to as debt divided by earnings.
Looptijd: De vervaldatum van een obligatie is de datum waarop de hoofdbelegging (en eventuele uiteindelijke coupon) aan beleggers wordt uitgekeerd. Obligaties met een kortere looptijd vervallen over het algemeen binnen 5 jaar, obligaties met een middellange looptijd binnen 5 tot 10 jaar en obligaties met een langere looptijd na 10+ jaar.
Monetair beleid: het beleid van een centrale bank dat erop gericht is de inflatie en de groei van een economie te beïnvloeden. Dit houdt onder meer in dat de rentes en de geldhoeveelheid onder controle worden gehouden.
Principal: Within fixed income investing, this refers to the original amount loaned to the issuer of a bond. The principal must be returned to the lender at maturity. It is separate from the coupon, which is the regular interest payment.
Particulier krediet: Een actief gedefinieerd als niet-bancaire kredietverlening, indien de schuld niet wordt uitgegeven of verhandeld op de beurs.
Quantitative analysis: A form of financial analysis that uses mathematical and statistical methods to analyse data and inform investment decisions.
Residential Mortgage-backed Securities (RMBS): A type of mortgage-backed security that is secured by the interest in residential real estate loans.
Securitisation: The process in which certain types of assets are pooled so that they can be repackaged into interest-bearing securities. The interest and principal payments from the assets are passed through to the purchasers of the securities.
Tarief: Een belasting of heffing die door de overheid van het ene land wordt geheven op de invoer van goederen uit een ander land.
Tokenisation: The process of converting ownership of real-world assets into digital token that can be traded on a blockchain (a decentralised ledger that records transactions across a network of computers in a secure, transparent and permanent way).
Rendement: de inkomsten uit een effect in een bepaalde periode, meestal uitgedrukt als een percentage.
Yield-to-worst: The lowest yield a bond with a special feature (such as a call option) can achieve provided the issuer does not default.
Volatiliteit is een maatstaf voor het risico op basis van de spreiding van de rendementen voor een bepaalde belegging. Volatiliteit weerspiegelt de beweeglijkheid van de koers van een portefeuille, effect of index.
Dit zijn de standpunten van de auteur op het moment van publicatie en kunnen verschillen van de standpunten van andere personen/teams bij Janus Henderson Investors. Verwijzingen naar individuele effecten vormen geen aanbeveling om effecten, beleggingsstrategieën of marktsectoren te kopen, verkopen of aan te houden en mogen niet als winstgevend worden beschouwd. Janus Henderson Investors, zijn gelieerde adviseur of zijn medewerkers kunnen een positie hebben in de genoemde effecten.
Resultaten uit het verleden geven geen indicatie over toekomstige rendementen. Alle performancegegevens omvatten inkomsten- en kapitaalwinsten of verliezen maar geen doorlopende kosten en andere fondsuitgaven.
De informatie in dit artikel mag niet worden beschouwd als een beleggingsadvies.
Er is geen garantie dat tendensen uit het verleden zich zullen doorzetten of dat prognoses worden gehaald.
Reclame.
12 beknopt artikel
Kernpunten
- US rate cuts and subdued inflation should broadly support fixed income, but scrutiny over policy motives will shape yield curve dynamics.
- We think corporate bond yields remain attractive, but investors should monitor historically tight credit spreads and the impact of increased AI-driven debt issuance on supply dynamics.
- Securitised assets and private credit can provide diversification, high credit quality, and income potential, which in our view makes them a strategic consideration for resilient portfolios.
Gerelateerde inzichten

