
Key takeaways:
- Inflation has come down faster than central banks were predicting, so there is no need to force through unemployment to rein in prices, opening the door to interest rate cuts.
- Bond yields have historically always fallen in the period post the last hike, which is at odds with forward market pricing.
- If yields follow history and resume an expected downward path, this sets up the potential for higher quality bonds to deliver both income and capital gain for investors in 2024.
Is it fair to say that the disinflation theme is back on track?
It is more than back on track, it has exceeded expectations. This is contrary to economic models that saw a need for significantly higher unemployment to drive core inflation down. Bear in mind that back in June 2023, the US Federal Reserve (Fed) forecast that core inflation (core PCE) by Q4 2023 would be 3.9%1 (percentage change on the same quarter a year ago). The actual figure turned out to be 3.2%.2 Similarly, in Europe we have seen core inflation materially surprise on a downward trend and outright deflation (declining prices) in China. It turns out central banks might ultimately have been right in saying inflation was transitory. The European Central Bank (ECB) published a recent working paper (Jan 2024) that estimated only 10% of core inflation since summer 2021 was due to demand shocks, with most of the remainder due to supply shocks.3
So why has the bond market been reluctant to celebrate the fall in inflation?
The bond market did celebrate during November and December of 2023 as the Fed signalled a more dovish tone. But it is true that the fall in US 10-year Treasury yields only brought us back to where yields were in summer 2023, when the Fed did its last hike.
Assuming the Fed’s July 2023 hike was the last of this cycle we researched the historical performance of US 10-year Treasury bonds in rate cutting cycles from 1969. This approach differs from the typical bond market approaches used to estimate where 10-year yields may end up which are based on unobservable concepts such as term premium or r* (the real neutral rate of interest). It also gives a very different conclusion: 10-year bond yields have historically always fallen materially below the level that they were at the date of the last rate hike (3.87% in July 2023). In contrast, market forward pricing currently prices in the opposite conclusion: that 10-year yields will not fall below 3.9% in the coming years.
This is illustrated in the chart below showing the change in the US 10-year Treasury yield after the last hike, with T+0 representing the date of the last hike. To summarise the conclusions, we separated this out to two historical periods: the 1969-81 period (characterised by rising and high inflation) and the 1984-2018 period (characterised by declining or low inflation). Overlaid is the most recent experience (from July 2023) and the forward pricing in bond markets, i.e the path priced in for yields using the forward curves. Recall that a rise in yields leads to a fall in bond prices and vice versa, so a declining line would indicate falling yields and rising bond prices.
Change in US 10-year Treasury yield after last rate hike
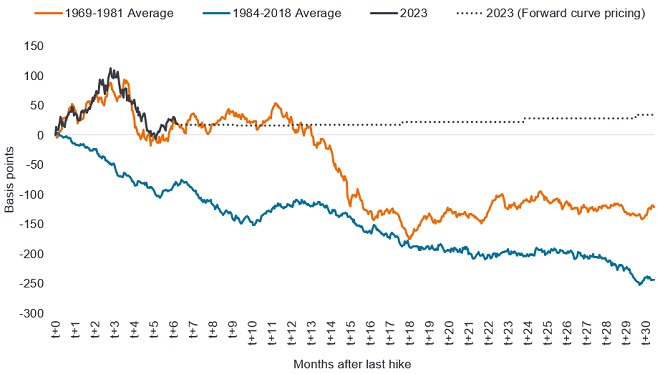
Source: Bloomberg, Janus Henderson calculations, 30 January 2024. Basis point (bp) equals 1/100 of a percentage point, 1bp = 0.01%. Past performance does not predict future returns. There is no guarantee that past trends will continue, or forecasts will be realised.
But you see all routes leading to lower yields?
That’s right. If you look out over the next 18 months, regardless of which path yields take, on average they end up considerably lower. More conclusively, 10-year bond yields always fall in a rate cutting cycle. They may trade sideways for some months (orange line) while that debate is ongoing, but even in the worst-case scenario we could find (which was back in 1974-75) 10-year yields bottomed 70 basis points below where they were at the last hike. If that were repeated this time, it would still take 10-year yields down to 3.2%, which is 70 bps below the 3.9% level they were at on 26 July 2023 when the Fed did its last hike.
Conversely, we could reconnect with the blue 1984-2018 path, which could see yields down 150-200 basis points over the next 18 months.
What is behind your confidence that rates will be cut and yields fall?
Central banks are effectively telling us. The Fed made it clear in its December 2023 Summary of Economic projections that it forecast interest rate cuts in 2024 and even more in 2025. If you take the final six months of 2023, core PCE in the US was actually at 1.9% annualised, so even lower than the year-on-year rate. With inflation back towards 2% and the Fed rate currently at 5.25%, that is a real interest rate (difference between policy rate and inflation rate) of more than 3%. The Fed will not want real rates to be so restrictive so we think rates could easily fall 200 basis points in the coming 18 months. As we noted earlier, inflation has come down already so central banks don’t need to force through unemployment to rein in prices.
In Europe, the Eurozone economy has barely grown, so we could see the ECB move first on rate cuts – potentially as soon as April. In the recent rate hiking cycle there was a high degree of synchronicity in rate hikes by developed market central banks and we think once one of the major central banks moves lower, others will follow suit, albeit at different speeds. We could see a lot of money move out of money market funds and cash deposits into bonds to try and lock in current yields.
1Source: Federal Reserve, Economic projections, June 2023.
2Source: BEA, Personal Consumption Expenditures Index, excluding Food and Energy (Core PCE), percentage change on same quarter a year ago, December 2023.
3Source: ECB, Roberto A. De Santis, Working paper Series, No 2884, January 2024. The views expressed are those of the author and do not necessarily reflect those of the ECB.
There is no guarantee that past trends will continue or forecasts will be realised.
Core Personal Consumption Expenditure (PCE) Price Index is a measure of prices that people living in the US pay for goods and services, excluding food and energy. It is a measure of inflation.
Deflation: A period of falling prices (negative inflation).
Disinflation: A fall in the rate of inflation.
Forward curve: This represents market-implied future yields of US Treasury notes of different tenors (years to maturity). They are derived from a variety of observable data but should not be viewed as predictive of actual future yields.
Inflation: The rate at which prices of goods and services are rising in the economy. Core inflation typically excludes volatile items such as food and energy prices.
Maturity: The maturity date of a bond is the date when the principal investment (and any final coupon) is paid to investors. Shorter-dated bonds generally mature within 5 years, medium-term bonds within 5 to 10 years, and longer-dated bonds after 10+ years.
The real interest rate is the rate of interest an investor, saver or lender receives after allowing for inflation.
R-star (r*): It is also known as the natural or neutral rate of interest. R-star is the real interest rate expected to prevail when the economy is operating at its full sustainable level, i.e. a rate that is neither restrictive nor expansionary.
Term premium: In standard economic theory, yields on Treasury securities are composed of two components: expectations of the future path of short-term Treasury yields and the Treasury term premium. The term premium is defined as the compensation that investors require for bearing the risk that interest rates may change over the life of the bond. Since the term premium is not directly observable, it must be estimated.
Yield: The level of income on a security over a set period, typically expressed as a percentage rate. For equities, a common measure is the dividend yield, which divides recent dividend payments for each share by the share price. For a bond, at its most simple, this is calculated as the coupon payment divided by the current bond price.
US Treasury securities are direct debt obligations issued by the US Government. The investor is a creditor of the government. Treasury Bills and US Government Bonds are guaranteed by the full faith and credit of the US government, are generally considered to be free of credit risk and typically carry lower yields than other securities.
Volatility measures risk using the dispersion of returns for a given investment. The rate and extent at which the price of a portfolio, security or index moves up and down.
These are the views of the author at the time of publication and may differ from the views of other individuals/teams at Janus Henderson Investors. References made to individual securities do not constitute a recommendation to buy, sell or hold any security, investment strategy or market sector, and should not be assumed to be profitable. Janus Henderson Investors, its affiliated advisor, or its employees, may have a position in the securities mentioned.
Past performance does not predict future returns. The value of an investment and the income from it can fall as well as rise and you may not get back the amount originally invested.
The information in this article does not qualify as an investment recommendation.
There is no guarantee that past trends will continue, or forecasts will be realised.
Marketing Communication.