
Key takeaways:
- While the February CPI numbers were in line with expectations, signs that Core PCE – the Fed’s preferred measure of inflation – may be on the wrong track raise concerns about the overall trajectory of U.S. consumer prices.
- Furthermore, a sustained spike in oil prices could flow through to future inflation prints and put the Fed in a tricky position where it may not be able to overlook a sudden rise in energy prices.
- We continue to favor the short end of the yield curve as a hedge against potential weakening in the economy or a rise in term premiums due to concerns surrounding a possible oil-driven uptick in inflation.
The good
The February consumer price index (CPI) numbers released on March 11 came in tepid and in line with consensus expectations, proving that inflation as measured by consumer prices continues to move in an encouraging direction.
Headline CPI came in at 0.27% for the month of February, a year-over-year (YoY) increase of 2.43%. Core CPI, which excludes energy and food, came in at 0.22%, up 2.47% YoY. Incidentally, this was the lowest core CPI YoY print in almost five years, since the post-COVID inflation spike of early 2021.
The highlight from today’s numbers was undoubtedly Owner’s Equivalent Rent (OER) coming in at 3.17% on a YoY basis (its lowest level since Oct 2021) and offering reassuring signs that shelter affordability is improving.
OER is now back to the steady-state level witnessed from 2016-2020, once housing had recovered from the Global Financial Crisis (GFC) but before the post-COVID spike in home price inflation (HPA).
The bad
Now for the not-so-good news. The Core PCE (personal consumption expenditure) inflation release, which is due out on Friday, will likely look significantly worse than this morning’s numbers. We anticipate that YoY Core PCE inflation may exceed 3% and, more concerningly, appears to be heading in the wrong direction.
This is a result of PCE inflation being more focused on what consumers actually buy, and thus, Core PCE has higher exposure to healthcare and less exposure to housing. Over the long term, PCE inflation has historically averaged approximately 50 basis points (bps) less than CPI. This relationship is currently flipped, with PCE inflation approximately 50 bps higher than CPI.
This puts the Federal Reserve (Fed) in somewhat of a Gordian Knot, given they are on the record saying Core PCE is their “preferred” measure of inflation. While Chair Powell has some cover since his term is up in May, incoming Chair Kevin Warsh faces a difficult decision in whether to cut rates, especially if the labor market continues its feeble path.
The (potentially) ugly
Finally, oil is up approximately 33% since the beginning of the Iran War. While this may be a temporary phenomenon, we would expect oil to settle at a higher level than where it was two weeks ago. A useful heuristic is that a 10% increase in oil may be expected to increase headline inflation by 20-30 bps.
While today’s inflation numbers do give the market some relief, we could face some nasty inflation prints in the months ahead if the impacts of a higher oil price begin to show up more broadly. This could put the Fed in a tricky position where it may not be able to overlook a sudden rise in energy prices.
Exhibit 1: West Texas Intermediate (WTI) Crude Oil Futures (Feb 2025 – March 2026)
A sustained spike in oil prices could flow through to future inflation prints.
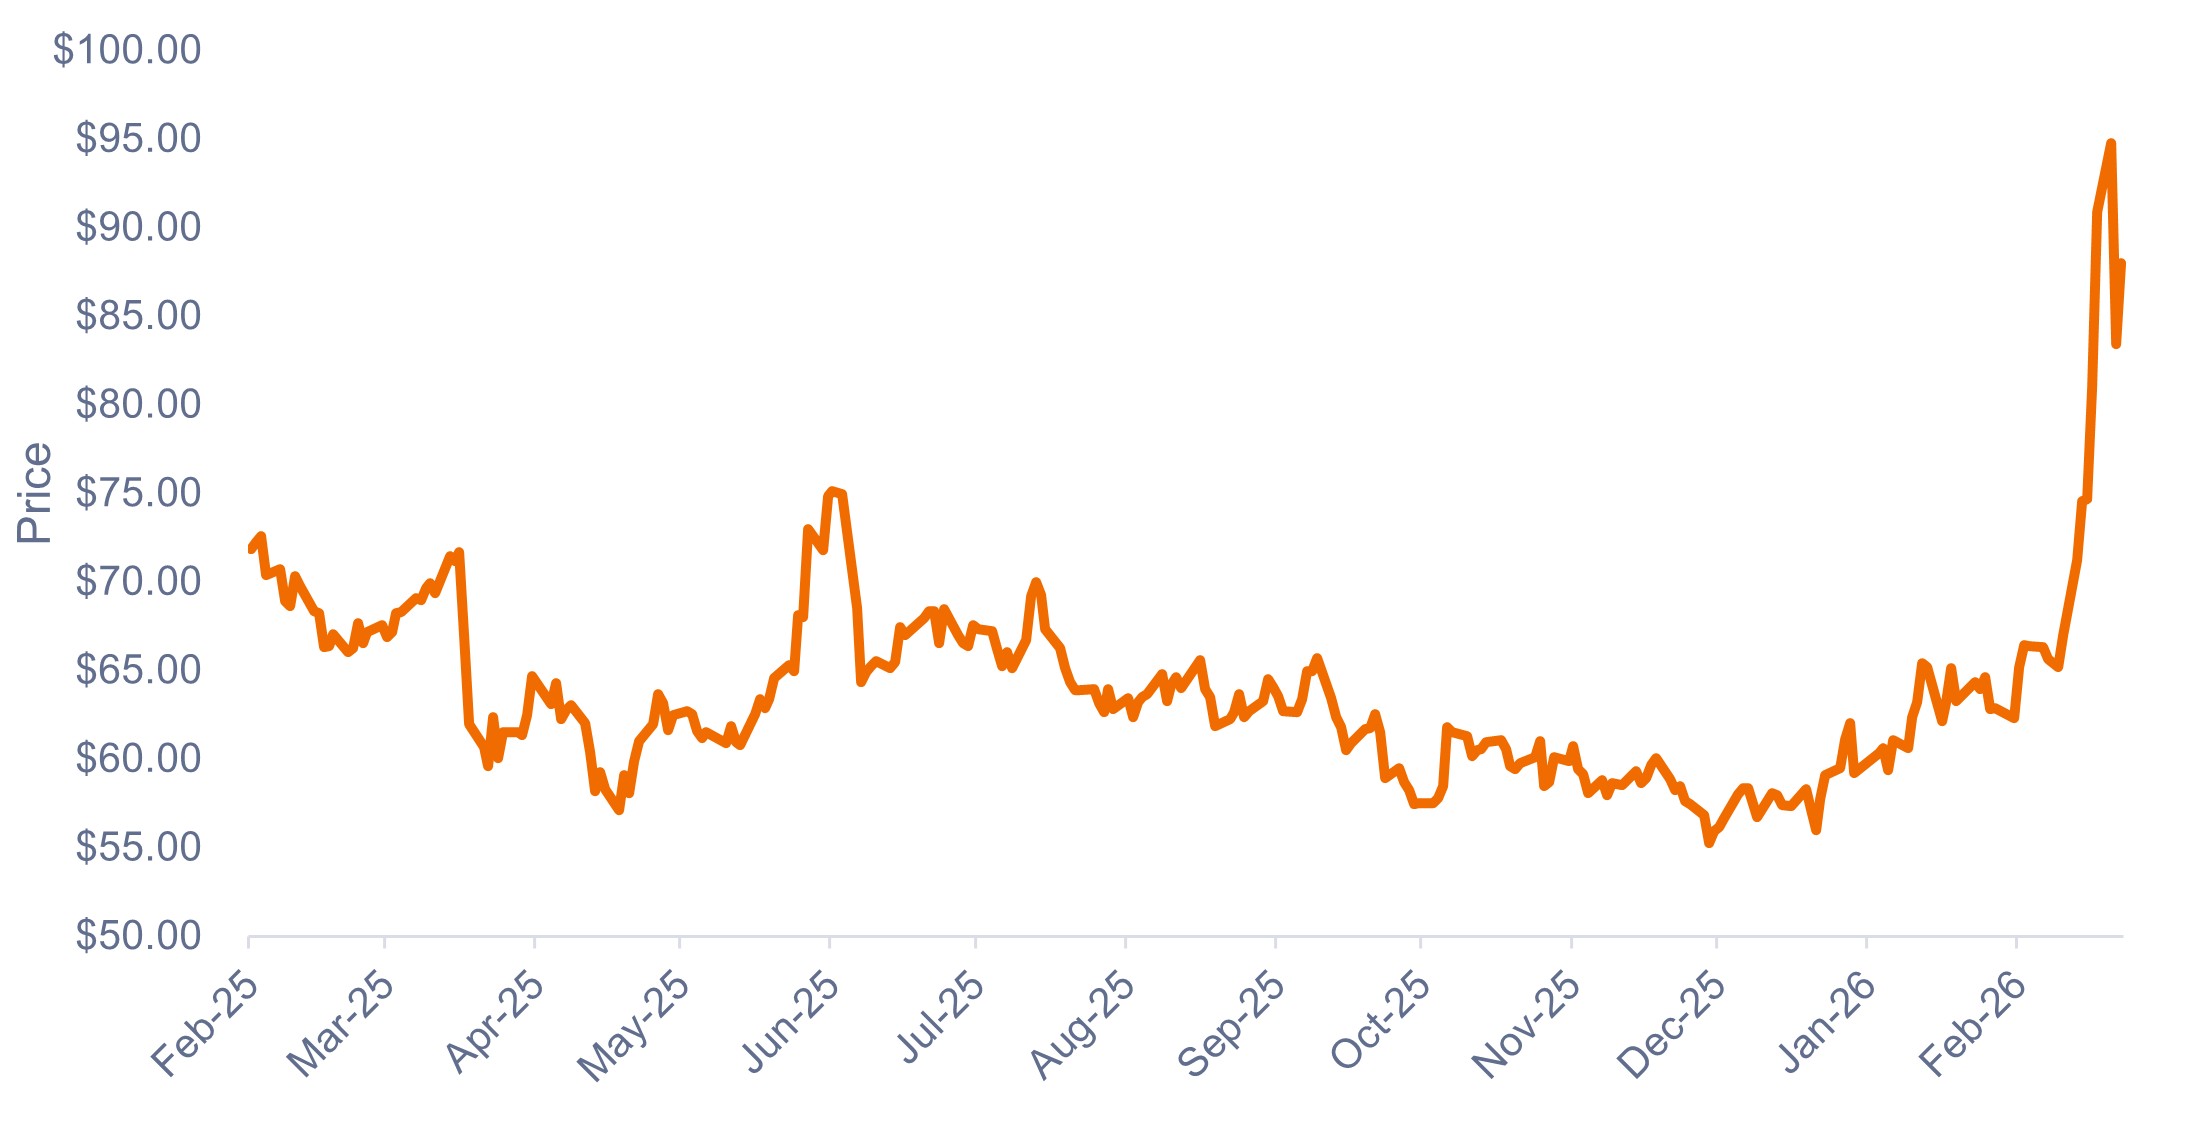
Source: Bloomberg, as of 11 March 2026.
Implications for fixed income investors
Given that February’s inflation numbers were in line with expectations, the immediate response in the U.S. bond market was fairly muted.
From a positioning standpoint, we continue to favor an overweight to the short end of the yield curve. Shorter duration may serve as hedge against any potential weakening in the economy or a rise in term premiums due to concerns surrounding a possible oil-driven uptick in inflation, as well as large fiscal deficit spending.
At the same time, we remain bullish on credit spread risk exposure – particularly within attractively priced securitized sectors – as U.S. economic growth continues to be robust. While some sectors exhibit late-cycle characteristics, resilient consumer spending and corporate profitability – bolstered by artificial intelligence (AI) adoption – should sustain economic momentum, while significant AI-driven investments in chips and data centers are anticipated to further fuel growth.
IMPORTANT INFORMATION
Artificial intelligence (“AI”) focused companies, including those that develop or utilize AI technologies, may face rapid product obsolescence, intense competition, and increased regulatory scrutiny. These companies often rely heavily on intellectual property, invest significantly in research and development, and depend on maintaining and growing consumer demand. Their securities may be more volatile than those of companies offering more established technologies and may be affected by risks tied to the use of AI in business operations, including legal liability or reputational harm.
Fixed income securities are subject to interest rate, inflation, credit and default risk. The bond market is volatile. As interest rates rise, bond prices usually fall, and vice versa. The return of principal is not guaranteed, and prices may decline if an issuer fails to make timely payments or its credit strength weakens.
Securitized products, such as mortgage-backed securities and asset-backed securities, are more sensitive to interest rate changes, have extension and prepayment risk, and are subject to more credit, valuation and liquidity risk than other fixed-income securities.
Basis point (bp) equals 1/100 of a percentage point. 1 bp = 0.01%, 100 bps = 1%.
Consumer Price Index (CPI) is an unmanaged index representing the rate of inflation of the U.S. consumer prices as determined by the U.S. Department of Labor Statistics.
Credit Spread is the difference in yield between securities with similar maturity but different credit quality. Widening spreads generally indicate deteriorating creditworthiness of corporate borrowers, and narrowing indicate improving.
Duration measures a bond price’s sensitivity to changes in interest rates. The longer a bond’s duration, the higher its sensitivity to changes in interest rates and vice versa.
Owners’ Equivalent Rent (OER) is a measure of inflation and housing costs, representing the hypothetical monthly rent a homeowner would pay to rent their own home.
The yield curve is a line that plots the yields, or interest rates, of bonds that have equal credit quality but different maturity dates.
These are the views of the author at the time of publication and may differ from the views of other individuals/teams at Janus Henderson Investors. References made to individual securities do not constitute a recommendation to buy, sell or hold any security, investment strategy or market sector, and should not be assumed to be profitable. Janus Henderson Investors, its affiliated advisor, or its employees, may have a position in the securities mentioned.
Past performance does not predict future returns. The value of an investment and the income from it can fall as well as rise and you may not get back the amount originally invested.
The information in this article does not qualify as an investment recommendation.
There is no guarantee that past trends will continue, or forecasts will be realised.
Marketing Communication.