Elevated valuations demand selectivity in mid-cap growth
While valuation risk exists at the extremes of the market, Portfolio Manager Brian Demain sees opportunities in mid-cap growth stocks given their strong fundamentals and ties to powerful secular growth themes.


5 minute read
Key takeaways:
- The concentration among the tech-focused stocks that comprise the large-cap Magnificent Seven – and “Mini Magnificent 15” in midcap – points to strong thematic undercurrents in today’s markets.
- The dominant theme of artificial intelligence (AI) is driving up valuations in mid-cap growth stocks, with a significant percentage of the benchmark trading at greater than 40x earnings despite a meaningfully higher interest rate environment.
- While we think many companies in the Russell Midcap Index offer strong fundamentals and the potential for diversification, elevated valuations mean there is less margin for error around risk taking – reinforcing our belief that a selective approach is warranted.
The last several years have been characterized by exceptionally wide dispersions in performance between growth and value stocks, and 2023 was no exception.
In the large-cap universe, the Russell 1000 Growth Index outperformed the Russell 1000 Value Index by a stunning 31%. The dispersion has been driven by the story that has dominated financial markets news in recent months: The Magnificent Seven. These seven mega-cap tech companies accounted for a full two-thirds of the performance gap between growth and value in the large-cap space in 2023. Each stock, on average, accounted for nearly 3% of the index-wide performance gap on its own.
The gap was much narrower in small cap – just 4% – with a hodgepodge of industries adding and subtracting from the dispersion and only one stock driving more than 50 basis points (bps) of performance dispersion.
Mid cap was, as it often is, somewhere in between, with the Russell Midcap Value Index generating 12.7% and the Russell Midcap Growth Index returning 25.8% in 2023. Rather than a Magnificent Seven, mid-cap stocks have what we’ve been referring to as a “Mini Magnificent 15” (see Exhibit 1). These companies mirror their famous large-cap counterparts in that they are all either tech- or communications-based, with a focus on AI, infrastructure, or consumer internet. Each of the 15 stocks in the grouping drives over 25 bps of dispersion between growth and value, and in aggregate accounted for over half of the outperformance of growth vs. value in the mid-cap space in 2023.
Exhibit 1: Companies in the “Mini Magnificent 15”
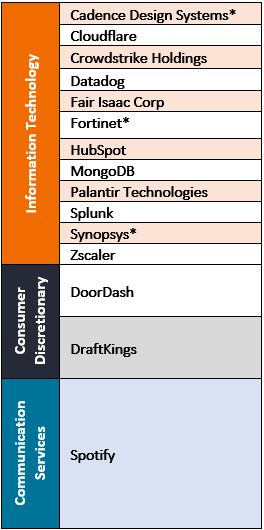
Source: Bloomberg, MSCI GICS Sector classification.
*These securities shifted out of the Russell Midcap Index as a result of the annual Russell U.S. indexes reconstitution on 23 June 2023.
Powerful market themes driving dispersion
The concentration among the “magnificents” points to strong thematic undercurrents in today’s markets. In particular, the powerful transformation story surrounding AI, and its knock-on benefits to tech infrastructure, is not just “a” but “the” market narrative – not only in large cap but in mid cap as well.
Some argue that AI is the most powerful growth story since the internet. However, this does not mean it is the only growth story – many other secular themes have strong underpinnings, notably the electrification of the economy and healthcare innovation. Additionally, many of the mid-cap Magnificent 15 stocks are now trading at similar multiples to the ones they reached in 2021, despite a meaningfully different interest rate backdrop. As such, we think the market is more likely to broaden out than not in 2024, and investors should likewise broaden their sights to growth themes beyond AI.
Be wary of high valuations
We view the extreme valuations of the most expensive names in the index as a key risk within the mid-cap growth space today. One metric worth a closer look is the percentage of the benchmark trading at north of 40x earnings. Historically, that number has been between 10% and 20%, but in the ebullient markets of 2021, it grew as high as 50% in the Russell Midcap Growth benchmark.
As shown in Exhibit 2, at the end of 2022, it appeared we were on a downward trend from these exceptionally high levels. However, in 2023, the percentage of the benchmark trading at greater than 40x earnings increased materially and remains elevated versus historical averages. What has been surprising to us is the persistency of these multiples in a meaningfully higher interest rate environment; it is much easier to make sense of paying 40x earnings when the 10-year U.S. Treasury is in the 1%-2% range (as it was for most of the 2010s) than when it is above 4% (as it is today).
Exhibit 2: Russell Midcap Growth Index – weight of stocks with P/E >40
Narratives, particularly around AI, are driving index valuations higher.
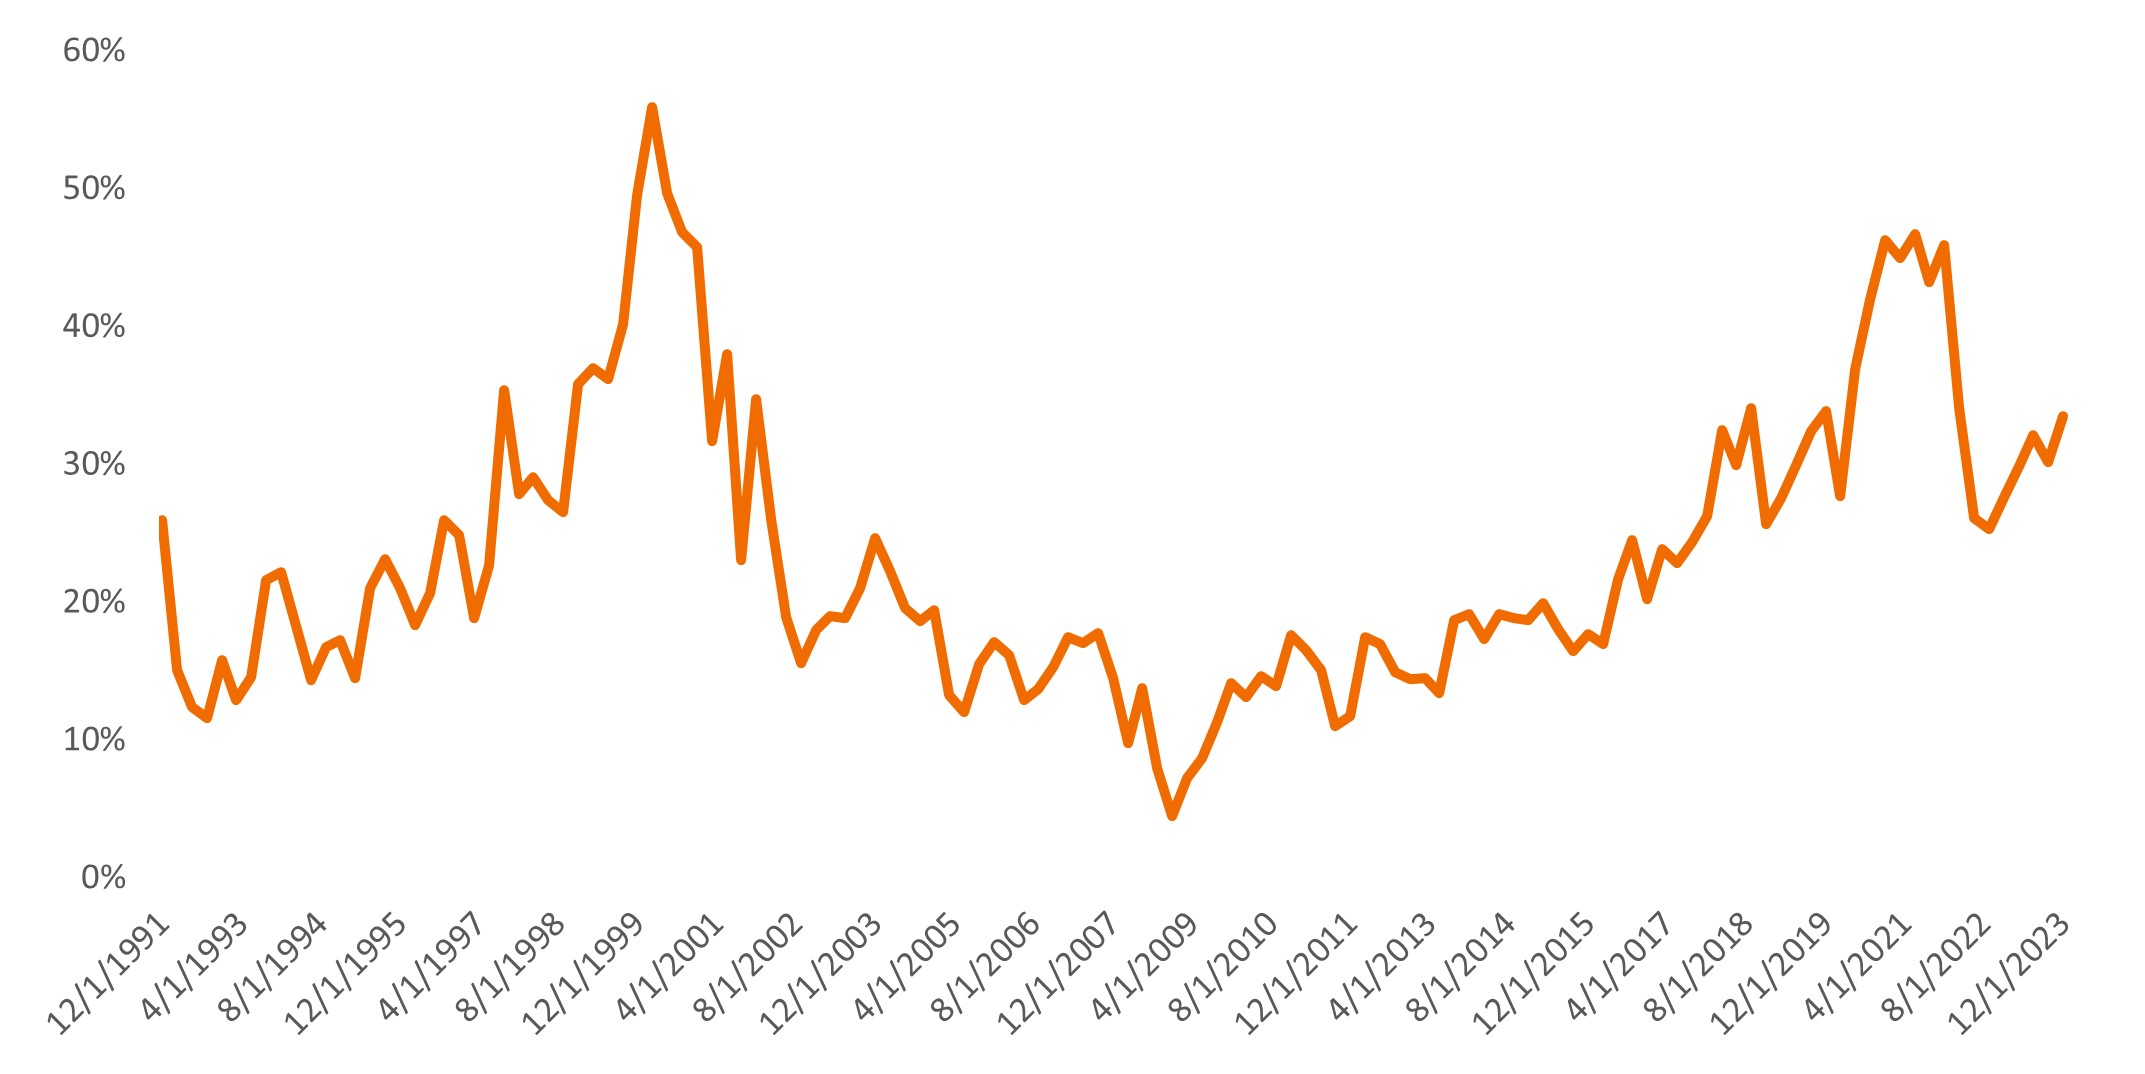
Source: FactSet, as of 31 December 2023.
To justify a 40x earnings valuation based on our assumptions, a company needs to compound earnings annually at 18% organically for a decade, effectively growing five-fold over that time.1 Very few public companies have been able to deliver this level of earnings growth over time, and the vast majority of those that have accomplished it through mergers and acquisitions (M&A). Yet within the mid-cap growth space, investors are essentially betting that one-third of companies can sustain this type of growth. While we respect the scalability of digital models, we don’t believe the fundamental laws of business have changed so drastically.
Therefore, we think mid-cap investors should be wary of overpaying for stocks and deliberate in their selection. Elevated valuations place additional emphasis on finding companies with sustainable growth profiles and strong competitive positions, rather than momentum companies with low visibility on long-term growth drivers.
The outlook for mid-cap stocks
In terms of the outlook for mid-caps given the broader economic environment, everyone is still waiting for the recession that has been looming since 2022. The market is now fully anticipating the goldilocks scenario of lower inflation, lower rates, and relatively resilient economic growth – the proverbial soft landing. While this is certainly a reasonably likely outcome, with valuations somewhat extended, there is less margin for error around risk taking – reinforcing our belief that a selective and disciplined approach is warranted.
Additionally, mid-caps have historically tended to outperform both small- and large-cap stocks over long time periods. While valuation risk exists at the extremes of the market, we think there are companies in the mid-cap index with strong fundamentals that offer a greater level of diversification than you’d get by investing in large caps or in the broad market index at this point.
Against that backdrop, we believe we are at a positive starting place for mid-caps in 2024 given their recent underperformance vs. large caps, strong fundamentals, and ties to powerful secular growth themes.
IMPORTANT INFORMATION
Smaller capitalization securities may be less stable and more susceptible to adverse developments, and may be more volatile and less liquid than larger capitalization securities.
Past performance does not predict future returns.
Diversification neither assures a profit nor eliminates the risk of experiencing investment losses.
1 A company trading at 40 times earnings would need to compound earnings annually at 18% organically for a decade to achieve a 10% annualized return assuming 75% free cash flow (FCF) conversion of earnings per share, and an exit at 25x FCF.
10-Year Treasury Yield is the interest rate on U.S. Treasury bonds that will mature 10 years from the date of purchase.
Basis point (bp) equals 1/100 of a percentage point. 1 bp = 0.01%, 100 bps = 1%.
Price-to-Earnings (P/E) Ratio measures share price compared to earnings per share for a stock or stocks in a portfolio.
Russell Midcap® Index reflects the performance of U.S. mid-cap equities.
Russell 1000® Value Index reflects the performance of U.S. large-cap equities with lower price-to-book ratios and lower expected growth values.
Russell 1000® Growth Index reflects the performance of U.S. large-cap equities with higher price-to-book ratios and higher forecasted growth values.
Russell Midcap® Value Index reflects the performance of U.S. mid-cap equities with lower price-to-book ratios and lower forecasted growth values.
Russell Midcap® Growth Index reflects the performance of U.S. mid-cap equities with higher price-to-book ratios and higher forecasted growth values.
These are the views of the author at the time of publication and may differ from the views of other individuals/teams at Janus Henderson Investors. References made to individual securities do not constitute a recommendation to buy, sell or hold any security, investment strategy or market sector, and should not be assumed to be profitable. Janus Henderson Investors, its affiliated advisor, or its employees, may have a position in the securities mentioned.
Past performance does not predict future returns. The value of an investment and the income from it can fall as well as rise and you may not get back the amount originally invested.
The information in this article does not qualify as an investment recommendation.
Marketing Communication.
5 minute read
Key takeaways:
- The concentration among the tech-focused stocks that comprise the large-cap Magnificent Seven – and “Mini Magnificent 15” in midcap – points to strong thematic undercurrents in today’s markets.
- The dominant theme of artificial intelligence (AI) is driving up valuations in mid-cap growth stocks, with a significant percentage of the benchmark trading at greater than 40x earnings despite a meaningfully higher interest rate environment.
- While we think many companies in the Russell Midcap Index offer strong fundamentals and the potential for diversification, elevated valuations mean there is less margin for error around risk taking – reinforcing our belief that a selective approach is warranted.
Related insights


