European Securitisation: a defensive income opportunity
In his 2024 outlook, Colin Fleury, Head of Secured Credit, argues that high-grade European securitised debt continues to offer an attractive opportunity to investors looking for defensive income.


7 minute read
Key takeaways:
- While central banks may be at, or close to, peak rates, we believe a broadly diversified European high-grade securitised portfolio could deliver almost 7% (sterling hedged) in 2024 if markets remain broadly stable.
- The credit quality and relatively short credit spread duration characteristics of a high-grade European securitised portfolio should offer a cushion against volatility in the event that a weaker-than-expected macro environment materialises.
- The current higher rate environment along with the additional spread offered by securitised debt is aiding recognition of the broader role securitised can play in client portfolios.
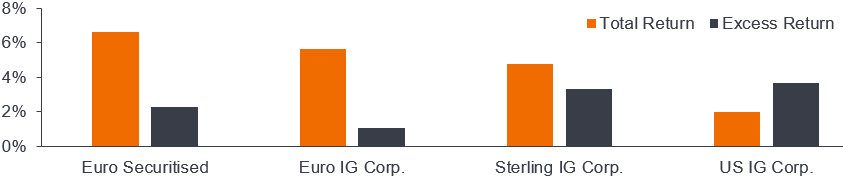
The European securitisation market has delivered another strong year of performance relative to investment grade (IG) corporate bond markets (See Figure 1).
Back in 2022, the substantial moves in long-term government bond interest rates that negatively impacted corporate bond markets were a big driver of securitisation’s outperformance given the latter’s low rates duration (sensitivity to interest rate moves).
In 2023, rates moves contributed positively to corporate bond total returns in Sterling and Euro corporate bonds whilst again being a detractor for US dollar bonds. Notwithstanding this, European securitisation in 2023 again outperformed all three IG corporate bond markets on a GBP-hedged total return basis.1
Figure 1: European securitised – strong relative performance continued in 2023
Securitised year-to-date returns in 2023 versus investment grade corporate bonds (31/12/22 – 21/11/23)
Securitised returns in 2022 versus investment grade corporate bonds (31/12/21 – 31/12/22)
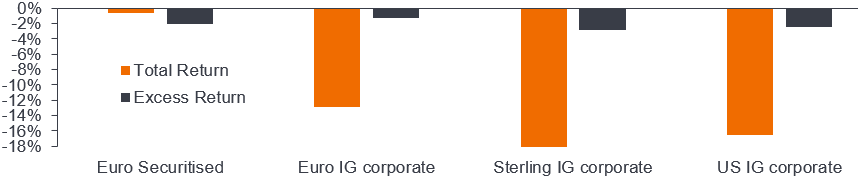
Source: ICE BofA corporate bond indices, Janus Henderson Investors Analysis, as at 21 November 2023. Note: In the absence of an index that adequately represents the Euro securitised opportunity set, Euro securitised performance shown here is for a representative Janus Henderson account: the Janus Henderson Asset-Backed Securities Fund, using end of day pricing, gross of fees. This chart is for illustrative purposes and is not a guarantee of the future performance of the Janus Henderson Asset-Backed Securities Fund. Index returns for IG corporates are hedged to GBP. Excess returns are shown relative to swaps. Past performance does not predict future returns.
Under the bonnet – collateral pool performance trends
We have been surprised at how resilient so far both consumers and corporates have been to the magnitude of central bank interest rate rises. Whilst there will of course be some lag to this – for example, mortgage borrowers with fixed rates that are yet to reset to higher rates or corporates with fixed rate bonds still to mature – generally fundamental performance of securitisation collateral pools has held up relatively well and in many instances is still around pre-COVID levels of delinquency.
There are, however, signs of stress in weaker credit profile portions of the market as can be seen from Figure 2, where we have focused on the Auto Loan sector with the non-captive portion of the market typically representing weaker borrowers. These are not trends that cause us concern when investing in more senior ranking securitisation debt, although they do suggest that greater selectivity is required with respect to more subordinate bonds.
Figure 2: UK Auto ABS deals – aggregate default ratios
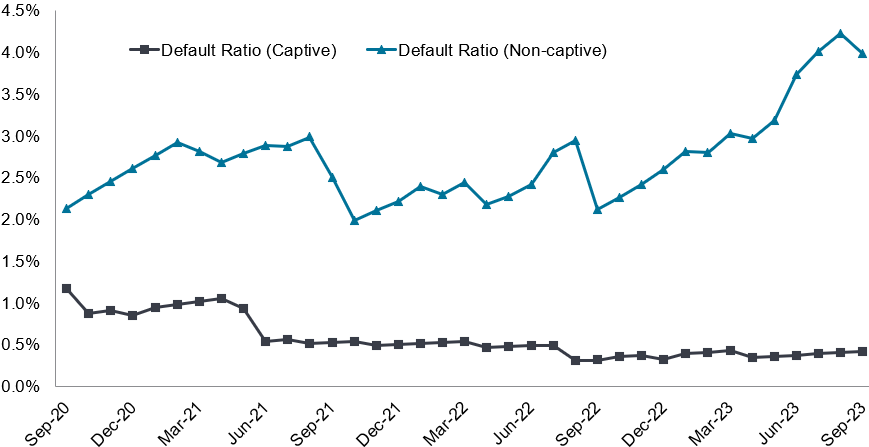
Source: JP Morgan International Securitisation Research. Data as of 30 September 2023. Note that captive auto lenders are divisions of auto manufacturing companies which facilitate lending to borrowers to allow them to buy new vehicles for higher credit quality borrowers, whereas non-captive lenders typically finance second-hand vehicles for relatively lower credit quality borrowers. Past performance does not predict future returns.
If we look at the performance of corporate loans that are held within Collateralised Loan Obligations (CLOs) there is also limited sign of material stress at this point in time. The spider plot (see Figure 3) compares some average credit statistics for the European CLO universe as of 30 September 2023 versus 31 December 2022. It can be seen that the proportion of lower price loans has decreased materially and weaker rated CCC loans remain around 3.4%. The number of defaulted holdings has crept up slightly, as has the Weighted Average Rating Factor (WARF). A WARF of around 2900 equates to an average portfolio credit rating just below single-B flat.
Figure 3: Summary of CLO collateral performance data
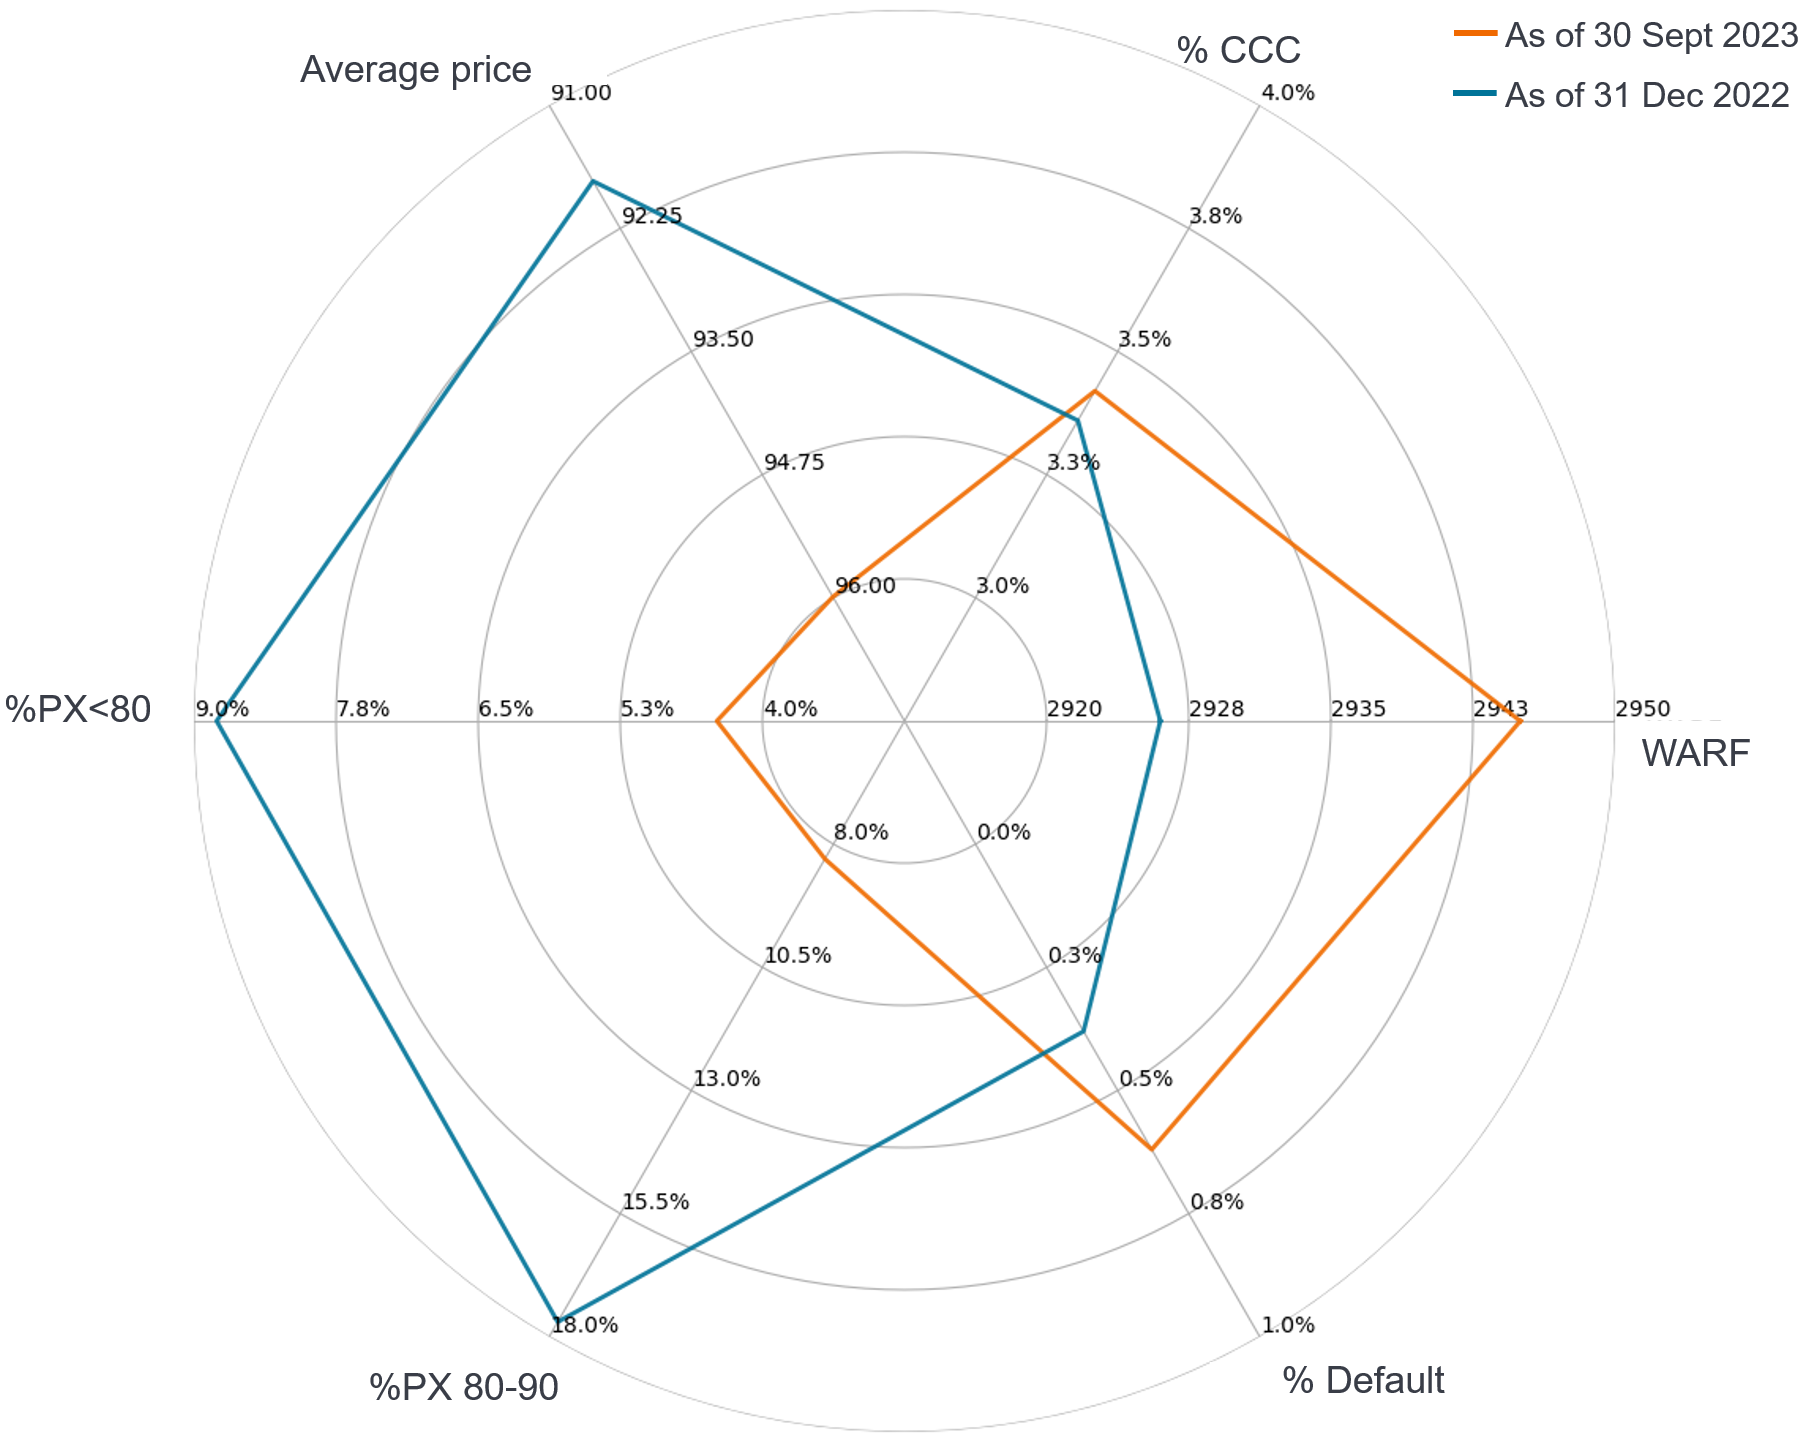
Source: Janus Henderson Investors and Moody’s Analytics. Data as of 30 September 2023 and 31 December 2022. Note: Px = Price as a % of par. WARF stands for Weighted Average Rating Factor. Past performance does not predict future returns.
What will drive returns in 2024?
In simple terms, there are two key factors that will drive returns in 2024. The first is the current level of credit spreads (and where they may move to) and the second is the future path of underlying cash rates. Today, a broadly diversified European high-grade securitised portfolio may have a credit spread over cash of around 1.6%.2 To put this in context, the ICE BofA Euro Corporate Index has a spread over swaps of around 0.9%.3
Whilst markets maybe correct in the view that central banks are close to the end of their need to hike interest rates further, it should be noted that one-year term sterling cash rates are over 5%, which would imply a potential total return of close to 7% should markets remain broadly stable. Euro cash rates are of course lower, but a Euro-hedged portfolio could still generate a return in excess of 5%, again assuming markets remain broadly stable. Please note that there is no guarantee that past trends will continue or that forecasts will be realised.
The risk to this outlook is, of course, volatility, perhaps driven by macro fundamentals weakening more than is currently expected by markets. This could impact both credit spread levels across fixed income markets and the pace at which central banks start to cut rates. That said, we believe the credit quality of a high-grade securitised portfolio (typically averaging around AA rated) and short credit spread duration (typically around 3 years) will help dampen the macro impacts that are felt by riskier portions of fixed income markets. Overall, therefore, we believe a defensive income opportunity remains. If investors are convinced that we are indeed at an interest rate pivot point, they may want to consider a combination of long duration government bonds alongside the good risk-adjusted excess returns that we believe securitised can offer.
The benefits of securitised debt in a diversified fixed income portfolio
In recent years, many of our client-facing conversations on securitised have involved UK corporate Defined Benefit (DB) clients seeking a source of liquidity to form part of a collateral waterfall to hold against interest rate hedges that are in place to match their liabilities. In this context, what has made this asset class attractive has been its liquidity, spread over cash and floating rate (i.e., low duration) – so that their collateral is not correlated to the risk they are hedging.
As gilt yields spiked sharply in September 2022, this collateral was called upon and the asset class saw sharp outflows. However, once the crisis subsided, corporate DB schemes started to replenish their collateral, but with subsequent hedges being reset with much lower leverage, we are unlikely to see flows of the same proportion back into the asset class from this source.
However, this does not mean that securitised is less relevant to long-term investors. The higher rate environment now combined with the additional spread that comes with securitised means that the return and diversification benefits of this asset class and the broader role it can play in client portfolios is becoming more recognised. Whilst we have seen a place for securitised in return-driven portfolios for many years, we are now hearing the same when clients and consultants describe a credit allocation for both Defined Benefit and Defined Contribution clients.
1 Based on year-to-date performance, as of 21 November 2023.
2 Source: Janus Henderson. Data as of 30 November 2023.
3 The ICE BofA Euro Corporate Index tracks the performance of EUR-denominated investment grade corporate debt publicly issued in the eurobond or Euro member domestic markets. Note: Index spread over swaps is as of 30 November 2023.
Volatility. The rate and extent at which the price of a portfolio, security or index, moves up and down. If the price swings up and down with large movements, it has high volatility. If the price moves more slowly and to a lesser extent, it has lower volatility. The higher the volatility the higher the risk of the investment.
Diversification. A way of spreading risk by mixing different types of assets/asset classes in a portfolio, on the assumption that these assets will behave differently in any given scenario. Assets with low correlation should provide the most diversification.
Securitised. A financial security that is ‘backed’ (or collateralised) with existing assets (such as loans, credit card debts or leases), usually ones that generate some form of income (cash flow) over time.
Collateralised Loan Obligation (CLO). A bundle of generally lower quality leveraged loans to companies that are grouped together into a single security, which generates income (debt payments) from the underlying loans. The regulated nature of the bonds that CLOs hold means that in the event of default, the investor is near the front of the queue to claim on a borrower’s assets.
Collateral waterfall. An approach to liquidity, consisting of having different kinds of assets in place to meet collateral requirements.
Hedge. A trading strategy that involves taking an offsetting position to another investment that will lose value as the primary investment gains, and vice versa. These positions are used to reduce or manage various risk factors and limit the probability of overall loss in a portfolio. Various techniques may be used, including derivatives.
Investment-grade. A bond typically issued by governments or companies perceived to have a relatively low risk of defaulting on their payments, reflected in the higher rating given to them by credit ratings agencies.
Credit spread. The difference in yield between securities with similar maturity but different credit quality, often used to describe the difference in yield between corporate bonds and government bonds. Widening spreads generally indicate a deteriorating creditworthiness of corporate borrowers, while narrowing indicate improving.
Leverage. Leverage has multiple meanings: (1). The use of borrowing to increase exposure to an asset/market. This can be done by borrowing cash and using it to buy an asset, or by using financial instruments such as derivatives to simulate the effect of borrowing for further investment in assets. (2) Leverage is also an interchangeable term for gearing: the ratio of a company’s loan capital (debt) to the value of its ordinary shares (equity); it can also be expressed in other ways such as net debt as a multiple of earnings, typically net debt/EBITDA (earnings before interest, tax, depreciation and amortisation). Higher leverage equates to higher debt levels. (3) For investment trusts: The Company’s leverage sum of financial gearing and synthetic gearing. Where a company utilises leverage, the profits and losses incurred by the company can be greater than those of a company that does not use leverage.
Monetary policy. The policies of a central bank, aimed at influencing the level of inflation and growth in an economy. It includes controlling interest rates and the supply of money. Monetary stimulus refers to a central bank increasing the supply of money and lowering borrowing costs. Monetary tightening refers to central bank activity aimed at curbing inflation and slowing down growth in the economy by raising interest rates and reducing the supply of money.
Liquidity. The ability to buy or sell a particular security or asset in the market. Assets that can be easily traded in the market (without causing a major price move) are referred to as ‘liquid’.
Gilts. UK government bonds sold by the Bank of England, used to finance public spending.
WARF. The weighted average rating factor is a measure used to indicate the credit quality of a portfolio. A higher WARF implies a riskier portfolio.
IMPORTANT INFORMATION
Volatility measures risk using the dispersion of returns for a given investment.
Credit Spread is the difference in yield between securities with similar maturity but different credit quality. Widening spreads generally indicate deteriorating creditworthiness of corporate borrowers and narrowing indicate improving.
Swaps, if any, are reported based on notional exposure.
There is no guarantee that past trends will continue, or forecasts will be realised.
Fixed income securities are subject to interest rate, inflation, credit and default risk. The bond market is volatile. As interest rates rise, bond prices usually fall, and vice versa. The return of principal is not guaranteed, and prices may decline if an issuer fails to make timely payments or its credit strength weakens.
High-yield or “junk” bonds involve a greater risk of default and price volatility and can experience sudden and sharp price swings.
Beta measures the volatility of a security or portfolio relative to an index. Less than one means lower volatility than the index; more than one means greater volatility.
These are the views of the author at the time of publication and may differ from the views of other individuals/teams at Janus Henderson Investors. References made to individual securities do not constitute a recommendation to buy, sell or hold any security, investment strategy or market sector, and should not be assumed to be profitable. Janus Henderson Investors, its affiliated advisor, or its employees, may have a position in the securities mentioned.
Past performance does not predict future returns. The value of an investment and the income from it can fall as well as rise and you may not get back the amount originally invested.
The information in this article does not qualify as an investment recommendation.
Marketing Communication.
7 minute read
Key takeaways:
- While central banks may be at, or close to, peak rates, we believe a broadly diversified European high-grade securitised portfolio could deliver almost 7% (sterling hedged) in 2024 if markets remain broadly stable.
- The credit quality and relatively short credit spread duration characteristics of a high-grade European securitised portfolio should offer a cushion against volatility in the event that a weaker-than-expected macro environment materialises.
- The current higher rate environment along with the additional spread offered by securitised debt is aiding recognition of the broader role securitised can play in client portfolios.

