

Key takeaways:
- After an extended run of U.S. market leadership, international stocks have reemerged as a meaningful source of strength for global equity allocations, with relative outperformance more frequent in recent years than headline index returns might suggest.
- Unlike the increasingly tech-heavy U.S. equity market, international markets offer more balanced exposure across growth‑ and value‑oriented sectors. Greater dispersion of returns across regions and industries also creates a favorable environment for active stock selection, in our view.
- We see compelling opportunities across several areas of international markets, including European banks and defense companies supported by long‑term structural tailwinds, as well as non‑U.S. technology firms at the heart of the AI infrastructure buildout.
Coming off a standout year, international equities are approaching the middle of 2026 in an unfamiliar position relative to U.S. stocks. In 2025, the MSCI ACWI ex USA Index delivered its strongest annual return since 2009, gaining 33% compared to a roughly 18% increase for the S&P 500® Index.1 That momentum extended into this year, with international stocks strong out of the gate and still ahead of their U.S. peers year to date (as of this writing). For context, the last time the ex-U.S. benchmark outpaced the broader U.S. equity market in consecutive calendar years was 2007.
This comes despite a challenging investment backdrop marked by rising geopolitical tensions, uncertainty around global trade, and war in the Middle East. The closure of the Strait of Hormuz and the related energy shock have reignited inflation concerns, clouded the outlook for global growth, and complicated the policy picture for central banks.
While the path forward is unlikely to be a straight line, we believe last year’s strong performance should not be viewed as an aberration. A closer look at monthly returns over the past five years reveals that international stocks outperformed their U.S. peers in 29 of 60 months, even amid a long stretch of U.S. market leadership, suggesting that relative performance has been more nuanced than headline index returns might imply.
In our view, that pattern highlights the potential role international equities can play as a counterbalance to U.S. exposure.
International stocks beat U.S. peers in 29 of 60 months over the past five years
Monthly return spread between MSCI ACWI ex USA Index and S&P 500 Index, USD
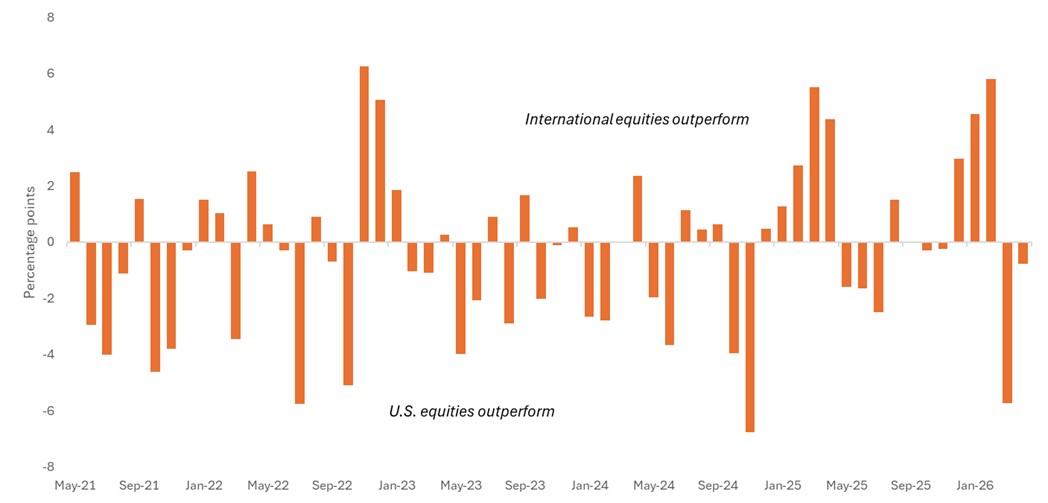
Source: Bloomberg, as of 30 April 2021 to 30 April 2026. Data are monthly and reflect total return (price change + dividends) in the MSCI ACWI ex USA Index, which reflects the equity market performance of global developed and emerging markets (excluding the U.S.), and the S&P 500 Index, which reflects U.S. large-cap equity performance and represents broad U.S. equity market performance. Past performance is no guarantee of future results.
International markets feature more balanced sector exposures
Part of the explanation lies in differences in market composition. Whereas the U.S. benchmark has become heavily concentrated in mega-cap tech and growth-oriented sectors, markets outside the U.S. offer a more varied and balanced mix of exposures. They also provide access to different sources of earnings growth, including companies tied to long-term secular trends – in some cases at more attractive valuations than their U.S.-listed peers.
As shown in the chart below, Information Technology and Communication Services currently account for nearly half of the S&P 500’s market capitalization. Notably, under current Global Industry Classification Standard (GICS®) classifications, “Big Tech” giants Meta and Google-parent Alphabet sit within the Communication Services sector rather than Information Technology. By contrast, the MSCI ACWI ex USA Index is more balanced across growth- and value-oriented sectors.
A broader, more diversified opportunity set outside the U.S.
S&P 500 Index and MSCI ACWI ex USA Index GICS sector weightings, as of 30 April 2026.
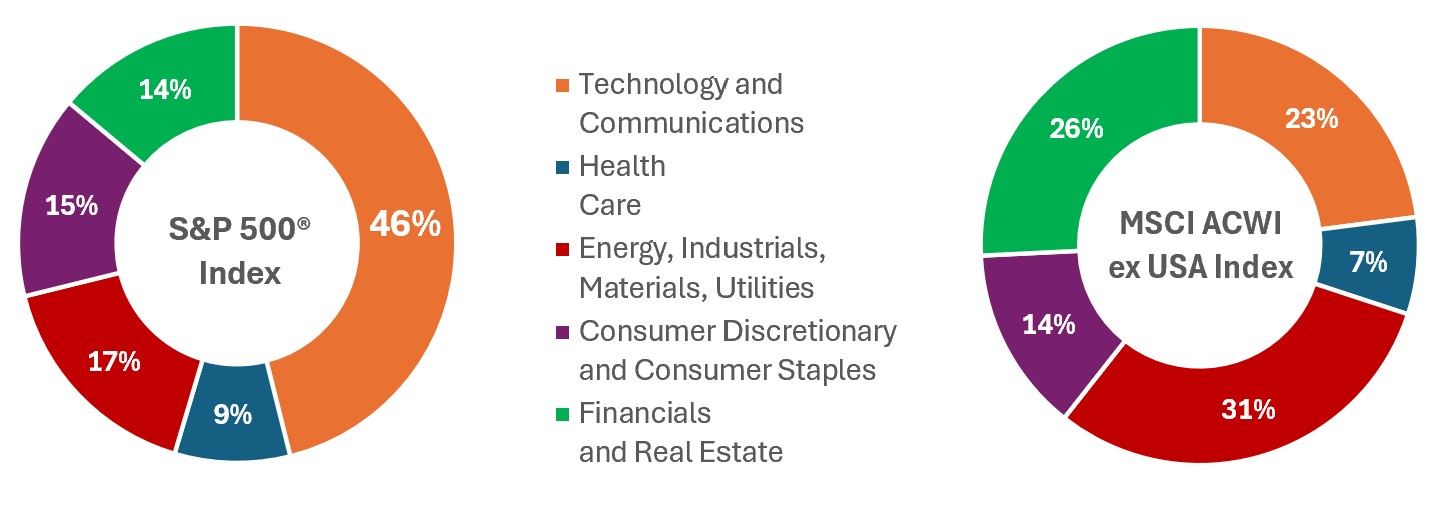
Source: S&P Global, MSCI. Data as of 30 April 2026. The MSCI ACWI ex USA Index captures large- and mid-cap representation across 22 of 23 developed markets countries and 24 emerging markets countries (excluding the U.S.). The S&P 500 Index reflects U.S. large-cap equity performance and represents broad U.S. equity market performance.
Finding opportunities in overseas markets
With higher weightings in Financials, Industrials, Materials, Utilities, and select technology firms that lie downstream from AI infrastructure spending, we believe international markets offer fertile ground for identifying leading companies poised to benefit from a range of secular trends that we see supporting fundamentals over the long term. Several areas we find particularly compelling include:
- European banks: Improved profitability, stronger capital positions, and still-modest valuations continue to support the case for European banks, in our view. As global realignment pushes Europe to focus more intently on domestic growth, competitiveness, and supply-chain resilience, banks are likely to play a key role in providing capital to the real economy. These firms also have more diversified earnings streams than when return on equity (ROE) last reached comparable levels more than 15 years ago, while prospects for banking-sector deregulation could further support loan growth.
- Defense stocks: The strained relationship between the U.S. and longtime NATO allies has reinforced Europe’s need to take greater responsibility for its own security. After decades of underinvestment, we believe the scale and duration of Europe’s rearmament cycle remain underappreciated, with structural drivers in place to support multi-year earnings growth. Some leading European firms also stand to benefit from increased U.S. defense spending. In our view, companies with differentiated capabilities, localized manufacturing footprints, and long-term contract visibility are best positioned as budgets translate into orders and earnings growth.
- Ex-U.S. technology: Unlike the U.S., where software firms comprise a large share of the technology sector, overseas markets are disproportionately weighted toward the “picks and shovel makers” at the heart of the AI infrastructure buildout. This includes many of the most critical semiconductor, memory, and equipment suppliers, with leading firms based in Taiwan, South Korea, Japan, and the Netherlands. These companies have been direct beneficiaries of the increased capital spending from hyperscalers, and in some cases trade at more attractive valuations than their U.S. peers.
We also see opportunities in areas such as batteries and power storage, where data center growth, AI-related demand for compute, and broader electrification are driving long-term demand for power infrastructure and storage solutions. Meanwhile, the energy shock from the Middle East conflict has further reinforced the importance of energy security, with net-importing countries likely to place greater emphasis on renewables-plus-battery storage and other alternatives.
Elsewhere, we see a dislocation between valuations and fundamentals creating compelling opportunities for select luxury consumer stocks. We believe the market is underappreciating the durability of these high-value franchises, setting up the potential for both stronger-than-anticipated earnings growth and multiple expansion over time.
Furthermore, while U.S. market leadership may be understandable in the context of technological innovation, deep capital markets, and earnings growth, the data supports our view that international markets offer an attractive hunting ground for opportunities that may not yet be as widely appreciated.
Over the past decade, despite U.S. companies accounting for nearly two-thirds of the MSCI ACWI Index – primarily due to outsized Big Tech representation – a disproportionate number of top-performing stocks in the benchmark have been found outside the United States. In our view, an overly narrow focus on U.S. equities risks overlooking high-quality businesses with compelling long‑term fundamentals.
Domicile of top 100 performing stocks (%), MSCI ACWI Index
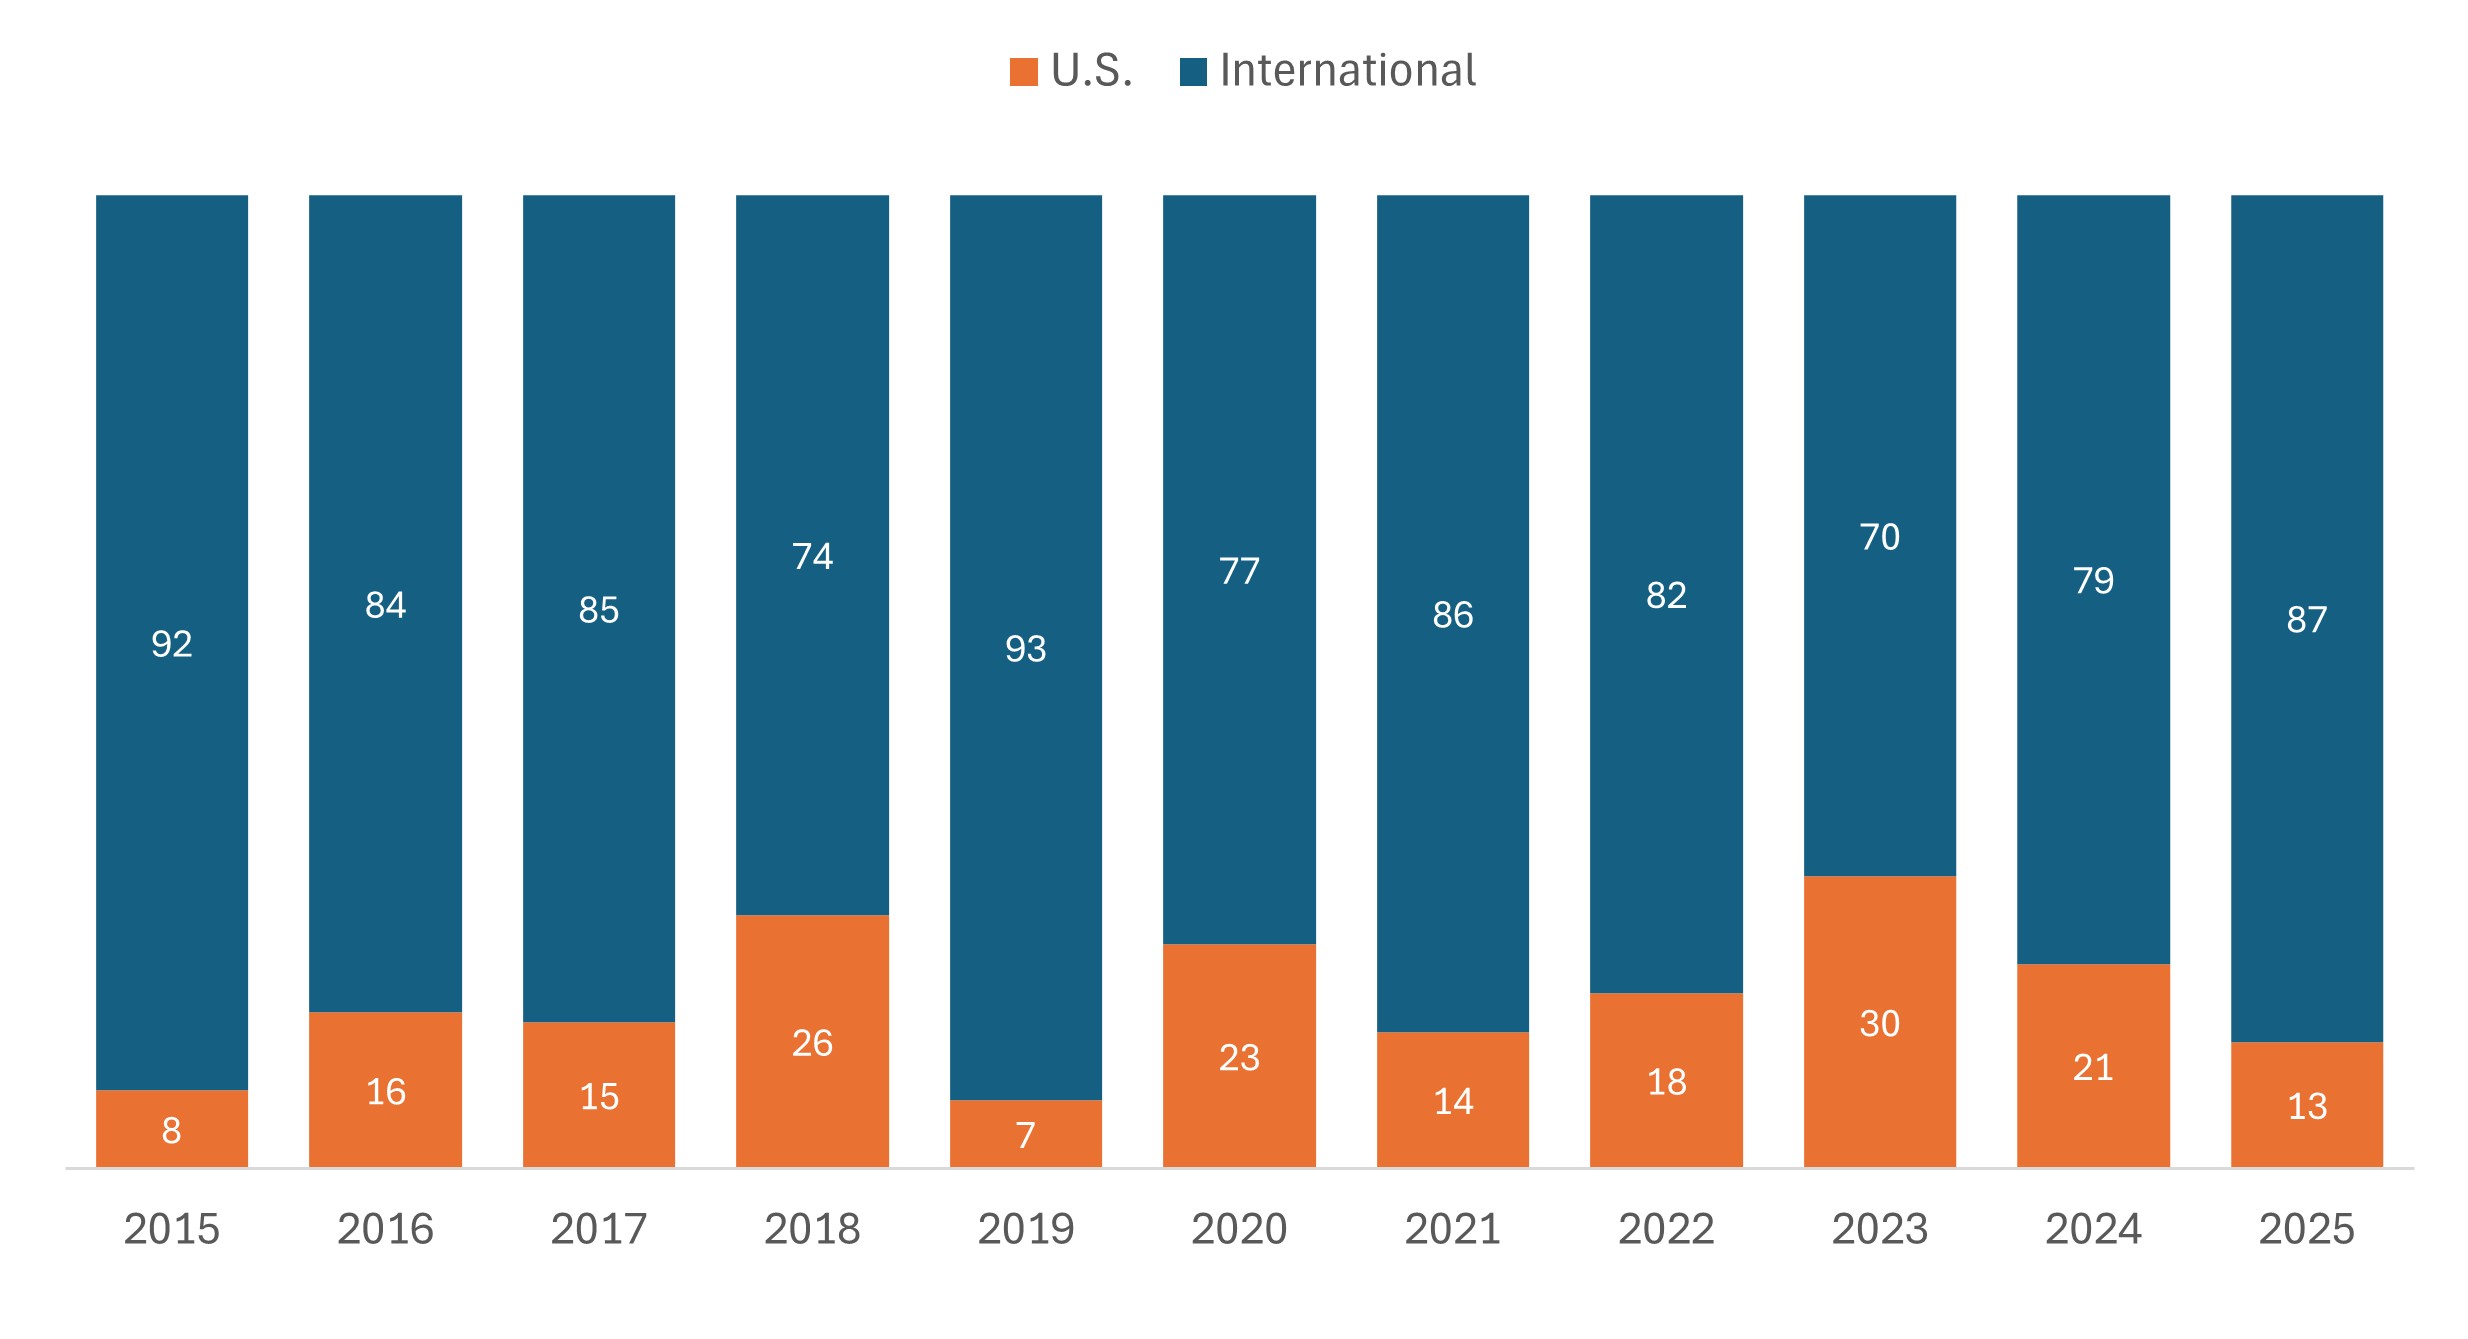 Source: MSCI, Janus Henderson Investors. Data from 31 December 2014 to 31 December 2025. The MSCI ACWI Index captures large- and mid-cap representation across 23 developed markets and 24 emerging markets countries. Past performance is no guarantee of future results.
 Finally, while valuations have risen following last year’s strong performance, international stocks continue to trade at a meaningful discount relative to U.S. equities.
- As of this writing, the MSCI ex USA Index has a forward price-to-earnings (P/E) ratio of 14.1, modestly above its 20-year average of 13.2.
- By comparison, the S&P 500 trades at 20.9 times forward earnings, or roughly 27% above its long-term average of 16.5.2
In our view, the combination of lower relative valuations, broader sector exposure, and underappreciated company fundamentals creates an attractive environment for active stock selection.
International stocks continue to trade at a deep discount relative to U.S. peers
Relative price-to-earnings (P/E) ratio of the MSCI ACWI ex USA Index to the S&P 500 Index
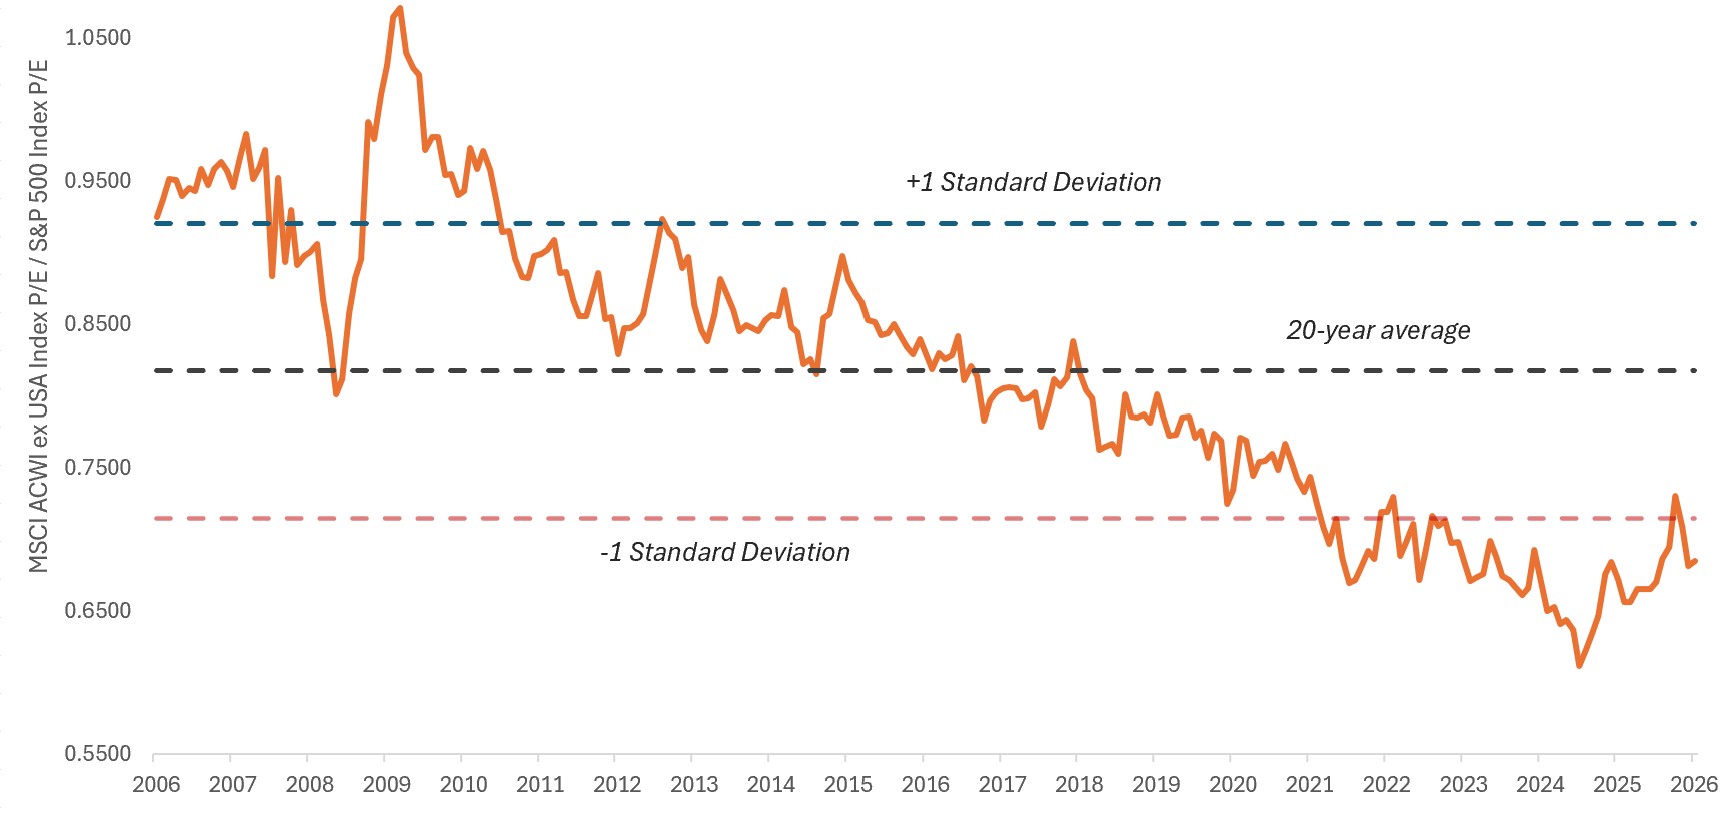
Source: Bloomberg, data from 6 May 2006 to 6 May 2026. P/Es are based on forward, 12-month estimated earnings.
Risk considerations
While we remain positive on the long-term fundamentals supporting international equities, the macroeconomic environment remains unsettled. In the months ahead, countries more exposed to energy and supply chain disruptions stemming from the Middle East conflict will be contending with the dual threat of rising inflation and potential knock-on effects to demand and the outlook for growth, making selectivity all the more critical.
That said, volatility can create opportunities for discerning investors. In our view, the diversity of geographies, demographics, policy regimes, and industry exposures across international markets, combined with meaningfully greater dispersion in returns than in U.S. equities, creates a favorable environment for bottom‑up stock selection informed by deep fundamental research and regional expertise.
Against this backdrop, we believe international equities can continue to play an important role as a counterweight to U.S. equity exposure. In our view, investors are likely to be rewarded for maintaining a disciplined approach focused on companies with differentiated capabilities and durable free cash flow growth that is not yet fully appreciated by the market.
1 Source: Bloomberg. Data represents total returns.
2 Source: Bloomberg, data as of 6 May 2006 to 6 May 2026.
Free cash flow (FCF) yield is a financial ratio that measures how much cash flow a company has in case of its liquidation or other obligations by comparing the free cash flow per share with the market price per share and indicates the level of cash flow the company will earn against its share market value.
MSCI ACWI Index captures large- and mid-cap representation across 23 developed markets and 24 emerging markets countries.
MSCI ACWI ex USA Index captures large- and mid-cap representation across 22 of 23 developed markets countries and 24 emerging markets countries (excluding the U.S.).
Price-to-Earnings (P/E) Ratio measures share price compared to earnings per share for a stock or stocks in a portfolio.
Return on Equity (ROE) is the measure of a company’s annual return (net income) divided by the value of its total shareholders’ equity, expressed as a percentage. The number represents the total return on equity capital i.e., the profits made for each dollar from shareholders’ equity.
S&P 500® Index reflects U.S. large-cap equity performance and represents broad U.S. equity market performance.
Volatility measures risk using the dispersion of returns for a given investment.
IMPORTANT INFORMATION
Aerospace and defense industries can be significantly affected by changes in the economy, fuel prices, labor relations, and government regulation and spending.
Actively managed investment portfolios are subject to the risk that the investment strategies and research process employed may fail to produce the intended results. Accordingly, a portfolio may underperform its benchmark index or other investment products with similar investment objectives.
Artificial intelligence (“AI”) focused companies, including those that develop or utilize AI technologies, may face rapid product obsolescence, intense competition, and increased regulatory scrutiny. These companies often rely heavily on intellectual property, invest significantly in research and development, and depend on maintaining and growing consumer demand. Their securities may be more volatile than those of companies offering more established technologies and may be affected by risks tied to the use of AI in business operations, including legal liability or reputational harm.
Diversification neither assures a profit nor eliminates the risk of experiencing investment losses.
Equity securities are subject to risks including market risk. Returns will fluctuate in response to issuer, political and economic developments.
Financials industries can be significantly affected by extensive government regulation, subject to relatively rapid change due to increasingly blurred distinctions between service segments, and significantly affected by availability and cost of capital funds, changes in interest rates, the rate of corporate and consumer debt defaults, and price competition.
Foreign securities are subject to additional risks including currency fluctuations, political and economic uncertainty, increased volatility, lower liquidity and differing financial and information reporting standards, all of which are magnified in emerging markets.
Technology industries can be significantly affected by obsolescence of existing technology, short product cycles, falling prices and profits, competition from new market entrants, and general economic conditions. A concentrated investment in a single industry could be more volatile than the performance of less concentrated investments and the market as a whole.
These are the views of the author at the time of publication and may differ from the views of other individuals/teams at Janus Henderson Investors. References made to individual securities do not constitute a recommendation to buy, sell or hold any security, investment strategy or market sector, and should not be assumed to be profitable. Janus Henderson Investors, its affiliated advisor, or its employees, may have a position in the securities mentioned.
Past performance does not predict future returns. The value of an investment and the income from it can fall as well as rise and you may not get back the amount originally invested.
The information in this article does not qualify as an investment recommendation.
There is no guarantee that past trends will continue, or forecasts will be realised.
Marketing Communication.
Important information
Please read the following important information regarding funds related to this article.
- Shares/Units can lose value rapidly, and typically involve higher risks than bonds or money market instruments. The value of your investment may fall as a result.
- Emerging markets expose the Fund to higher volatility and greater risk of loss than developed markets; they are susceptible to adverse political and economic events, and may be less well regulated with less robust custody and settlement procedures.
- The Fund may use derivatives with the aim of reducing risk or managing the portfolio more efficiently. However this introduces other risks, in particular, that a derivative counterparty may not meet its contractual obligations.
- If the Fund holds assets in currencies other than the base currency of the Fund, or you invest in a share/unit class of a different currency to the Fund (unless hedged, i.e. mitigated by taking an offsetting position in a related security), the value of your investment may be impacted by changes in exchange rates.
- When the Fund, or a share/unit class, seeks to mitigate exchange rate movements of a currency relative to the base currency (hedge), the hedging strategy itself may positively or negatively impact the value of the Fund due to differences in short-term interest rates between the currencies.
- Securities within the Fund could become hard to value or to sell at a desired time and price, especially in extreme market conditions when asset prices may be falling, increasing the risk of investment losses.
- The Fund could lose money if a counterparty with which the Fund trades becomes unwilling or unable to meet its obligations, or as a result of failure or delay in operational processes or the failure of a third party provider.