
Key takeaways:
- Historically bond yields have provided a reasonably strong indicator of future returns, with investment grade corporate bond returns the most correlated to yield.
- Over a longer period, the forecasting power appears to be more accurate, potentially reflective of a smoothing of economic conditions.
- Yield can be a valuable indicator to help drive decisions on portfolio constituents but should not be looked at in isolation – investors need to pay attention to market conditions, economic trends and credit quality.
Have you ever wondered if the yield on a bond today can indicate how much money you will make in the future? After all, income is typically viewed as the principal driver of returns for bonds but how does that maxim square when put to the test? With bond yields looking attractive right now, we decided to analyse whether they are a reliable guide for predicting returns over the short term (1 year) and over a longer holding period (5 years) for US and European investment grade (IG) and high yield (HY) bonds.
What are yields and spreads today?
The following chart shows where corporate bond yields and credit spreads are today. Yields reflect the expected annual return from the bond while spreads are the difference in yield between a corporate bond and a government bond of similar maturity. You can think of spread as being the additional compensation the market is demanding to take on the credit risk of holding corporate bonds. i.e. the risk that the company may be unable to meet their debt repayments.
In Figure 1 we show yields and spreads with their axes aligned. Note that 100 basis points is equivalent to 1%. Aligning the axes helps demonstrate that around one percentage point of the yield on investment grade bonds is made up of spread while more than three percentage points of the yield on high yield bonds is spread i.e. additional to what you would receive if you held equivalent government bonds.
Figure 1: Yields and spreads
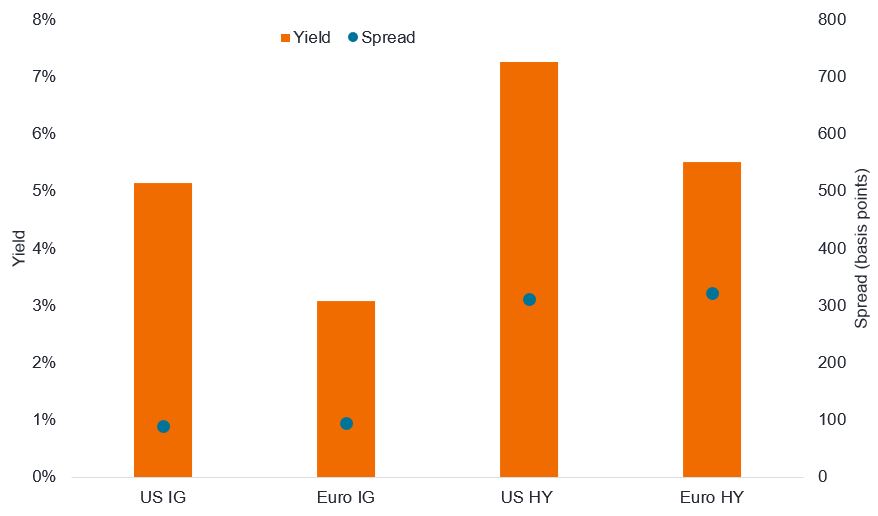
Source: Bloomberg, ICE BofA US Corporate Index (US IG); ICE BofA Euro Corporate Index (Euro IG); ICE BofA US High Yield Index (US HY); ICE BofA Euro High Yield Index (Euro HY); yield to worst, spread, 23 June 2025. Basis point (bp) equals 1/100 of a percentage point, 1bp = 0.01%. Yields may vary over time and are not guaranteed.
These yields sound tempting – they are certainly well above the average of the last 15 years – but do they mean you will get good returns? Let’s see what history tells us.
Are yields good at predicting returns?
Yields are like a weather forecast for bonds—they’re better at predicting the long-term outlook (5 years) than the short-term (1 year). By that we mean, a summer day is likely to be warm on average but narrow the number of days and it becomes less certain whether it will be sunny or raining. Here is the scoop:
- Euro IG bonds are the best at following this rule, with a strong connection (0.87 correlation) between starting yields and 5-year returns. This means the yield today has historically offered a good indication of what you could earn over time.
- US IG bonds (0.81) and US HY bonds (0.77) also show a solid link for 5-year returns.
- Euro HY bonds are less predictable (0.65 for 5 years and only 0.35 for 1 year). This may be partly explained by the relatively low government bond yields in Europe over the last decade which made Euro high yield more sensitive to changing credit conditions.
| Figure 2: Correlation between yields and forward total returns | ||
|---|---|---|
| Index | 1 year | 5 year |
| US IG | 0.50 | 0.81 |
| EUR IG | 0.53 | 0.87 |
| US HY | 0.46 | 0.77 |
| EUR HY | 0.35 | 0.65 |
Source: Bloomberg, indices as per Figure 1. A correlation of +1 means that both variables have a strong association – the closer to 1 the stronger the link between yield and forward returns. Past performance does not predict future returns.
For short-term (1-year) returns, yields are less reliable across all bonds. This is because over one year there is less of a smoothing effect, so bond returns are more impacted by the immediate interest rate or economic environment. This tends to be more true for high yield bonds that carry greater credit sensitivity.
What returns might be expected?
We can look at the historical data and display the starting yield ranges against the subsequent one-year and five-year total returns (TR). This is called “forward total return”, which includes both the income and any price changes.
| Figure 3: Euro Investment Grade (IG) average forward total returns (annualised) | ||
|---|---|---|
| Yield range | 1 year (%) | 5 year (%) |
| 0.0 – 0.5% | -5.4 | -0.5 |
| 0.5 – 1.0% | 0.4 | -0.1 |
| 1.0 – 1.5% | 3.2 | 1.6 |
| 1.5 – 2.0% | 4.8 | 2.9 |
| 2.0 – 2.5% | 3.8 | 3.7 |
| 2.5 – 3.0% | 4.8 | 4.8 |
| 3.0 – 4.0% | 4.0 | 4.6 |
| 4.0 – 5.0% | 5.1 | 5.1 |
| 5.0 – 6.0% | 6.9 | 6.9 |
| 6.0%+ | 10.1 | 8.1 |
Source: Bloomberg, ICE BofA Euro Corporate Index, 31 December 1995 to 31 May 2025, yield to worst, total returns in Euro, monthly datapoints. An annualised figure is adjusted to represent return over one year, rather than a shorter or longer period. It allows comparisons to be made between returns over time periods of different length. Past performance does not predict future returns.
With Euro IG yielding 3.08% today, you could expect around 4-5% returns per year over 5 years, based on past trends.
| Figure 4: Euro High Yield (HY) average forward total returns (annualised) | ||
|---|---|---|
| Yield range | 1 year (%) | 5 year (%) |
| 2.0 – 2.5% | -4.5 | 0.2 |
| 2.5 – 3.0% | -1.5 | 1.9 |
| 3.0 – 3.5% | 2.0 | 2.8 |
| 3.5 – 4.0% | 3.3 | 3.5 |
| 4.0 – 4.5% | 4.6 | 4.6 |
| 4.5 – 5.0% | 8.0 | 4.5 |
| 5.0 – 5.5% | 9.3 | 6.3 |
| 5.5 – 6.0% | 9.5 | 6.3 |
| 6.0 – 6.5% | 4.8 | 6.6 |
| 6.5 – 7.0% | 7.0 | 7.1 |
| 7.0 – 8.0% | 8.2 | 7.3 |
| 8.0 – 9.0% | 13.1 | 10.0 |
| 9.0 – 10.0% | 1.8 | 6.3 |
| 10.0%+ | 8.4 | 10.4 |
Source: Bloomberg, ICE BofA Euro High Yield Index, 31 December 1997 to 31 May 2025, yield to worst, total returns in Euro, monthly datapoints. Past performance does not predict future returns.
Euro HY’s 5.52% yield today suggests strong 5-year returns, possibly around 6-7% per year, but 1-year returns could be bumpier.
| Figure 5: US Investment Grade (IG) average forward total returns (annualised) | ||
|---|---|---|
| Yield range | 1 year (%) | 5 year (%) |
| 1.5 – 2.0% | -2.0 | n/a |
| 2.0 – 2.5% | -7.3 | 0.3 |
| 2.5 – 3.0% | 2.0 | 3.3 |
| 3.0 – 3.5% | 4.1 | 3.8 |
| 3.5 – 4.0% | 7.4 | 4.4 |
| 4.0 – 4.5% | 7.0 | 3.9 |
| 4.5 – 5.0% | 4.8 | 4.8 |
| 5.0 – 6.0% | 4.0 | 7.5 |
| 6.0 – 7.0% | 6.5 | 7.9 |
| 7.0%+ | 13.3 | 9.6 |
Source: Bloomberg, ICE BofA US Corporate Index, 31 October 1994 to 31 May 2025, yield to worst, total returns in US dollar, monthly datapoints. Past performance does not predict future returns.
US IG’s 5.14% yield today points to about 5-7.5% annualised returns over 5 years.
| Figure 6: US High Yield (HY) average forward total returns (annualised) | ||
|---|---|---|
| Yield range | 1 year (%) | 5 year (%) |
| 4.5 – 5.0% | -1.7 | n/a |
| 5.0 – 5.5% | 3.0 | 4.5 |
| 5.5 – 6.0% | 3.3 | 4.5 |
| 6.0 – 6.5% | 3.6 | 5.1 |
| 6.5 – 7.0% | 7.1 | 5.9 |
| 7.0 – 8.0% | 6.8 | 6.7 |
| 8.0 – 9.0% | 9.2 | 7.7 |
| 9.0 – 10.0% | 9.6 | 10.1 |
| 10.0%+ | 9.3 | 12.0 |
Source: Bloomberg, ICE BofA US High Yield Index, 31 December 1997 to 31 May 2025, yield to worst, total returns in US dollar, monthly datapoints. Past performance does not predict future returns.
US HY’s 7.27% yield today could mean 6-7% returns per year over 5 years.
Today’s yield quoted after each table reflects the yield to worst on 23 June 2025. Please note that yields may vary over time and are not guaranteed.
The bottom line
The big takeaway? Yields are a better guide for 5-year returns than 1-year returns. If you are patient and can hold bonds for 5 years, today’s yields – especially for US HY (7.10%) and US IG (5.18%) – look promising. But short-term returns can be unpredictable, especially for riskier high-yield bonds.
While yields are a helpful starting point, they are not the whole story. Keep an eye on:
- Market conditions: Are interest rates rising or falling? We need to be mindful that the historical period covered from the mid-1990s to today included a general decline in yields and interest rates, which partly contributed to total returns often being above starting yield levels because bond prices rise when yields fall.
- Credit quality: Are the bonds you are buying safe or risky? Any defaults could diminish the return you get from a portfolio of bonds.
- Economic trends: Is the economy stable or shaky? Stable economic growth is supportive of corporate cash flows, which helps companies meet their debt repayments. Conversely, economic weakness could put stress on some companies, particularly more indebted, high yield borrowers.
Taken together, today’s bond yields can potentially signal what to expect in terms of forward returns, especially over 5 years. Euro IG and US bonds look particularly attractive for long-term investors. High-yield bonds can offer bigger rewards but come with more volatility. By combining yield information with a smart look at the market, you can make better choices for your bond portfolio.
Fixed income securities are subject to interest rate, inflation, credit and default risk. The bond market is volatile. As interest rates rise, bond prices usually fall, and vice versa. The return of principal is not guaranteed, and prices may decline if an issuer fails to make timely payments or its credit strength weakens.
High-yield or “junk” bonds involve a greater risk of default and price volatility and can experience sudden and sharp price swings.
ICE BofA Euro Corporate Index tracks the performance of EUR denominated investment grade corporate debt publicly issued in the Eurobond or Euro member domestic markets.
ICE BofA Euro High Yield Index tracks the performance of EUR denominated below investment grade corporate debt publicly issued in the euro domestic or Eurobond markets.
ICE BofA US Corporate Index tracks the performance of US dollar denominated investment grade corporate debt publicly issued in the US domestic market.
ICE BofA US High Yield Index tracks the performance of US dollar denominated below investment grade corporate debt publicly issued in the US domestic market.
Basis points: Basis point (bp) equals 1/100 of a percentage point, 1bp = 0.01%.
Corporate bond: A bond issued by a company. Bonds offer a return to investors in the form of periodic payments and the eventual return of the original money invested at issue on the maturity date.
Coupon: A regular interest payment that is paid on a bond, described as a percentage of the face value of an investment. For example, if a bond has a face value of $100 and a 5% annual coupon, the bond will pay $5 a year in interest.
Credit rating: A score given by a credit rating agency such as S&P Global Ratings, Moody’s and Fitch on the creditworthiness of a borrower. For example, S&P (Moody’s) ranks investment grade bonds from the highest AAA (Aaa) down to BBB (Baa3) and high yields bonds from BB (Ba1) through B (B1) down to CCC (Caa1) in terms of declining quality and greater risk, i.e. CCC rated borrowers carry a greater risk of default.
Credit spread: The difference in yield between securities with similar maturity but different credit quality. Widening spreads generally indicate deteriorating creditworthiness of corporate borrowers, and narrowing indicate improving.
Default: The failure of a debtor (such as a bond issuer) to pay interest or to return an original amount loaned when due.
High yield bond: Also known as a sub-investment grade bond, or ‘junk’ bond. These bonds usually carry a higher risk of the issuer defaulting on their payments, so they are typically issued with a higher interest rate (coupon) to compensate for the additional risk.
Inflation: The rate at which prices of goods and services are rising in the economy. The Consumer Price Index is a measure of inflation that examines the price change of a basket of consumer goods and services over time.
Investment grade bond: A bond typically issued by governments or companies perceived to have a relatively low risk of defaulting on their payments, reflected in the higher rating given to them by credit ratings agencies.
Issuance: The act of making bonds available to investors by the borrowing (issuing) company, typically through a sale of bonds to the public or financial institutions.
Monetary policy: The policies of a central bank, aimed at influencing the level of inflation and growth in an economy. Monetary policy tools include setting interest rates and controlling the supply of money.
Total return: The combined return from income and any change in capital value of an investment.
Yield: The level of income on a security over a set period, typically expressed as a percentage rate.
Yield to worst: The lowest yield a bond (index) can achieve provided the issuer(s) does not default; it takes into account special features such as call options (that give issuers the right to call back, or redeem, a bond at a specified date).
Volatility measures risk using the dispersion of returns for a given investment. The rate and extent at which the price of a portfolio, security or index moves up and down.
These are the views of the author at the time of publication and may differ from the views of other individuals/teams at Janus Henderson Investors. References made to individual securities do not constitute a recommendation to buy, sell or hold any security, investment strategy or market sector, and should not be assumed to be profitable. Janus Henderson Investors, its affiliated advisor, or its employees, may have a position in the securities mentioned.
Past performance does not predict future returns. The value of an investment and the income from it can fall as well as rise and you may not get back the amount originally invested.
The information in this article does not qualify as an investment recommendation.
There is no guarantee that past trends will continue, or forecasts will be realised.
Marketing Communication.
Important information
Please read the following important information regarding funds related to this article.
- An issuer of a bond (or money market instrument) may become unable or unwilling to pay interest or repay capital to the Fund. If this happens or the market perceives this may happen, the value of the bond will fall.
- When interest rates rise (or fall), the prices of different securities will be affected differently. In particular, bond values generally fall when interest rates rise (or are expected to rise). This risk is typically greater the longer the maturity of a bond investment.
- The Fund invests in high yield (non-investment grade) bonds and while these generally offer higher rates of interest than investment grade bonds, they are more speculative and more sensitive to adverse changes in market conditions.
- Some bonds (callable bonds) allow their issuers the right to repay capital early or to extend the maturity. Issuers may exercise these rights when favourable to them and as a result the value of the Fund may be impacted.
- If a Fund has a high exposure to a particular country or geographical region it carries a higher level of risk than a Fund which is more broadly diversified.
- The Fund may use derivatives to help achieve its investment objective. This can result in leverage (higher levels of debt), which can magnify an investment outcome. Gains or losses to the Fund may therefore be greater than the cost of the derivative. Derivatives also introduce other risks, in particular, that a derivative counterparty may not meet its contractual obligations.
- When the Fund, or a share/unit class, seeks to mitigate exchange rate movements of a currency relative to the base currency (hedge), the hedging strategy itself may positively or negatively impact the value of the Fund due to differences in short-term interest rates between the currencies.
- Securities within the Fund could become hard to value or to sell at a desired time and price, especially in extreme market conditions when asset prices may be falling, increasing the risk of investment losses.
- Some or all of the ongoing charges may be taken from capital, which may erode capital or reduce potential for capital growth.
- The Fund could lose money if a counterparty with which the Fund trades becomes unwilling or unable to meet its obligations, or as a result of failure or delay in operational processes or the failure of a third party provider.
- When interest rates rise (or fall), the prices of different bonds will be affected differently. In particular, bond prices generally fall when interest rates rise or are expected to rise. This is especially true for bonds with a higher sensitivity to interest rate changes. A material portion of the fund may be invested in such bonds (or bond derivatives), so rising interest rates may have a negative impact on fund returns.