
Key takeaways:
- Adding a trend-following allocation to a traditional 60/40 portfolio has historically improved returns and reduced drawdowns, helping portfolios navigate difficult market environments more effectively.
- A key part of Trend’s value comes from its timing. Trend has often delivered some of its strongest returns during the same periods that traditional 60/40 portfolios were under pressure, providing valuable diversification when it is needed most.
- This timing advantage is both measurable and often overlooked. When the sequence of Trend returns is randomised, much of the benefit disappears, highlighting a source of value that traditional portfolio construction tools, which focus mainly on average returns and correlations, can miss.
Trend and the 60/40 portfolio
The 60/40 portfolio – 60% equities, 40% bonds – has been the workhorse of balanced investing for decades. Its appeal rested on a simple idea: when shares fall, high-quality bonds often rise, cushioning the blow. That relationship has become less dependable. In recent years – equities and bonds have, at times, fallen together (such as during 2022), leaving investors with less protection just when they needed it most.
This is where Trend can help.
A trend-following strategy follows the direction of markets rather than predicting them – leaning into assets that are rising and reducing or reversing exposure to those that are falling -across equities, bonds, currencies and commodities. Because it can profit from sustained moves in either direction, it has historically behaved very differently from a long-only stock-and-bond portfolio. In our analysis, blending a modest Trend allocation into a 60/40 portfolio lifted long-run returns and, importantly, made the worst falls shallower. The combined portfolio had a smoother ride. But the most interesting finding is why the ride was smoother – and it turns out the usual explanation is incomplete.
Chart 1: Adding Trend lifted returns and softened the falls
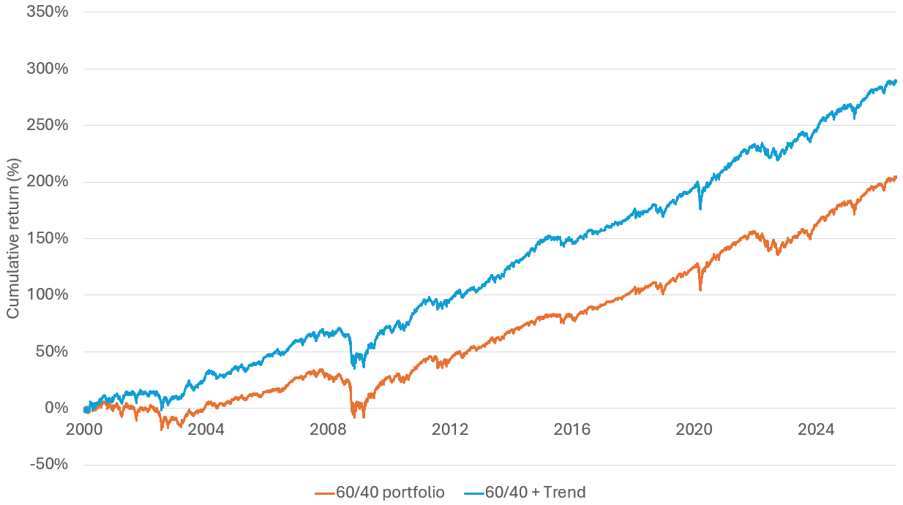
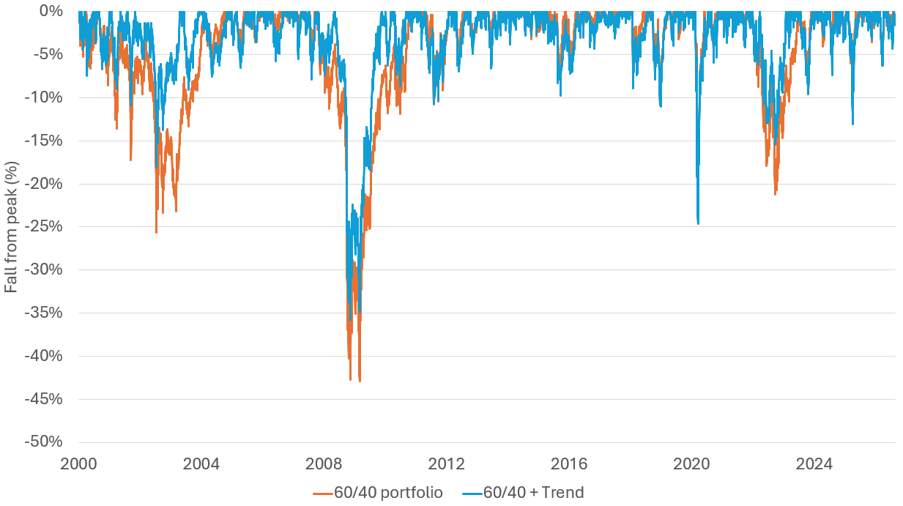
Source: Bloomberg, Janus Henderson Investors, as at 2 September 2026. Past performance does not predict future returns. There is no guarantee that past trends will continue, or forecasts will be realised.
The usual explanation – and what it misses
Ask why a diversifier helps, and the textbook answer is about averages: the asset has a decent average return, and it doesn’t tend to move in step with what you already own. Combine things that don’t rise and fall together, and the bumps partially cancel out. That logic underpins the standard way portfolios are built – a process that decides how much of each asset to hold by looking at average returns, how much each asset typically bounces around, and how closely they tend to move together. Here is the catch. Averages throw away the order in which returns happen. To an average-based approach, an investment that made all its money precisely when a portfolio was suffering looks identical to one that made the same money at completely random times. Same average return, same average relationship – judged the same. For most investments that simplification is harmless. For Trend, we believe it is not – because the timing of Trend’s returns is one of its most valuable features. The rest of this article sets out the evidence.
Chart 2: Trend’s relationship with 60/40 keeps changing – an average hides it
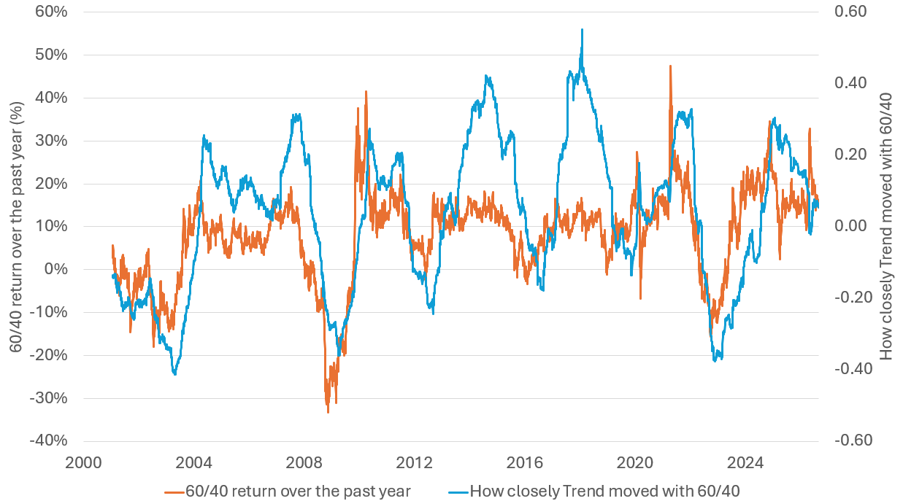
Source: Bloomberg, Janus Henderson Investors, as at 2 September 2026. Past performance does not predict future returns. There is no guarantee that past trends will continue, or forecasts will be realised.
Look at the two lines together and a pattern jumps out: the stretches where 60/40 was losing money (the blue line dipping below zero) line up with the stretches where Trend moved opposite to 60/40 (the orange line dropping below zero). In other words, exactly when a balanced portfolio was struggling, Trend tended to be pulling the other way. That is the diversifying nature of Trend in a single picture. A diversifier is most valuable precisely when it leans against your losses – and here Trend’s relationship with 60/40 turns negative right when you would most want it to. A single average correlation, blurring good times and bad together, would wash this out entirely. It is the strongest early hint that Trend’s real worth as a blending agent comes from its timing, not just its average behaviour.
Trend has tended to pay off in exactly the wrong months for everything else
We can sort history into buckets based on how the 60/40 portfolio performed, from its worst months to its best, and look at how Trend did in each bucket.
The pattern is striking: Trend made its largest gains in the months when the 60/40 portfolio was falling the hardest.
Rather than a hedge that quietly costs you money in good times, Trend was typically profitable across the board – but it was most profitable precisely when a balanced portfolio needed help most. This is the heart of the timing argument, and it echoes the correlation chart above: it is not just that Trend zigs when markets zag; it’s that Trend has tended to deliver its biggest payoffs in the toughest moments.
Chart 3: Trend has paid off most when 60/40 struggled
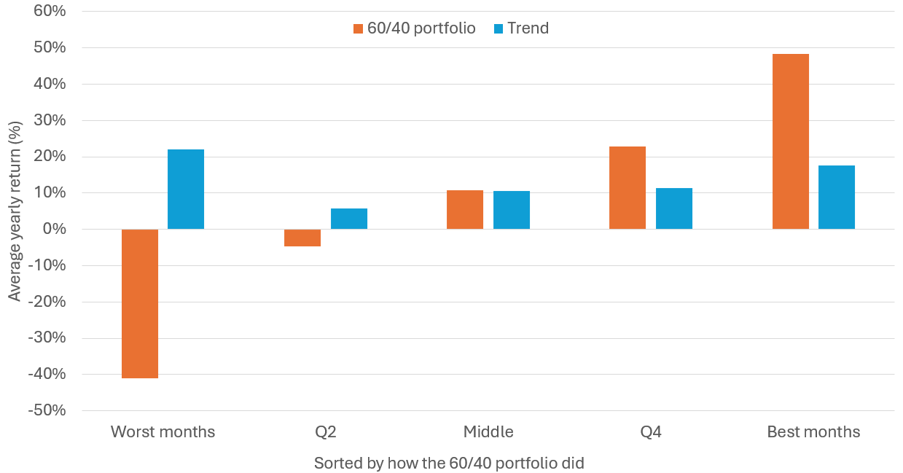
Source: Bloomberg, Janus Henderson Investors, as at 2 September 2026. There is no guarantee that past trends will continue, or forecasts will be realised. Past performance does not predict future returns.
A simple test: Shuffle the timing
The patterns so far are suggestive, but could they simply be a fluke of history? To find out, we ran a deliberate experiment. We took Trend’s monthly returns and shuffled them into a random order, like shuffling a deck of cards. This keeps every single return – the same average, the same ups and downs, the same volatility – but removes the timing factor, i.e. when they happened relative to the rest of the portfolio. If timing didn’t matter, the shuffled version should be just as good a diversifier as the real thing. If timing does matter, the shuffled version should be noticeably worse. We repeated this shuffle many times to be sure we weren’t looking at a fluke, and compared the results to Trend’s actual, real-world track record. Three findings stood out.
- Trend leans in during rallies and steps back during falls
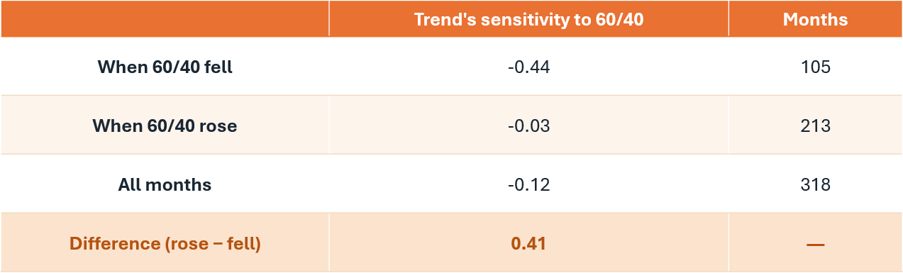
We then measured how closely Trend tracked the 60/40 portfolio, separately, in rising and falling markets. In rising markets, Trend tended to move with the portfolio – participating in the upside. In falling markets, that link weakened or reversed – Trend pulled away from the decline. This “lean in when it’s working, step back when it isn’t” behaviour is the signature of Trend, and it’s the kind of asymmetry that averages alone cannot capture.
Table 1: How much Trend moved for each 1% move in 60/40 — measured separately in
Source: Bloomberg, Janus Henderson Investors, as at 2 September 2026. Past performance does not predict future returns.
A positive number means Trend moved with 60/40; a negative number means it moved against it. Trend’s sensitivity is higher when 60/40 was rising than when it was falling – it leant into the gains and pulled away from the losses. That gap (the bottom row) is the asymmetry an average-based view simply cannot see.
- Good timing made the whole portfolio more predictable
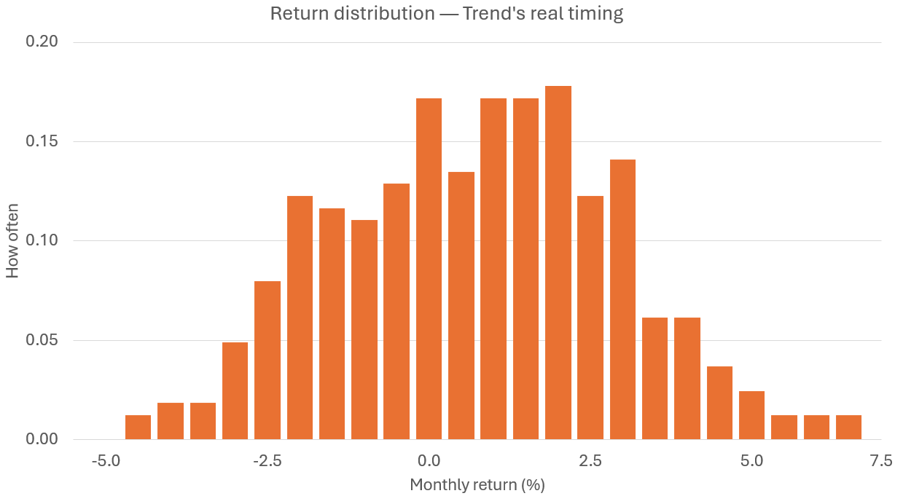
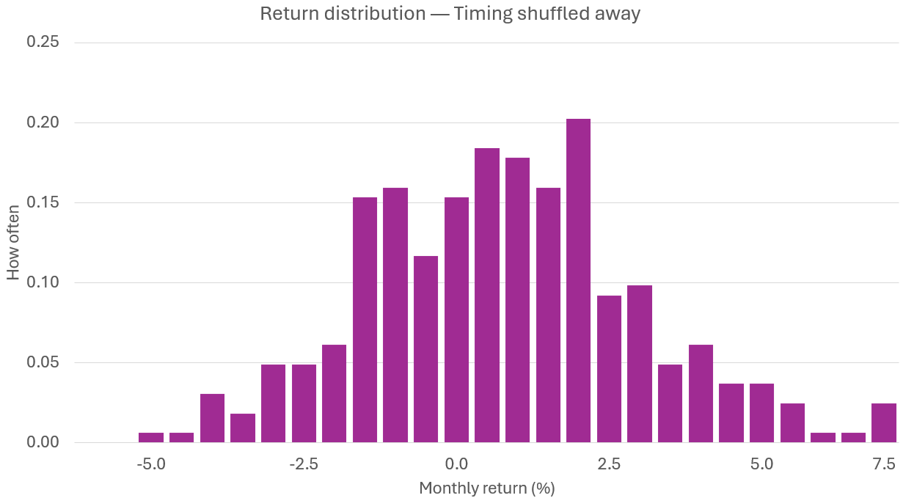
Next, we looked at the shape of the combined portfolio’s monthly returns – with Trend’s real timing versus with the timing shuffled away. With Trend’s actual timing, the portfolio’s returns were more tightly clustered: lower volatility and, crucially, far fewer extreme months at either end. The worst months were less bad – and the wildest swings, up and down, were tamed. Once we shuffled the timing, that calming effect faded. The same returns, in a random order, produced a portfolio with fatter tails and more frequent extreme outcomes. In other words, Trend’s timing wasn’t adding lottery-ticket upside – it was quietly making the portfolio’s journey smoother and more predictable.
Chart 5: Real timing gives a tighter spread with fewer extreme months
Source: Bloomberg, Janus Henderson Investors, as at 2 September 2026. Past performance does not predict future returns.
- The real portfolio avoided drawdowns that random timing did not
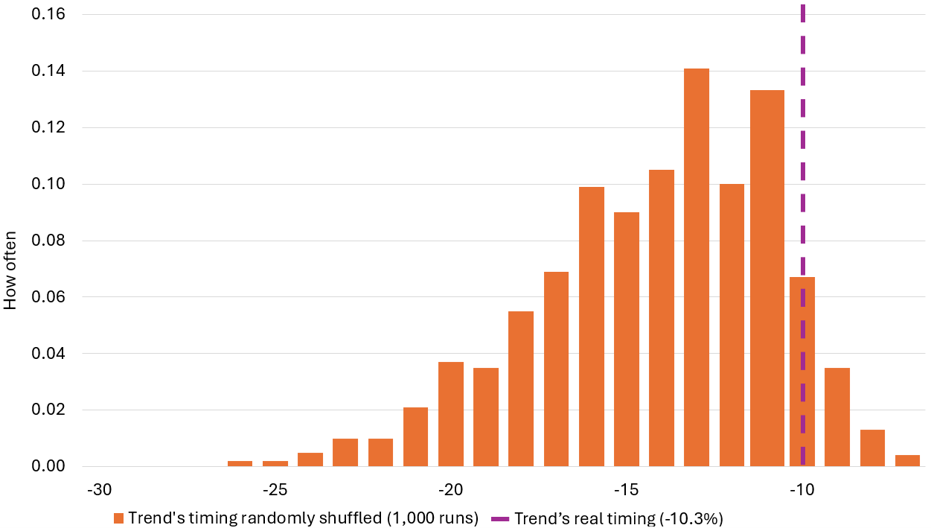
Finally, the acid test for any defensive quality: drawdowns – the peak-to-trough falls that worry investors most. We compared the actual portfolio’s worst drawdown to those produced by a thousand randomly shuffled versions. The real portfolio, with Trend’s genuine timing intact, sat firmly among the best outcomes – shallower drawdowns than the vast majority of the shuffled alternatives. Put simply, if Trend’s good timing were just luck or an accident of the data, the real result would look average. It didn’t. It looked materially better – strong evidence that the timing is a genuine, repeatable feature rather than a statistical mirage.
Chart 6: The real portfolio’s worst fall was among the shallowest
Source: Bloomberg, Janus Henderson Investors, as at 2 September 2026. Past performance does not predict future returns.
Why standard optimisation undersells Trend
Pulling the threads together: we also tested what happens when you give Trend and a 60/40 portfolio the same assumed average return, then ask different tools how much Trend to hold. A standard average-based optimiser barely changed its allocation when we shuffled Trend’s timing – because, by design, it never “saw” the timing in the first place. A tool that pays attention to the path of returns and the depth of drawdowns, by contrast, allocated meaningfully more to Trend when the real timing was present, and recognised the loss when it was scrambled. The lesson for portfolio construction is important: judging Trend on averages alone systematically understates its value. The diversification it offers is partly a timing effect, and timing is invisible to the most common tools.
Conclusion: Timing is the point
In our view, Trend has the potential to earn its place in a portfolio not only for the returns it generates, but for the timing of those returns. Historically, Trend has tended to deliver when balanced portfolios were under the most pressure – cushioning drawdowns and smoothing the overall journey. That benefit is real and measurable, but it hides from the everyday maths of portfolio construction, which leans heavily on averages. Investors and tools that look only at average return and average correlation risk concluding that a little Trend is “enough”, when the evidence suggests its true, timing-aware contribution is larger.
For investors seeking resilience in a less predictable world, that is a distinction worth making. With Trend, when you get paid is a feature, not a footnote.
Asymmetry: A situation where an investment behaves differently in rising markets than in falling markets, often providing a more favourable risk-return profile.
Bond: A debt security issued by governments or companies that typically pays a fixed rate of interest and returns principal at maturity.
Commodity: A physical raw material, such as oil, gold, wheat, or copper, that can be traded in financial markets.
Correlation: A measure of how closely two investments move in relation to each other. Positive correlation means they tend to move together, while negative correlation means they tend to move in opposite directions.
Diversification: The practice of combining different investments or strategies within a portfolio to reduce overall risk.
Diversifier: An investment or strategy that behaves differently from existing portfolio holdings, helping to improve risk-adjusted returns and reduce losses during difficult periods.
Drawdown: The decline in the value of an investment or portfolio from its highest point to its lowest point before recovering.
Equities: Ownership interests in companies, commonly referred to as stocks or shares.
A fat tail is a statistical feature of a data set where extreme, rare events happen more often or carry a much larger impact than a standard bell-curve model predicts.
Hedge: An investment position intended to reduce or offset the risk of losses from another investment.
Returns distribution: The pattern or spread of investment returns over time, showing how frequently different outcomes occur.
Risk-adjusted return: A measure of investment performance that considers both returns and the level of risk taken to achieve them.
Shuffling (Return shuffling test): A statistical technique that randomly rearranges the order of historical returns to test whether the timing of returns contributes to investment outcomes.
Tail risk: The risk of rare but severe investment losses that occur at the extreme ends of a return distribution.
Timing-aware analysis: An analytical approach that considers the sequence and timing of returns, rather than focusing solely on averages and correlations.
Timing effect: The benefit or drawback resulting from when returns occur, rather than simply the size of those returns.
Trend: A systematic investment strategy that seeks to identify and follow persistent price movements across markets, aiming to profit from both rising and falling trends.
Trend-following strategy: An investment approach that buys assets whose prices are rising and reduces, sells, or shorts assets whose prices are falling, based on observed market trends rather than forecasts.
60/40 portfolio: A traditional investment portfolio comprising 60% equities (shares) and 40% bonds, designed to balance growth potential with risk reduction.
Volatility: A statistical measure of the magnitude of price fluctuations experienced by an investment or portfolio over time.
These are the views of the author at the time of publication and may differ from the views of other individuals/teams at Janus Henderson Investors. References made to individual securities do not constitute a recommendation to buy, sell or hold any security, investment strategy or market sector, and should not be assumed to be profitable. Janus Henderson Investors, its affiliated advisor, or its employees, may have a position in the securities mentioned.
Past performance does not predict future returns. The value of an investment and the income from it can fall as well as rise and you may not get back the amount originally invested.
The information in this article does not qualify as an investment recommendation.
There is no guarantee that past trends will continue, or forecasts will be realised.
Marketing Communication.
Important information
Please read the following important information regarding funds related to this article.
- Shares can lose value rapidly, and typically involve higher risks than bonds or money market instruments. The value of your investment may fall as a result.
- An issuer of a bond (or money market instrument) may become unable or unwilling to pay interest or repay capital. If this happens or the market perceives this may happen, the value of the bond will fall. High yielding (non-investment grade) bonds are more speculative and more sensitive to adverse changes in market conditions.
- When interest rates rise (or fall), the prices of different securities will be affected differently. In particular, bond values generally fall when interest rates rise (or are expected to rise). This risk is typically greater the longer the maturity of a bond investment.
- CoCos can fall sharply in value if the financial strength of an issuer weakens and a predetermined trigger event causes the bonds to be converted into shares/units of the issuer or to be partly or wholly written off.
- SPACs are shell companies set up to acquire businesses. They are complex and often lack the transparency of established companies, and therefore present greater risks to investors.
- If the Fund holds assets in currencies other than the base currency of the Fund, or you invest in a share/unit class of a different currency to the Fund (unless hedged, i.e. seeks to mitigate exchange rate movements between the share/unit class currency and the base currency of the Fund), the value of your investment may be impacted by changes in exchange rates.
- Derivatives may be used to help achieve the investment objective. This can result in leverage (higher levels of debt), which can magnify an investment outcome. Gains or losses may therefore be greater than the cost of the derivative. Derivatives also introduce other risks, in particular, that a derivative counterparty may not meet its contractual obligations.
- When the Fund, or a share/unit class, seeks to mitigate exchange rate movements of a currency relative to the base currency (hedge), the hedging strategy itself may positively or negatively impact the value of the Fund due to differences in short-term interest rates between the currencies.
- Securities could become hard to value or to sell at a desired time and price, especially in extreme market conditions when asset prices may be falling, increasing the risk of investment losses.
- The Fund involves a high level of buying and selling activity and as such will incur a higher level of transaction costs than a fund that trades less frequently. These transaction costs are in addition to the Fund's ongoing charges.
- The Fund's exposure to commodities may be subject to rapid and substantial price movements resulting in high volatility. Developments affecting commodities instruments, such as changes in supply and demand, government programs and policies, political events and changes in interest rates may have an impact on the Fund.
- Losses could be incurred if a counterparty became unwilling or unable to meet its obligations, or as a result of failure or delay in operational processes or the failure of a third party provider.