
Key takeaways:
- Given MBS’s impressive performance in 2025, investors may be asking what is in store for 2026. In our view, 2026 is poised for another year of strong performance, with many of the same tailwinds in place that supported returns last year.
- We think fundamentals and technicals are aligning to provide a favorable environment for MBS in 2026. Lower rate volatility, a steeper yield curve, and increased buyer demand has the potential to underpin ongoing strong excess returns for MBS.
- Additionally, agency MBS appears attractive compared to investment-grade corporate credit, while the asset class has historically rewarded nuanced security selection and active convexity management, making it, in our view, a compelling fit for active managers.
A year for the ages
2025 turned out to be a year for the ages for agency mortgage-backed securities (MBS), as the Bloomberg U.S. MBS Index registered its best calendar year of returns since 2002. The benchmark index’s 8.58% total return outperformed every major fixed income sector other than high yield (+8.62%) in 2025.
On an excess return basis, MBS generated 171 basis points (bps) in excess return over U.S. Treasuries.
Several factors contributed to the performance, including a steeper yield curve, wide risk-adjusted spreads to start the year, falling rate volatility, and constructive supply/demand technicals. The back half of 2025 also saw a noticeable uptick in MBS purchases from banks and government-sponsored enterprises (GSE), which helped drive spreads lower.
Given 2025’s impressive performance, investors may be asking what is in store for 2026. In our view, 2026 is poised for another year of strong performance, with many of the same tailwinds in place that supported returns last year.
Key factors that may drive MBS returns in 2026
1. Lower rate volatility
Interest rate volatility typically has a significant impact on MBS spreads. As rate volatility increases, the value of a mortgage holder’s embedded refinancing option also increases, negatively impacting MBS spreads. The inverse also holds true, though: Lower rate volatility results in tighter MBS spreads, all else equal.
When the Federal Reserve (Fed) started raising interest rates in 2022, rate volatility spiked and remained elevated through mid-2025 amid stubborn inflation and uncertainty regarding monetary policy. Once it became clear during the second half of 2025 that the Fed had room to cut rates as inflation risks softened, rate volatility fell sharply, as shown in Exhibit 1.
With inflation continuing to ease and the Fed maintaining a more dovish stance, we think lower rate volatility is likely to persist in 2026.
Exhibit 1: ICE BofA MOVE Index (Jan 2022 – Jan 2026)
Rate volatility normalized in 2025, flipping from a headwind to a tailwind for MBS.
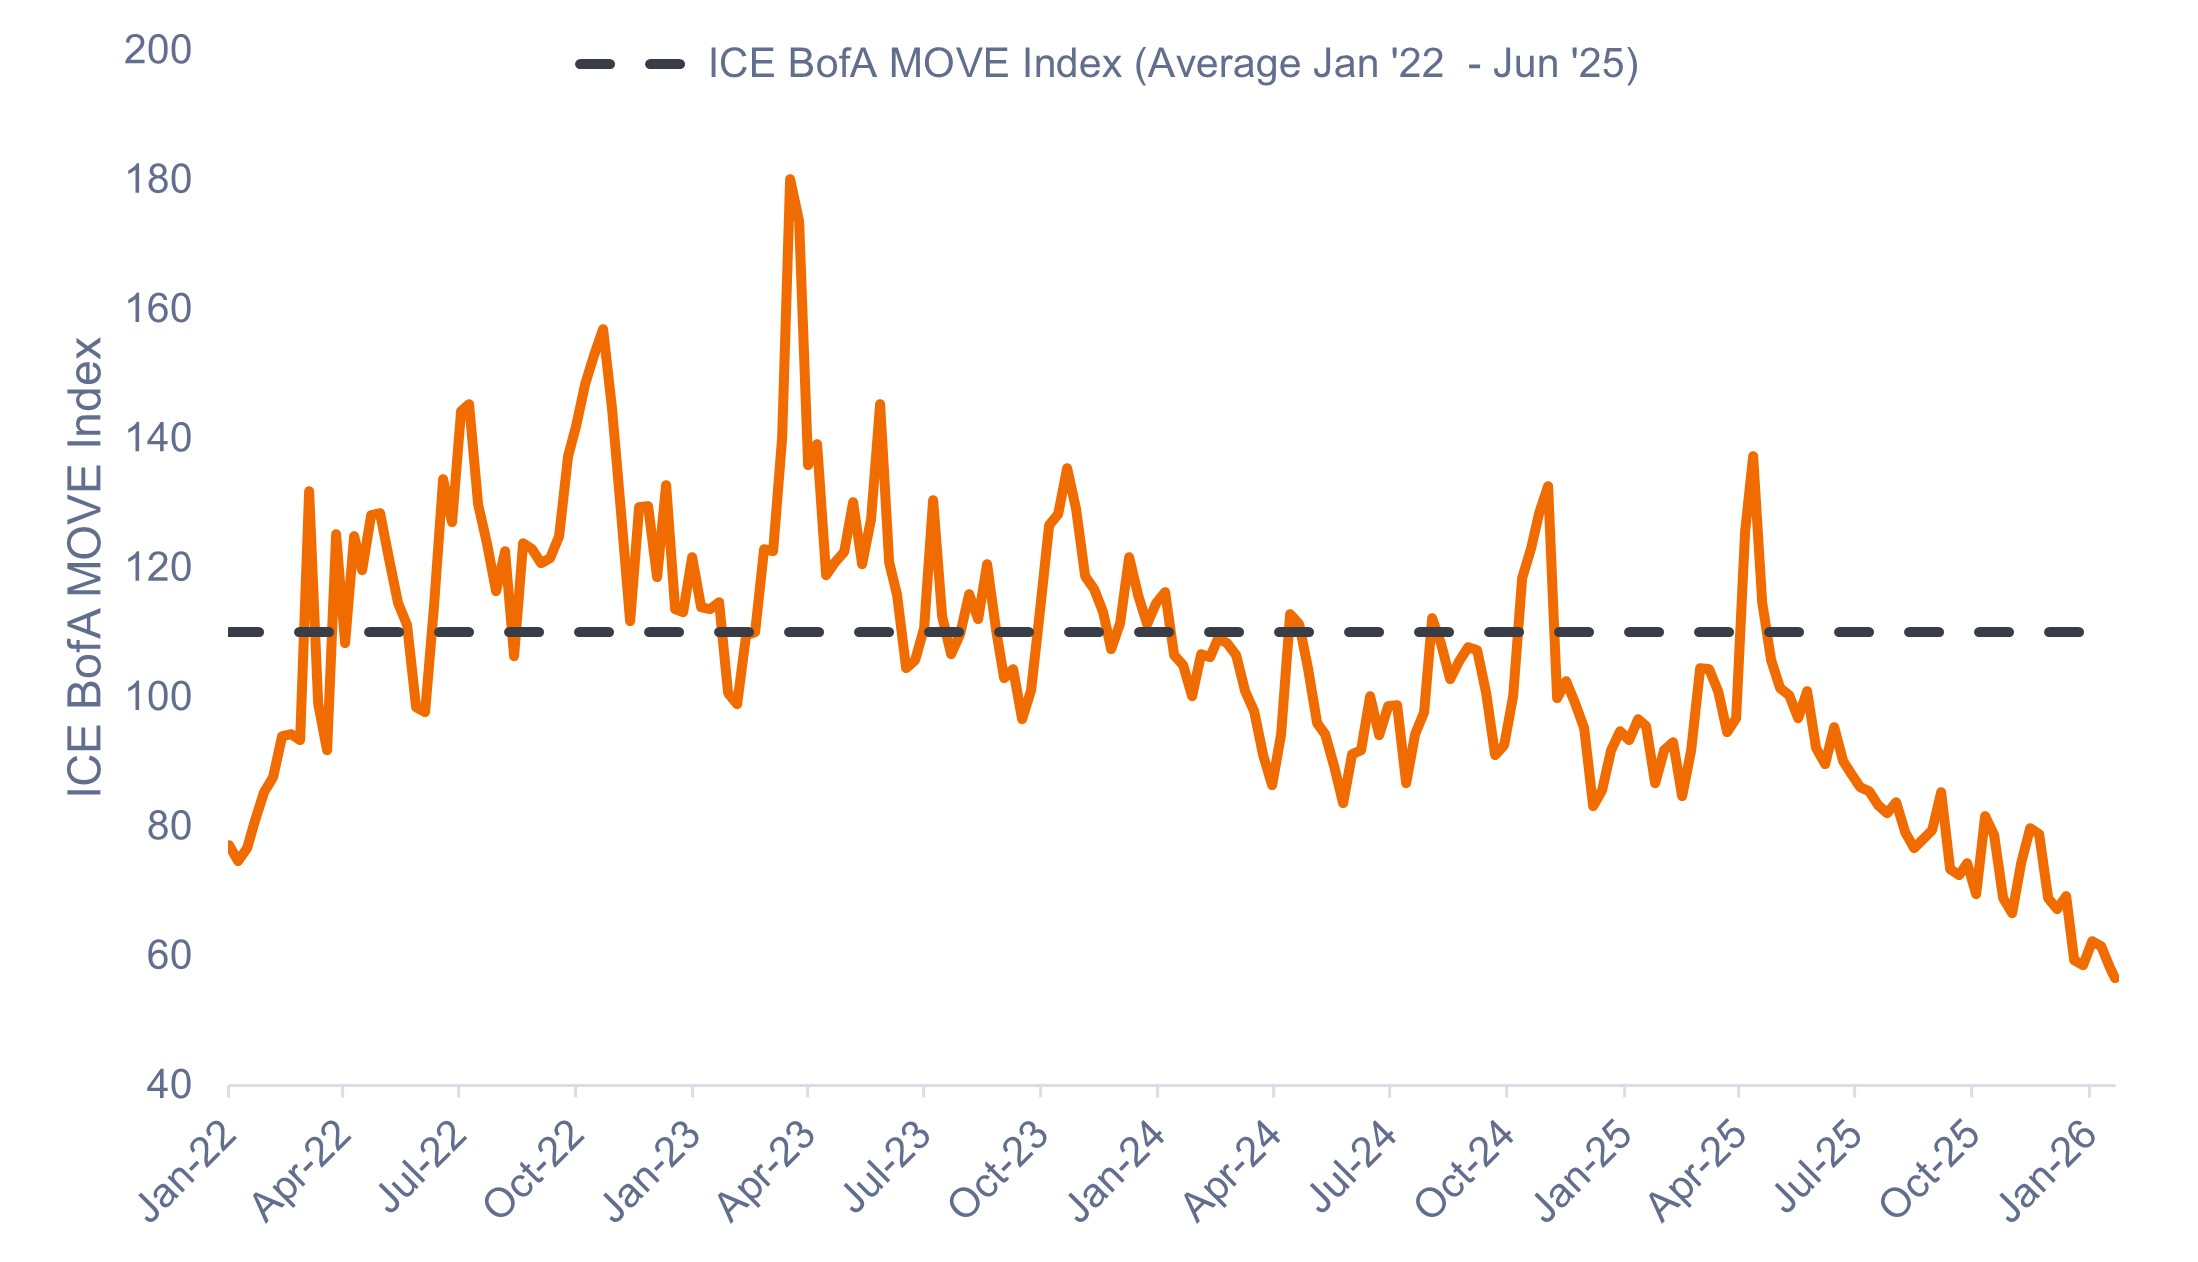
Source: Bloomberg, as of 23 January 2026.
2. A steeper yield curve
A steeper yield curve is generally constructive for MBS returns because it improves both the carry, or income, profile and convexity dynamics of the asset class. The recent re-steepening of the yield curve contributed to returns for MBS in 2025, as shown in Exhibit 2.
We expect the curve to remain steep – and perhaps steepen further – as short-term rates continue their downward trend and term premiums persist due to concerns surrounding Fed independence, large and continued fiscal deficit spending, and potential delayed tariff effects. Higher term premiums also typically lead to more stable prepayment speeds and reduce the risk of a refinancing wave.
Exhibit 2: U.S. Treasury 10-year / 2-year yield spread (Jan 2022 – Jan 2026)
The recent re-steepening of the yield curve has been a tailwind for MBS returns.
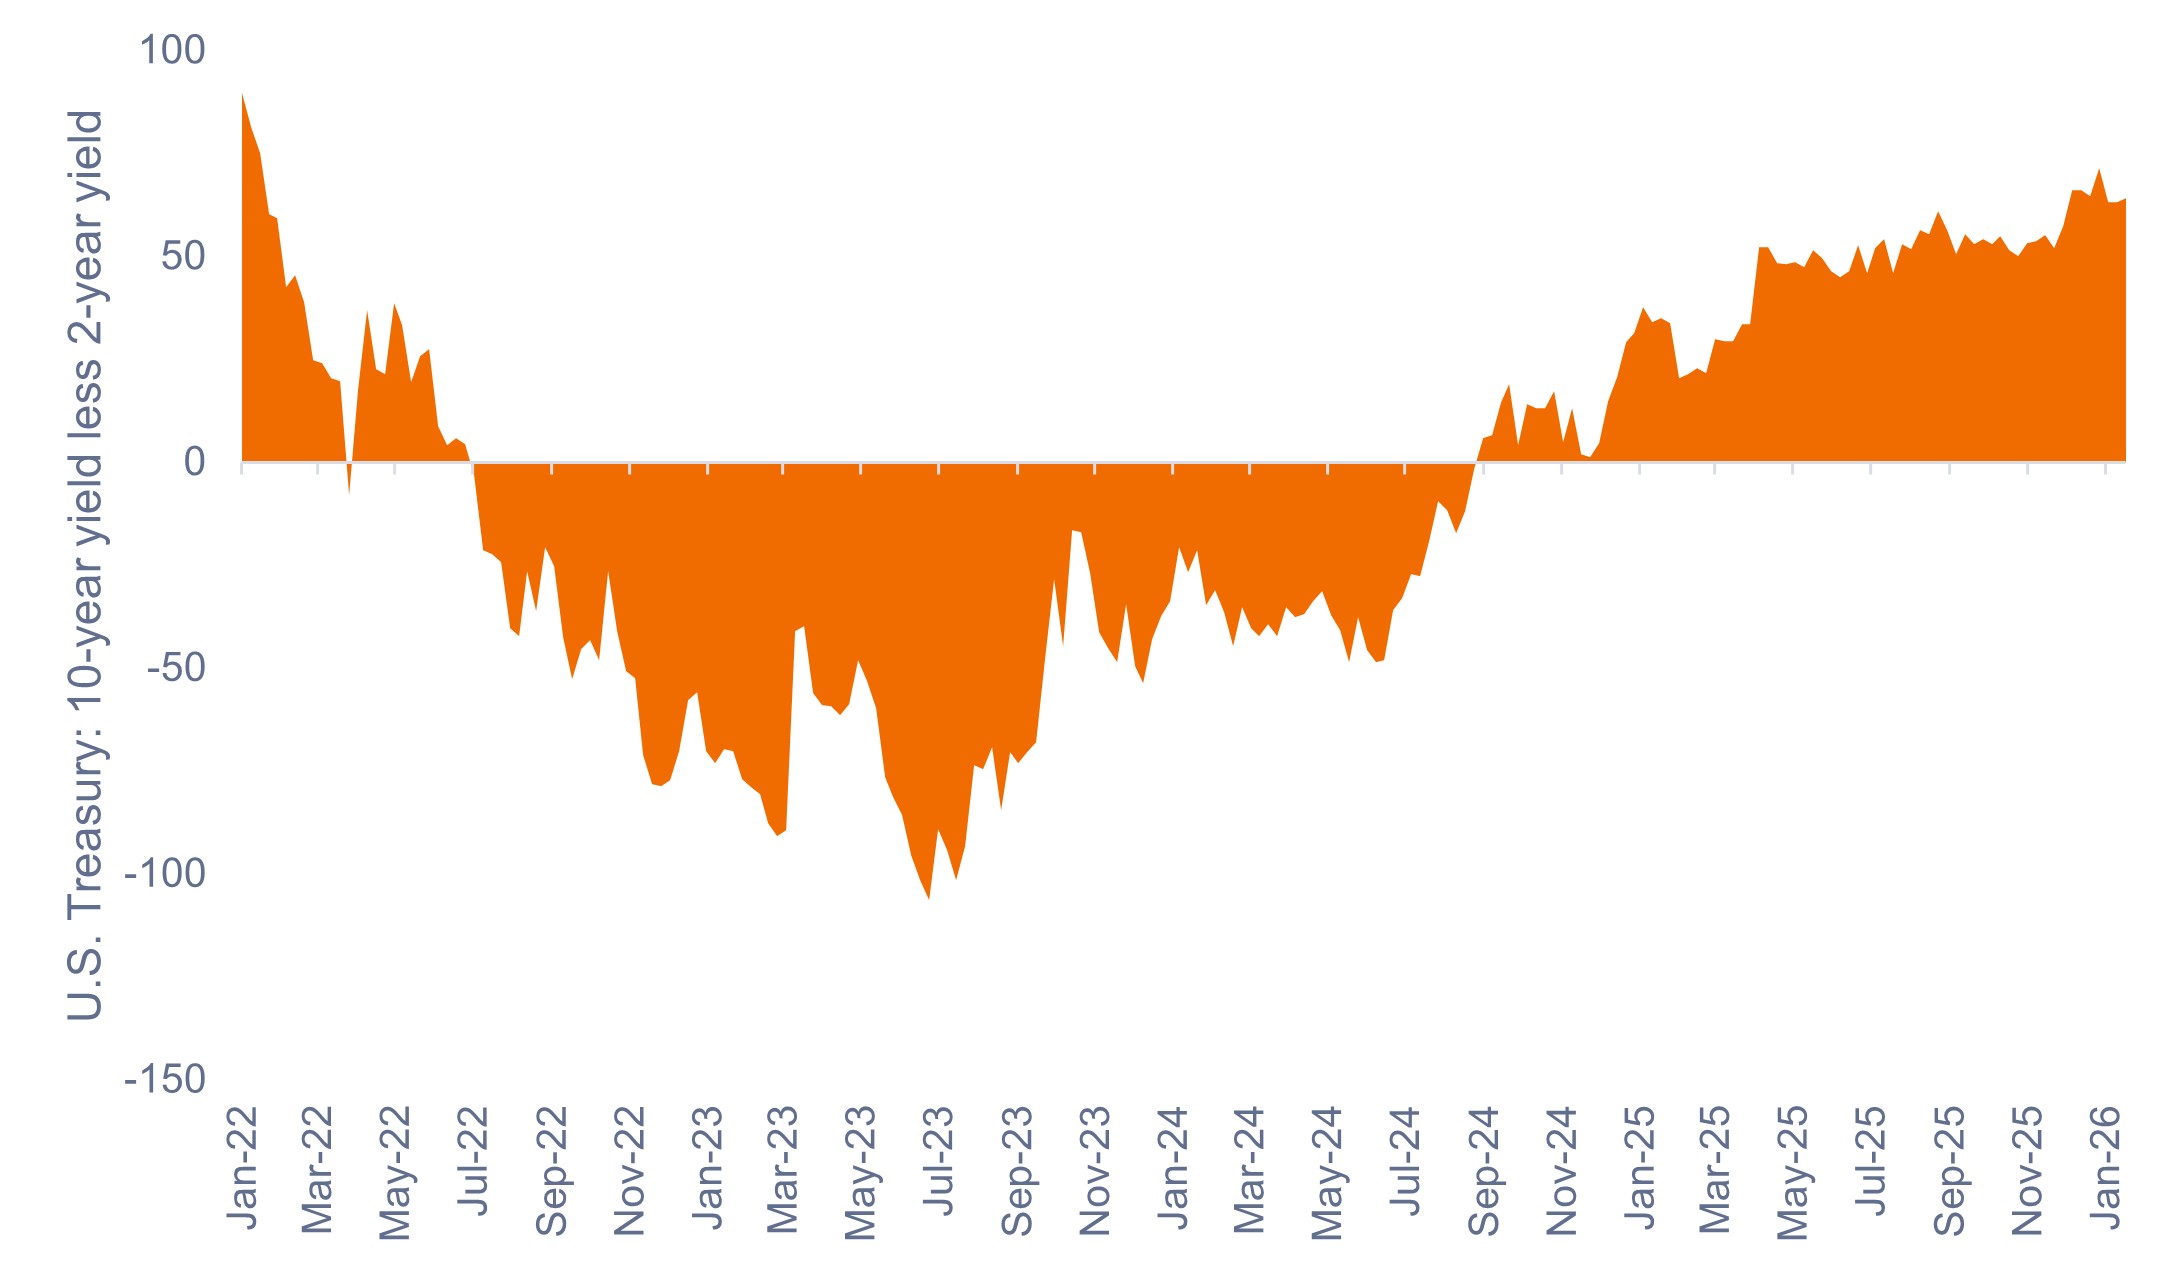
Source: Bloomberg, as of 23 January 2026.
3. Demand for MBS
A significant contributor to recent spread tightening has been increased buying from banks and the GSEs. The GSEs will be active buyers again in 2026 due to the Trump administration’s announcement of $200 billion in MBS purchases to bring down mortgage rates. We also expect an increasing presence from domestic banks.
A steeper yield curve should also attract incremental demand from real estate investment trusts (REITs), as it implies cheap short-term funding and higher asset yields further out on the curve. Lastly, we expect demand from money managers to persist, as positive flows into duration assets may continue their current trajectory.
Until recently, bank demand for MBS has been somewhat tepid relative to expectations. One of the reasons for this has been sluggish deposit growth as higher short-term rates provided better alternatives for depositors. However, short-term rates are being pressured lower by Fed policy, recently announced reserve management purchase operations ($40 billion per month flowing into Treasury bills), and stablecoin legislation enacted last summer.
These developments are positive for deposit growth and net interest margins, which may support increasing MBS demand from banks. Additionally, Federal Reserve Vice Chair for Supervision Michelle Bowman has indicated a softer, more industry-friendly Basel III endgame proposal for early 2026 that implicitly includes room for relief on securitization capital. We view the decision as a net positive that could further boost demand for MBS.
Exhibit 3: Bank demand for MBS (2017-2026)
Demand for MBS from banks is expected to continue its recent improvement.
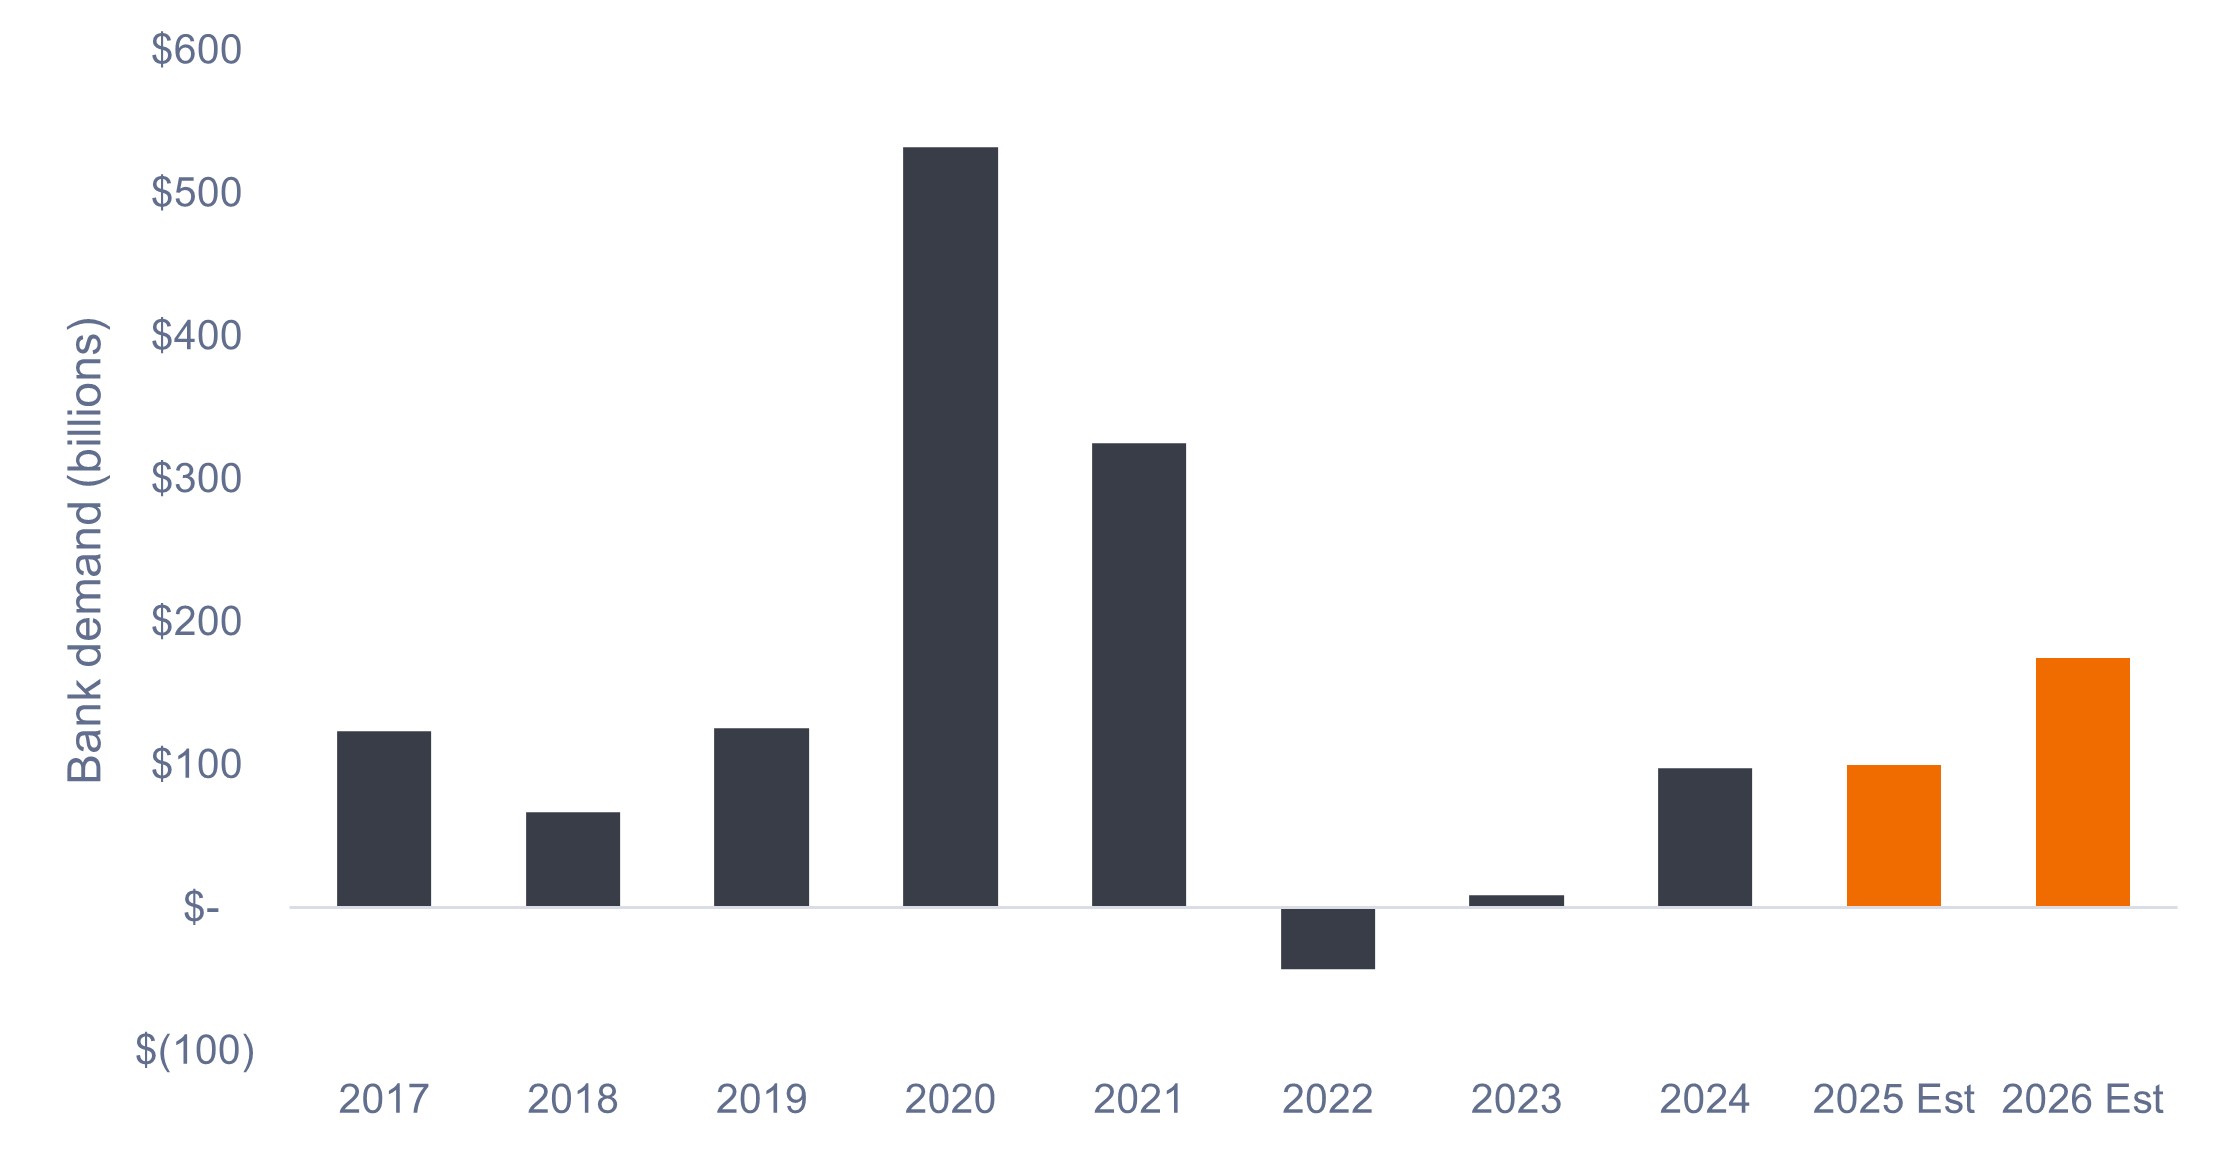
Source: Janus Henderson Investors, Morgan Stanley, as of 31 December 2025. Forecasts are not guaranteed.
4. Relative value opportunities
Although MBS spreads narrowed in 2025, we believe they remain attractive relative to investment-grade (IG) corporate credit. Furthermore, we expect net IG corporate supply to increase significantly in 2026, largely driven by artificial intelligence (AI) infrastructure funding needs.
While MBS net supply should be similar to 2025, increased demand from banks and a large “new” buyer in the GSEs materially helps the supply-demand picture, which should be constructive for MBS spreads versus IG corporates.
Exhibit 4: MBS current coupon (CC) spreads over investment-grade (IG) corporate spreads (Dec 2021 – Dec 2025)
MBS CC excess spread over IG corporates provides a compelling relative value opportunity.
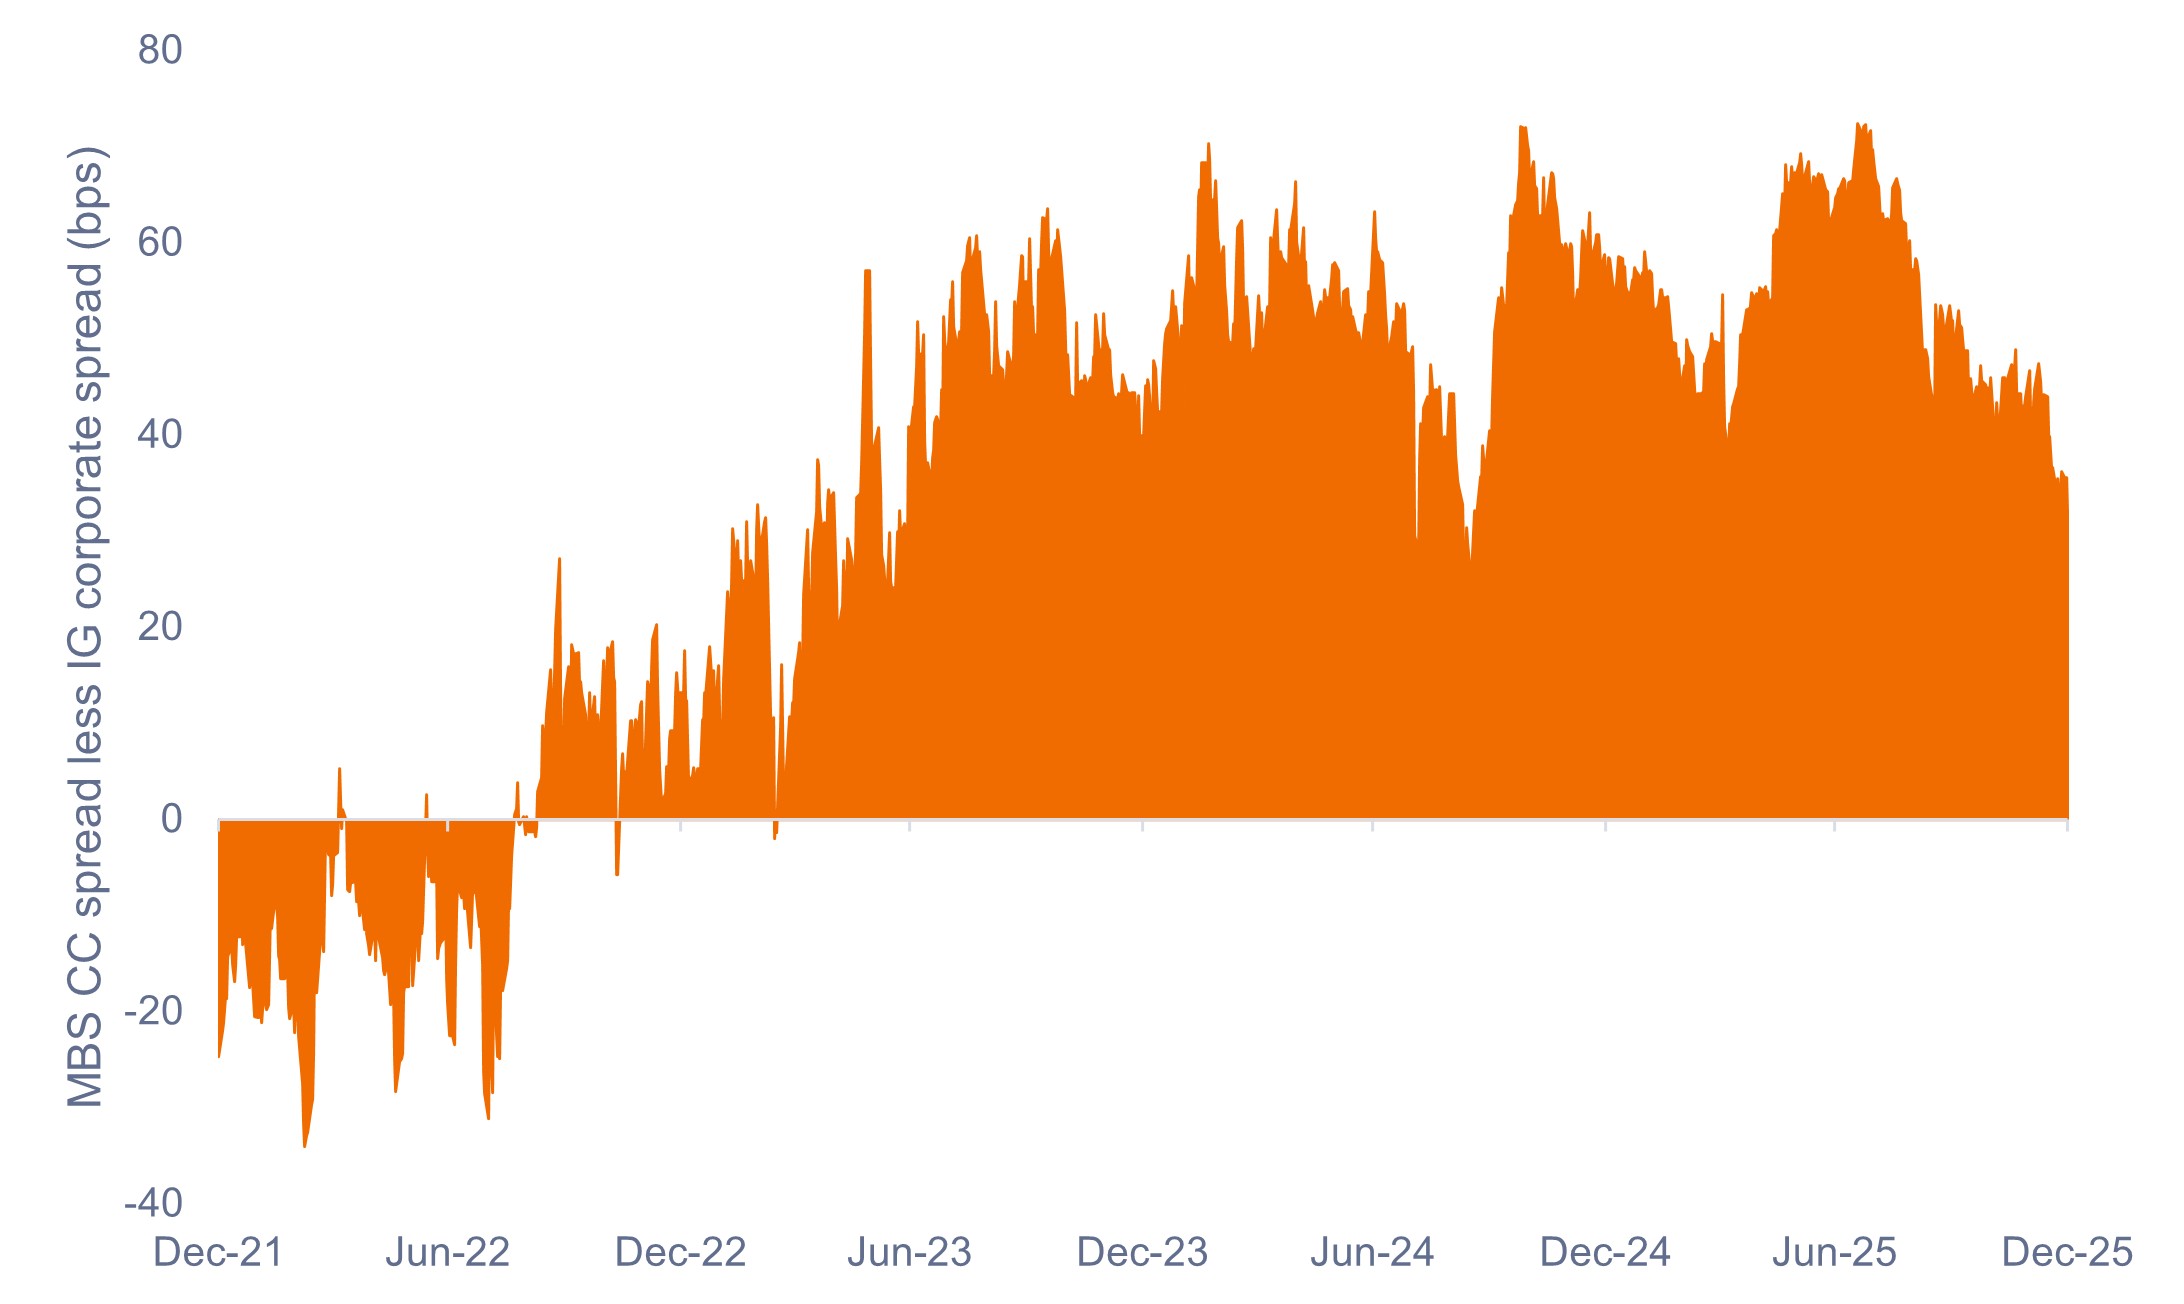
Source: Bloomberg, as of 31 December 2025.
In summary
In our view, mortgages offer attractive carry per unit of credit, convexity, and liquidity risk. We think fundamentals and technicals are aligning to provide a favorable environment in 2026, while the relative value of agency MBS remains attractive compared to IG corporate credit.
The asset class has historically rewarded nuanced security selection and active convexity management, making it, in our view, a compelling fit for active managers.
Basis point (bp) equals 1/100 of a percentage point. 1 bp = 0.01%, 100 bps = 1%.
The carry of a bond refers to its yield over a given holding period, measured by the coupons regularly received.
A bond coupon is the annual interest payment made to bondholders, calculated as a percentage of the bond’s face value, known as the coupon rate.
The Bloomberg US Mortgage-Backed Securities (MBS) Index tracks fixed-rate agency mortgage-backed pass-through securities guaranteed by Ginnie Mae (GNMA), Fannie Mae (FNMA), and Freddie Mac (FHLMC). The index is constructed by grouping individual TBA-deliverable MBS pools into aggregates or generics based on program, coupon and vintage.
Convexity: Prepayments result in the duration of MBS falling when interest rates decline, a concept known as negative convexity.
Credit Spread is the difference in yield between securities with similar maturity but different credit quality. Widening spreads generally indicate deteriorating creditworthiness of corporate borrowers, and narrowing indicate improving.
Duration measures a bond price’s sensitivity to changes in interest rates. The longer a bond’s duration, the higher its sensitivity to changes in interest rates and vice versa.
Excess return is the total return of a bond or portfolio minus a benchmark return (often a risk-free rate or duration-matched risk-free bond). It measures the performance above what is expected, representing the compensation for taking on additional credit, interest rate, or liquidity risk beyond the risk-free rate.
Government-Sponsored Enterprise (GSE) refers to entities like Fannie Mae and Freddie Mac, created by Congress to provide liquidity and stability to the U.S. housing market by buying loans from lenders, packaging them into securities, and ensuring they are accessible and affordable.
The ICE BofA MOVE Index measures U.S. bond market volatility by tracking a basket of OTC options on U.S. interest rate swaps. The Index tracks implied normal yield volatility of a yield curve weighted basket of at-the-money one month options on the 2-year, 5-year, 10-year, and 30-year constant maturity interest rate swaps.
Investment-grade securities: A security typically issued by governments or companies perceived to have a relatively low risk of defaulting on their payments. The higher quality of these bonds is reflected in their higher credit ratings when compared with bonds thought to have a higher risk of default, such as high-yield bonds.
A yield curve is a line that plots the yields, or interest rates, of bonds that have equal credit quality but different maturity dates.
IMPORTANT INFORMATION
Actively managed portfolios may fail to produce the intended results. No investment strategy can ensure a profit or eliminate the risk of loss.
Fixed income securities are subject to interest rate, inflation, credit and default risk. The bond market is volatile. As interest rates rise, bond prices usually fall, and vice versa. The return of principal is not guaranteed, and prices may decline if an issuer fails to make timely payments or its credit strength weakens.
Securitized products, such as mortgage-backed securities and asset-backed securities, are more sensitive to interest rate changes, have extension and prepayment risk, and are subject to more credit, valuation and liquidity risk than other fixed-income securities.
These are the views of the author at the time of publication and may differ from the views of other individuals/teams at Janus Henderson Investors. References made to individual securities do not constitute a recommendation to buy, sell or hold any security, investment strategy or market sector, and should not be assumed to be profitable. Janus Henderson Investors, its affiliated advisor, or its employees, may have a position in the securities mentioned.
Past performance does not predict future returns. The value of an investment and the income from it can fall as well as rise and you may not get back the amount originally invested.
The information in this article does not qualify as an investment recommendation.
There is no guarantee that past trends will continue, or forecasts will be realised.
Marketing Communication.
Important information
Please read the following important information regarding funds related to this article.
- An issuer of a bond (or money market instrument) may become unable or unwilling to pay interest or repay capital to the Fund. If this happens or the market perceives this may happen, the value of the bond will fall.
- When interest rates rise (or fall), the prices of different securities will be affected differently. In particular, bond values generally fall when interest rates rise (or are expected to rise). This risk is typically greater the longer the maturity of a bond investment.
- The Fund invests in high yield (non-investment grade) bonds and while these generally offer higher rates of interest than investment grade bonds, they are more speculative and more sensitive to adverse changes in market conditions.
- Some bonds (callable bonds) allow their issuers the right to repay capital early or to extend the maturity. Issuers may exercise these rights when favourable to them and as a result the value of the Fund may be impacted.
- If a Fund has a high exposure to a particular country or geographical region it carries a higher level of risk than a Fund which is more broadly diversified.
- The Fund may use derivatives to help achieve its investment objective. This can result in leverage (higher levels of debt), which can magnify an investment outcome. Gains or losses to the Fund may therefore be greater than the cost of the derivative. Derivatives also introduce other risks, in particular, that a derivative counterparty may not meet its contractual obligations.
- When the Fund, or a share/unit class, seeks to mitigate exchange rate movements of a currency relative to the base currency (hedge), the hedging strategy itself may positively or negatively impact the value of the Fund due to differences in short-term interest rates between the currencies.
- Securities within the Fund could become hard to value or to sell at a desired time and price, especially in extreme market conditions when asset prices may be falling, increasing the risk of investment losses.
- The Fund may incur a higher level of transaction costs as a result of investing in less actively traded or less developed markets compared to a fund that invests in more active/developed markets.
- Some or all of the ongoing charges may be taken from capital, which may erode capital or reduce potential for capital growth.
- The Fund could lose money if a counterparty with which the Fund trades becomes unwilling or unable to meet its obligations, or as a result of failure or delay in operational processes or the failure of a third party provider.
- In addition to income, this share class may distribute realised and unrealised capital gains and original capital invested. Fees, charges and expenses are also deducted from capital. Both factors may result in capital erosion and reduced potential for capital growth. Investors should also note that distributions of this nature may be treated (and taxable) as income depending on local tax legislation.
- The Fund invests in Asset-Backed Securities (ABS) and other forms of securitised investments, which may be subject to greater credit / default, liquidity, interest rate and prepayment and extension risks, compared to other investments such as government or corporate issued bonds and this may negatively impact the realised return on investment in the securities.