
Key takeaways:
- The recent rise in yields has been driven principally by rates uncertainty as central banks have moved in a more hawkish direction.
- Historical data reveals that buying high yield bonds when they are yielding around current levels has generally resulted in a positive return 12 months later.
- Corporate fundamentals remain strong and the default rate is low, while relatively low duration (rate sensitivity) on high yield bonds should offer some cushion against rate volatility.
In western culture, seven is often considered to be a lucky number – hence why 777 is a common symbol for casino jackpots in the West.1 In China, eight is the favoured number because its pronunciation sounds similar to prosperity or fortune: it was no coincidence that the 2008 Olympics in Beijing began on 8th August that year. Given that the average yield on US high yield bonds moved above 8% in late September, we explore some of the reasons why this number might have significance for high yield bond investors.
The art of being average
The ICE BofA US High Yield Index has daily yield data going all the way back to 1994. The average yield on the US high yield corporate bond market over this time was 8.4%.2 This mean figure is pulled upwards slightly by ‘crisis’ yields when bond yields spike temporarily high as they did during the Global Financial Crisis (GFC), usually falling back swiftly as the crisis passes. The median figure (the mid-point of all the daily yields going back more than 30 years) is uncannily exactly 8.0%.2 The median figure is significant. It tells you that US high yield bonds have spent as much time below an 8% yield as above it.
Currently, the yield on US high yield is at 8.2% (at 7 October 2026), which sits on the 54th percentile of daily data going back to 1994.3 This means yields have been lower 54% of the time and higher 46% of the time. Recall that bond prices rise when yields fall and vice versa so yields being slightly above average is arguably not a bad place to be if you are looking for potential gains from yields moving lower. Of course, many factors shape the outlook for the direction of yields, not least central bank policy and the inflation outlook, but it does no harm to have probability on your side.
Income as an indicator of returns
We have often stated that the starting yield of an investment is one of the best indicators of likely future returns in fixed income. When yields are low it makes generating a return from corporate bonds much harder because a) there is only a modest level of coupon income to contribute to total return; b) there is limited opportunity for capital gain from yields falling, and; c) there is less yield cushion to absorb any defaults.
For these reasons, a starting yield of 8.2% today arguably offers a much more attractive entry point than say the 3.8% yield offered by US high yield back in July 2021.4 Recall that five years ago, the US Federal Reserve policy interest rate (the Fed funds rate) was near zero, but it has averaged 4.6% over the past 50 years.5 Today’s Fed funds rate of 3.75%-4% therefore looks more normal historically. It is not unfeasible that the Fed raises rates from 4% to 8%, but we would argue that the hurdle to raising rates by several percentage points from here is much higher than it was when the Fed raised rates from close to zero.
Building on the points above, it has historically been rare to suffer a negative return on high yield over a 12-month period when the starting yield is 8% or more. Figure 1 shows the distribution of 12-month forward returns from any day when the starting point of the yield on the US high yield index was between 8% and 9% (i.e. at around current levels). The chart is based on daily data going all the way back to 1994. Investors buying when the yield was between 8% and 9% would only have experienced negative returns 12 months later had they bought in October 1997, August 1998, or between June to November 2007.
Figure 1: Distribution of 12-month forward return when US HY bonds yield 8% to 9%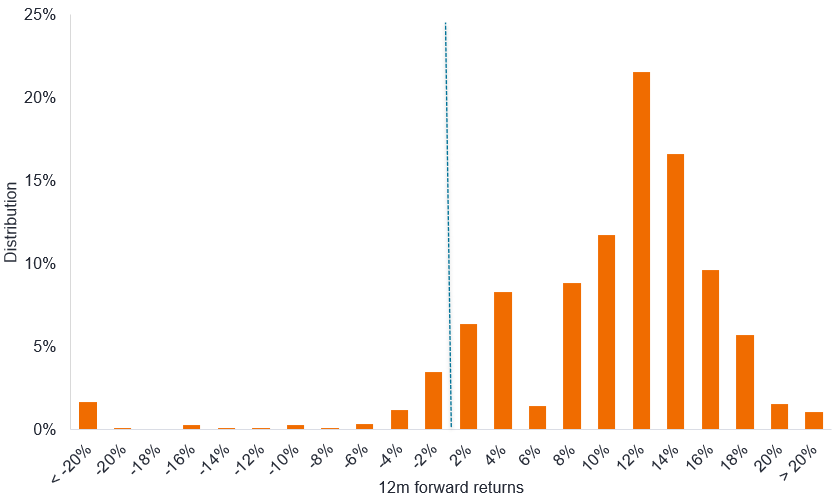
Source: Janus Henderson Investors, Bloomberg, ICE BofA US High Yield Index, total returns in US dollars. 12-month forward returns are grouped into return cohorts. Each cohort covers a two-percentage point return range (e.g. 2% = 0 to 2%, 4% = 2% to 4%), 25 October 1994 to 30 September 2026. The yield used is the yield to worst (see definitions). Past performance does not predict future returns.
Note that returns are clustered on the positive side of the chart, demarcated by the dotted line. This is not surprising because the average 12-month return when an investor bought the index when it was yielding between 8% and 9% was 8.9% (source as per Figure 1).
High yield returns when rates are rising
That is all well and good you might say, but those returns are probably skewed by the fact that rates were on a downward trend for a large part of the period. What happens in periods when yields are rising, as we have seen recently?
Earlier we used the ICE BofA US High Yield Index as it has the most comprehensive daily data going back to 1994. By using the Bloomberg US Corporate High Yield Index’s monthly yield and return data we can take our analysis back to 1988 and capture the rate rise period in the late 1980s.
This time around, we have bucketed starting yields into five different groups, so we can see what happens to forward returns over not just a one-year period but over three and five-year periods as well. The one-year forward returns are cumulative, but we annualise returns over three and five years to make comparisons easier. The middle group reflects when starting yields are between 8% and 9.5%. We are only showing forward returns from months where the yield on high yield bonds was higher than 12 months earlier. This way we eliminate noise from short-term moves in the yield.
Figure 2: High yield forward returns following rising yield periods only
Returns in yield cohorts when starting yield was higher than 12 months earlier
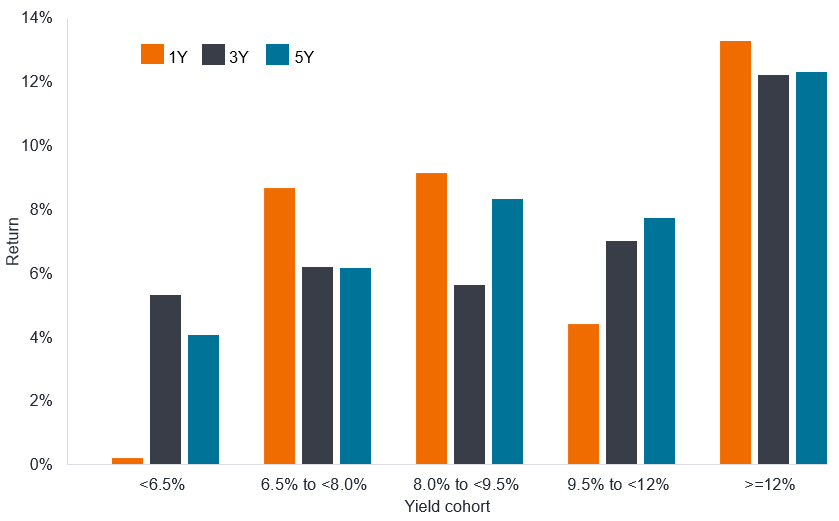
Source: Janus Henderson Investors, Bloomberg, Bloomberg US Corporate High Yield Index, total return in US dollars, yield to worst (YTW), month end data. Historical observations begin in January 1988, following the required 12-month YTW lookback and ends 30 September 2026. YTW regimes are rounded near-quintile buckets: <6.5%, 6.5–<8.0%, 8.0–<9.5%, 9.5–<12.0%, and ≥12.0%. One-year returns are cumulative; three- and five-year returns are annualised. The rising-YTW view includes only months where YTW was higher than 12 months earlier. Past performance does not predict future returns.
The chart again highlights something special about the 8%+ cohort. Returns over the subsequent 12 months are higher than any other cohort except the 12%+ cohort. The latter reflects periods when high yield bond yields are in a major risk-off (typically crisis) period, hence why the yields are so high, with investors subsequently benefiting from a recovery.
Strong fundamentals
Today, the fundamental backdrop for high yield bonds remains supportive. Earnings have generally been strong, with many companies continuing to surprise positively. Leverage levels are, in the main, manageable, with average US high yield gross leverage ratios (gross debt/EBITDA) of 3.6 at 31 August 2026, somewhat below the 3.9 long-term average.6 Stress, where it exists, is principally among CCC-rated bonds and this is reflected in the dispersion of spreads in this ratings cohort. Defaults remain low and more recently have been trending down, with recovery rates around the long-term average of 40% of the face value of the bond.
Figure 3: US high yield default rate, %
12-month trailing default rate, par weighted
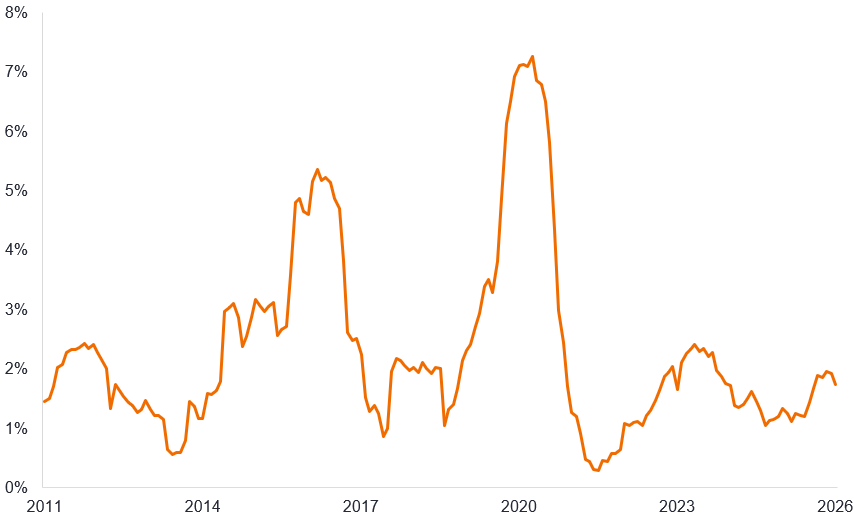
Source: BofA Global Research, US par weighted high yield trailing 12-month default rate, 31 August 2011 to 31 August 2026. Past performance does not predict future returns.
High yield returns can be volatile. We are cognisant of the fact that central bank rhetoric has turned more hawkish at a time when the geopolitical environment remains unstable. It is therefore understandable that investors might be nervous after a recent rising yield episode. At times like this, it is worth recognising the benefit that lower duration (rate sensitivity) on high yield can offer. US high yield bonds have a relatively low duration (rate sensitivity) of around 3.2 years, which can help reduce the negative impact on total return when bond yields rise.7
The sell-off has, however, cheapened valuations for investors and we believe current starting yields offer an attractive entry point to the asset class. Investors do not have to rely on luck to generate returns from the high yield asset class. A patient approach that invests selectively, we believe, can offer rewards for investors over the long term.
1Arguments as to why seven is seen as lucky range from being linked to its qualities as a prime number (a number only divisible by one and itself), its importance within many religions, and the fact that if two dice are rolled, the probability of the combined value being seven is highest.
2Source: Bloomberg, ICE BofA US High Yield Index, 25 October 1994 to 30 September 2026.
3Source: Bloomberg, ICE BofA US High Yield Index, yield to worst percentile, 7 October 2026, comparing with period 25 October 1994 to 7 October 2026.
4Source: Bloomberg, ICE BofA US High Yield Index, yield to worst, as of 7 October 2026 and 1 July 2021.
5Source: US Federal Reserve, fed funds target rate, monthly data, 30 September 1976 to 30 September 2026.
6Source: BofA Global Research, average gross leverage between 31 January 2000 and 31 August 2026.
7Source: Bloomberg, effective duration, ICE BofA US High Yield Index, as of 7 October 2026.
Fixed income securities are subject to interest rate, inflation, credit and default risk. The bond market is volatile. As interest rates rise, bond prices usually fall, and vice versa. The return of principal is not guaranteed, and prices may decline if an issuer fails to make timely payments or its credit strength weakens.
High-yield or “junk” bonds involve a greater risk of default and price volatility and can experience sudden and sharp price swings.
Bloomberg US Corporate High Yield Index: This index measures the US dollar denominated high yield, fixed rate corporate bond market.
ICE BofA US High Yield Index: This index tracks US dollar denominated below investment grade corporate debt publicly issued in the US domestic market.
Central bank policies: The policies of a central bank aimed at influencing the level of inflation and growth in an economy. Monetary policy tools include setting interest rates and controlling the supply of money.
Cohort: A group that shares the same characteristics.
Corporate bond: A bond issued by a company. It offers investors periodic payments and the eventual return of the original money invested at maturity.
Coupon: A regular interest payment paid on a bond, described as a percentage of the investment’s face value.
Credit rating: An independent assessment of a borrower’s creditworthiness by a recognised agency such as Standard & Poor’s, Moody’s or Fitch. Standardised scores are used to indicate higher or lower credit quality.
Credit spread: The difference in yield between securities with similar maturity but different credit quality, often used to describe the difference between corporate- and government-bond yields. Widening spreads generally indicate deteriorating corporate creditworthiness, while narrowing spreads indicate improvement.
Default: The failure of a debtor, such as a bond issuer, to pay interest or return the original amount loaned when due.
Dispersion: The extent to which a distribution of data points is stretched or compressed. Dispersion is low when data points cluster around certain values and high when they are more widely spread.
Duration: Duration can measure how long it takes, in years, for an investor to be repaid a bond’s price through its total cash flows. It can also measure the sensitivity of a bond’s or fixed-income portfolio’s price to changes in interest rates. The longer the duration, the greater the sensitivity to interest-rate changes.
Earnings before interest, tax, depreciation and amortisation (EBITDA): A metric used to measure a company’s profitability before expenses and associated costs, taxes or debts.
Global financial crisis (GFC): The global economic crisis from mid-2007 to early 2009 that began with losses related to mortgage-backed financial assets in the US and spread to affect financial markets and banks globally. It is also known as the Great Recession.
Gross leverage ratio: A ratio that expresses debt as a multiple of earnings, typically total debt/EBITDA. Higher leverage equates to higher debt levels.
Hawkish: An indication that policymakers are looking to tighten financial conditions, such as by supporting higher interest rates to curb inflation.
High-yield bond: A bond with a lower credit rating than an investment-grade bond, also known as a sub-investment-grade or ‘junk’ bond. These bonds usually carry a higher risk of default, so they typically offer a higher interest rate to compensate for the additional risk.
Index: A statistical measure of a group or basket of securities or other financial instruments. Each index has its own calculation method, usually expressed as a change from a base value.
Inflation: The rate at which the prices of goods and services are rising in an economy.
Investment-grade: A bond typically issued by a government or company perceived to have a relatively low risk of default, reflected in the higher rating assigned by credit-rating agencies.
Leverage: The ratio of a company’s debt to its equity. It may also be expressed in other ways, such as net debt as a multiple of earnings or EBITDA. Higher leverage equates to higher debt levels.
Option-adjusted spread (OAS): The difference in yields between two bonds or securities after accounting for the value of additional rights embedded in their structures. It represents the compensation investors might expect for credit or liquidity risk.
Par value: The original value of a security, such as a bond, when it is first issued. Bonds are usually redeemed at par value when they mature.
Recovery rate: The amount expressed as a percentage, recovered from a loan when the borrower is unable to settle the full outstanding amount.
Total return: A performance measure that reflects the actual rate of return of an investment or pool of investments over a given evaluation period, comprising income and any change in capital value.
Volatility: The rate and extent at which the price of a portfolio, security or index moves up and down. Larger price movements indicate higher volatility and investment risk.
Yield: The level of income on a security over a set period, typically expressed as a percentage. For a bond, in its simplest form, it is calculated as the coupon payment divided by the current bond price.
Yield to worst (YTW): The lowest yield that a bond with a special feature, such as a call option, can achieve provided the issuer does not default. For a portfolio, it represents the weighted average across all underlying bonds held.
These are the views of the author at the time of publication and may differ from the views of other individuals/teams at Janus Henderson Investors. References made to individual securities do not constitute a recommendation to buy, sell or hold any security, investment strategy or market sector, and should not be assumed to be profitable. Janus Henderson Investors, its affiliated advisor, or its employees, may have a position in the securities mentioned.
Past performance does not predict future returns. The value of an investment and the income from it can fall as well as rise and you may not get back the amount originally invested.
The information in this article does not qualify as an investment recommendation.
There is no guarantee that past trends will continue, or forecasts will be realised.
Marketing Communication.