
Key takeaways:
- AI-driven capital expenditure (CapEx) from hyperscalers is fuelling record investment grade credit issuance, with tech’s share of IG indices projected to rise sharply. This structural shift introduces concentration risk and mirrors past sector dominance cycles, but this time corporate fundamentals are much stronger.
- Heavy supply may pressure spreads temporarily, yet robust demand and reinvestment flows should absorb issuance. Investors face a late-cycle environment where macro factors – geopolitics and fiscal and monetary policy – pose greater risks than credit quality.
- A nimble approach to portfolio rotation amid dispersion and shifting rate cycles is vital for 2026. Resilience matters as yields stay historically attractive, and steeper curves favour fixed-rate allocations further along the maturity spectrum.
Tighter spreads amid record supply
As we look ahead to 2026, one of the most dominant themes for global investment grade (IG) credit markets is the sheer scale of expected supply. This comes against a backdrop of tighter valuations and concerns about spread widening – but we believe it is key for investors to focus on corporate fundamentals alongside a less challenging inflation environment and more benign rates backdrop for credit.
Record supply expected in 2026
2025 has been a blockbuster year for IG issuance. According to Morgan Stanley, US IG supply reached US$1.71 trillion over the year to date, well above the five-year average of US$1.45 trillion. In Europe, the equivalent issuance hit €714 billion versus a five-year average of €557 billion.[1] This surge has been driven in part by hyperscalers – namely Meta, Google’s owner Alphabet, Apple, Oracle and Amazon – raising finance to fund unprecedented capital expenditure (CapEx) linked to AI infrastructure.
Looking forward, hyperscalers’ CapEx estimates for 2026 vary widely, ranging between US$300bn to over US$500bn, across market participants. Figure 1 show some estimates from Wells Fargo. This uncertainty reflects the scale and timing of hyperscaler financing plans and broader corporate CapEx trends. The speed at which hyperscaler investment forecasts have surged epitomises this. According to Goldman Sachs, consensus estimates for 2026 have jumped from US$314billion at the start of 2025 to US$458 billion by Q3, with expectations now at US$518 billion.[2]
Figure 1: Tech issuance expected to grow to US$350bn in 2026
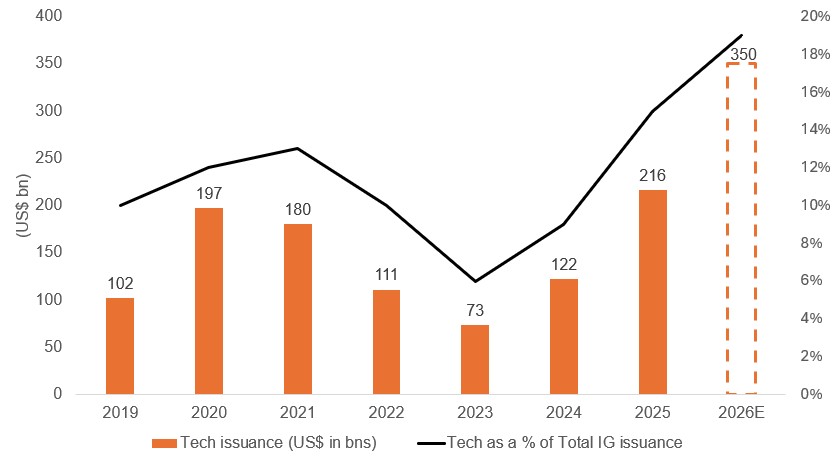
Source: Wells Fargo Securities, Bloomberg, November 2025.
The changing face of the investment grade market
We expect technology’s footprint in IG credit to expand significantly, driven by this unprecedented AI-related CapEx. The sector has grown from 3% of the index in 2008 to 10% today,[3]and the Big Five hyperscalers alone could represent over 5% of the index by the end of 2026.[4] Based on current issuance expectations, tech could account for up to 17% of the US IG market and up to 8% of the Euro IG market within two years,[5] placing these companies among the top 10 issuers outside the big six banks. This evolution mirrors past cycles like oil and gas dominance in the shale boom of 2015-16, with painful memories of an earnings shock when oil prices collapsed. However, hyperscalers are highly profitable, cash-rich companies, unlike many shale producers that were highly leveraged and vulnerable to price swings.
Can the market absorb this supply?
Nevertheless, the perennial question for investors is: can the market digest this wave of issuance without destabilising spreads? Our view is most likely yes – though not without some short-term indigestion. These are high-quality, cash-rich companies with robust margins and resilient cash flows. Deals from hyperscalers offer investors access to AA-rated, non-cyclical issuers at attractive new-issue concessions. Historically, mega-deals – such as Verizon’s $49 billion refinancing or AB InBev’s post-M&A issuance – have provided compelling entry points and we expect similar opportunities to arise in 2026.
Overall, technicals (supply and demand dynamics) remain supportive. Global IG credit generates roughly US$600 billion in annual coupon payments,[6] creating a natural reinvestment bid alongside fresh inflows. While heavy supply may pressure spreads temporarily, we see this as an opportunity to build structural positions in defensive sectors rather than a systemic risk.
Beyond Tech: the broader CapEx wave
It is important to note that elevated CapEx is not confined to technology, as shown in Figure 2. Robust investment across manufacturing and infrastructure has been a key driver of growth and productivity post-COVID. While this has supported margins so far, history suggests that significant capacity additions eventually lead to competition and pricing pressure. For now, fundamentals remain solid, and we characterise the current environment as late cycle rather than end of cycle. Unlike the dot-com era, while tech CapEx growth is now parallel to that period,[7], today’s issuers are large, profitable, and well capitalised. However, investors should remain alert to the longer-term implications: strong margins can encourage over-expansion, competition and eventually impact profits, but this is not a near-term dynamic in our view.
Figure 2: The CapEx cycle extends beyond tech as shown by US private construction spending by sector
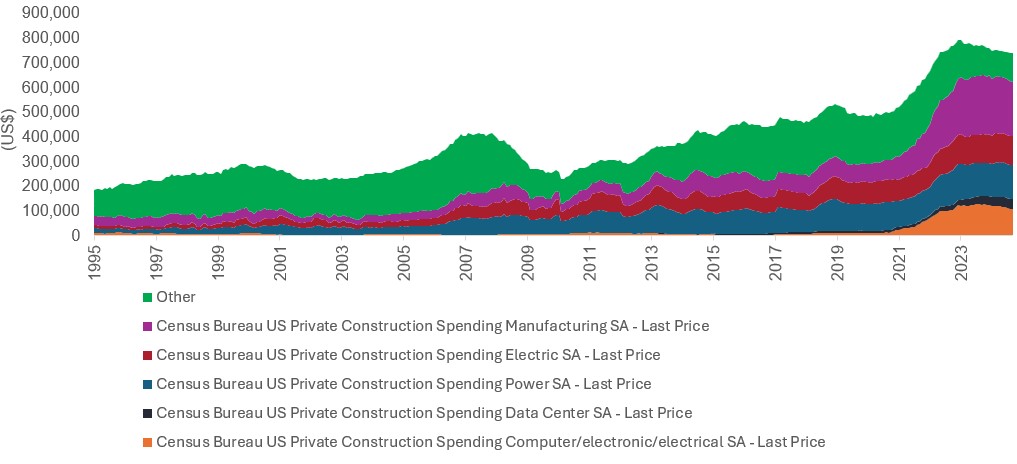
Source: Bloomberg, 1 December 1995 to 1 August 2025.
Risks: exogenous shocks and macro variables, not credit fundamentals
We believe the biggest risk to IG credit in 2026 is not credit quality but macro dynamics. Core developed markets end the year in better shape than many envisioned following the “Liberation Day” volatility. A piecemeal approach to tariffs with numerous carve-outs has moderated the impact on cross-border trade and avoided a steep decline in activity. With inflation forecast to fall below target levels in continental Europe and return towards target in the US and UK as one-time fiscal effects fall out of year-over-year changes, monetary policy may remain supportive for bond markets in the year ahead.
Globally the cycle of interest rate cuts is likely coming to an end, however. Recent pronounced increases in government bond yields in Asia are changing the relative attractiveness of domestic markets. The de-dollarisation event that markets feared in the summer of 2025 has not materialised, but slow repatriation may occur reversing the years-long cycle of liquidity provision to US and other developed markets. Without central banks intervening to suppress volatility, the risks – and opportunities – of macro-led volatility from a less synchronised global growth outlook may be elevated.
While spreads are tight, yields remain attractive, with global IG yielding around 4.4%.[8] This compares favourably to historical norms and offers positive total return potential, particularly as rate-cutting cycles progress in the UK and US. We expect investors to gradually extend duration as confidence in inflation control builds, moving beyond the front-end bias that dominated flows in 2025.
Investor playbook for 2026
We believe having the firepower and dynamism to act will be important to navigating investment grade credit in 2026. An active primary market will undoubtedly create opportunities within tech and outside of it – allowing investors to select those idiosyncratic stories that are positioned to succeed. Rather than chasing yield indiscriminately, we believe investor focus should be on quality: strong balance sheets, resilient cash flows, and issuers with the capacity to navigate competitive pressures as the CapEx wave plays out. This is a year to lean into structural themes without becoming overexposed to any single sector.
Technology’s growing weight in IG indices introduces concentration risk, suggesting that investors might consider diversifying portfolios, balancing exposure with defensive sectors and maintaining liquidity to act when volatility creates mispriced opportunities. Being nimble – ready to rotate as dispersion emerges – is critical. We expect investors to take advantage of steeper yield curves to extend duration selectively as inflation in Europe and the US moderates and rate-cutting cycles progress, but they should avoid complacency: inflation and policy shifts remain key swing factors. In short, success will come from combining patience with agility – building positions in high-quality credits while staying alert to the next phase of the cycle.
Yields may vary and are not guaranteed.
Footnotes
[1] Source: Morgan Stanley, 1 December 2025.
[2] Source: FactSet, Goldman Sachs Global Investment Research, 3 November 2025.
[3] Source: Bloomberg, as at 11 December 2025.
[4] Source: Wells Fargo Securities, Bloomberg LP, as at November 2025. Big Five are Oracle, Amazon, Meta, Microsoft and Alphabet. The Index is the Bloomberg US Corporate Investment Grade Index.
[5] Source: Janus Henderson Estimates, as at 8 December 2025.
[6] Source: Janus Henderson estimates, as at 12 December 2025.Based on the Bloomberg Global Aggregate Corporate Index.
[7] Source: ASR Ltd, WorldScope, LSEG Datastream, 3 November 2025.
[8] Source: Bloomberg Global Aggregate Corporate Total Return Index Hedged USD, as at 11 December 2025. Yields may vary and are not guaranteed.
Bond valuations refer to the process of determining the fair price of a bond based on its expected future cash flows and prevailing market conditions.
Bond yield: The level of income on a security expressed as a percentage rate. For a bond, this is calculated as the coupon payment divided by the current bond price. There is an inverse relationship between bond yields and bond prices. Lower bond yields mean higher bond prices, and vice versa.
Capital Expenditure (CapEx): Funds spent by a company to acquire, upgrade or maintain long-term physical assets—buildings, machinery, etc. These are capital investments, not operational expenses.
Concentration Risk: Risk arising when a portfolio or issuer is heavily weighted in a single asset, sector, or issuer, increasing vulnerability to adverse events affecting that concentration.
Coupon: A regular interest payment that is paid on a bond described as a percentage of the face value of an investment. For example, if a bond has a face value of £100 and a 5% annual coupon, the bond will pay £5 a year in interest.
Credit: Credit is typically defined as an agreement between a lender and a borrower. It is often narrowly used to describe corporate borrowings, which can take the form of corporate bonds, loans, or other fixed-interest asset classes.
Credit Spread: The difference in yield between securities with similar maturity but different credit quality, often used to describe the difference in yield between corporate bonds and government bonds. Widening spreads generally indicate a deteriorating creditworthiness of corporate borrowers, while narrowing indicates improving. Credit spreads are often referred to as bond valuations.
Dispersion The extent to which a distribution of data points is stretched or squeezed. If the data points cluster around certain values, then dispersion is low, whereas if they are more spread out, then dispersion is high. For example, dispersion in stocks measures the range of returns for a group of stocks. Higher dispersion opens up opportunities for stock pickers to outperform by selecting the winners and avoiding the losers, given that stock returns are spread more widely on either side of the benchmark.
Duration: Duration can measure how long it takes (in years) for an investor to be repaid a bond‘s price by the bond’s total cash flows. Duration can also measure the sensitivity of a bond’s or fixed-income portfolio’s price to changes in interest rates. The longer a bond’s duration, the higher its sensitivity to changes in interest rates, and vice versa. ‘Going short duration’ refers to reducing the average duration of a portfolio, while ‘going long duration’ refers to extending a portfolio’s average duration.
Fiscal/Fiscal policy: Describes government policy relating to setting tax rates and spending levels. Fiscal policy is separate from monetary policy, which is typically set by a central bank. Fiscal austerity refers to raising taxes and/or cutting spending in an attempt to reduce government debt. Fiscal expansion (or ‘stimulus’) refers to an increase in government spending and/or a reduction in taxes.
Hyperscalers: These are large-scale data centres that provide a wide range of cloud computing and data solutions for businesses that need vast digital infrastructure.
Index Weighting: The method of determining how much each security contributes to an index’s performance, often based on market capitalisation or outstanding debt.
Inflation: The rate at which the prices of goods and services are rising in an economy. The consumer price index (CPI) and retail price index (RPI) are two common measures; the opposite of deflation.
Investment grade (IG): Bonds rated BBB‑ or higher by major credit agencies (S&P, Moody’s, Fitch), indicating low default risk and considered safer investments.
Issuance: The process by which corporations or governments issue new securities (bonds, shares) to raise capital – selling them in the primary market.
Late-cycle environment: Stage in the economic cycle characterized by slowing growth, tightening monetary policy, and rising default risks—typically preceding a downturn or recession.
‘Liberation Day’: In the U.S. context, “Liberation Day” refers to April 2, 2025, when President Donald Trump announced sweeping, reciprocal import tariffs on goods from many countries, framing it as freeing American industry from unfair trade, though it marked a major turn towards protectionism with potential global trade conflict.
Liquidity/Liquid assets: Liquidity is a measure of how easily an asset can be bought or sold in the market. Assets that can be easily traded in the market in high volumes (without causing a major price move) are referred to as ‘liquid’.
Monetary policy: The policies of a central bank aimed at influencing the level of inflation and growth in an economy. Monetary policy tools include setting interest rates and controlling the supply of money. Monetary stimulus refers to a central bank increasing the supply of money and lowering borrowing costs. Monetary tightening refers to central bank activity aimed at curbing inflation and slowing down growth in the economy by raising interest rates and reducing the supply of money. See also fiscal policy.
New-issue concessions: Yield premium offered on newly-issued bonds over existing market comparable bonds to attract investors, compensating for liquidity or informational disadvantages.
Non-cyclical issuers: Companies that provide essential goods/services – such as utilities or healthcare – with earnings and revenues less influenced by economic cycles.
Primary market: Market where securities are issued and sold for the first time directly by issuers to investors, enabling capital raising before secondary trading.
Rate-cutting cycles: Periods during which central banks lower benchmark interest rates to stimulate economic activity, affecting yields across debt markets and influencing bond valuations.
Reinvestment flows: Funds generated from maturing investments or coupon payments that are reinvested into similar financial assets, helping maintain portfolio income and yield levels.
Steepening yield curve: A yield curve graph plots the yields of similar quality bonds against their maturities. A steepening yield curve typically indicates that investors expect rising inflation and stronger economic growth.Technicals: Market influences arising from supply and demand conditions – such as new issuance volumes, fund flows, and investor sentiment – that drive pricing beyond fundamentals.
Volatility: The rate and extent at which the price of a portfolio, security, or index, moves up and down. If the price swings up and down with large movements, it has high volatility. If the price moves more slowly and to a lesser extent, it has lower volatility. The higher the volatility, the higher the risk of the investment.
These are the views of the author at the time of publication and may differ from the views of other individuals/teams at Janus Henderson Investors. References made to individual securities do not constitute a recommendation to buy, sell or hold any security, investment strategy or market sector, and should not be assumed to be profitable. Janus Henderson Investors, its affiliated advisor, or its employees, may have a position in the securities mentioned.
Past performance does not predict future returns. The value of an investment and the income from it can fall as well as rise and you may not get back the amount originally invested.
The information in this article does not qualify as an investment recommendation.
There is no guarantee that past trends will continue, or forecasts will be realised.
Marketing Communication.