
Key takeaways:
- The deterioration in US employment growth is likely to encourage the US Federal Reserve (Fed) to restart interest rate cuts, which could have knock-on effects globally.
- Yields on investment grade corporate bonds are generally well covered by resilient earnings, allowing investors to harvest a yield pick up over government bonds for limited credit risk.
- Declining interest rates are likely to feed through to lower yields on short-dated bonds and cash rates, meaning now may be an opportune time to lock in yields on shorter-dated bonds.
The US non-farm payrolls figure released on 5 September reinforces expectations of a cut in interest rates by the US Federal Reserve (Fed). The net monthly rise in jobs for August was 22,000, below market expectations. The figure might not have been so bad on its own, but the breadth of job gains was narrow (predominantly healthcare, with manufacturing showing losses) and was accompanied by yet more negative revisions.
Looking at US payrolls releases from original first estimate to the latest revised figures, all but one of the months in 2025 have been revised lower this year (see Figure 1). Perhaps more significantly, we have now seen a negative print for June post revisions, so if the pattern of revisions persists then this could be true for the last three months in aggregate.
Figure 1: US payrolls monthly net change (original first estimate and latest revised figure)
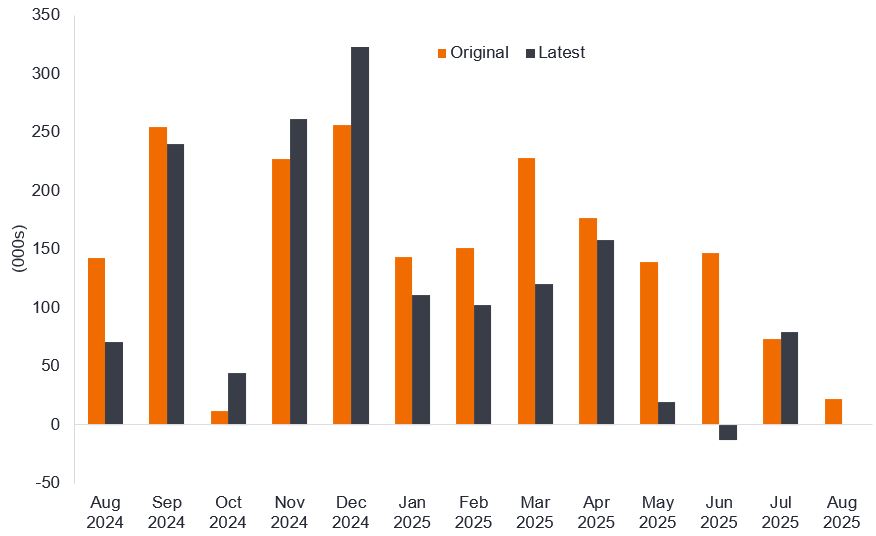
Source: LSEG Datastream, BLS, original first estimate and latest revised figure, seasonally adjusted, 31 August 2024 to 31 August 2025. Note: data as at 8 September 2025. On 9 September BLS released a preliminary revision for the 12 months to March 2025, suggesting payrolls would be 911,000 lower than reported. They do not yet provide the monthly breakdown to be able to alter the chart above.
This has sparked concerns that whilst the US economy itself may continue to expand, it could be facing a ‘jobs recession’. It may be coincidence, but job gains have been weak since April’s aggressive US tariff policy. Ultimately, someone is paying the extra $94 billion that the US government has collected in tariff revenue so far this year compared with 2024.1 It is not inconceivable, therefore, that US businesses are turning to the labour market as a source of cost-cutting, or at least dialling back on hiring while they await the legalities of the tariffs.
In recent weeks, Fed Chair Jerome Powell has pivoted somewhat, moving away from the primary focus on inflation and highlighting the risks to employment, the other part of the Fed’s dual mandate. With the Fed also facing political pressure to cut rates from the White House, a window for interest rate cuts has opened, with the market anticipating the Fed policy interest rate could fall from 4.25%-4.5% at the start of September 2025 to 3%-3.25% by July 2026.2
We have already seen yields on US shorter-dated bonds (both government and corporate bonds) begin to come down and rates on cash savings and money market funds will continue to decline as rates are cut.
Will the ECB follow the Fed?
Of course, the Fed does not dictate monetary policy globally. Central banks elsewhere chart their own course, but directionally it can have a bearing. The Fed cutting rates will narrow the gap between US and European rates. A weaker US labour market may ring alarm bells about the resilience of growth more globally, even if for now that seems to be holding up.
The European Central Bank (ECB), in our view, is most likely to keep rates on pause at its September meeting, with the deposit rate staying at 2%. European government and defence spending is providing some support for European economies, but the costs of tariffs on exporters and inflation close to its 2% target mean the ECB will want to retain the option to cut interest rates in coming months should risks to growth emerge.
Locking in yields
In our view, this seems like an opportune time for investors to lock in yields on short-dated global corporate bonds, ahead of further interest cuts in the US and potentially elsewhere. We see the additional yield that investment grade corporates pay over government bonds of the same maturity as being attractive and worth harvesting. Corporates have, in the main, been resilient – earnings increased by 13.3% in the US and by 4.3% in Europe in the second quarter of 2025 compared with the same period a year earlier.3 Most companies are therefore in a strong position to meet their payments to bondholders.
We recognise that inflation could yet be a problem and the Fed faces treading a fine line between cutting rates to support the labour market while avoiding reigniting inflation. Investors who want to avoid speculating on the direction of yields further along the yield curve should consider less rate-sensitive shorter-dated bonds. Shorter-dated investment grade corporate bonds, i.e. those with maturities of one to three years carry relatively low interest rate risk (price sensitivity to changes in interest rates), yet are on average offering yields of around 3.5%, which is well above the average of the last 15 years (see Figure 2).
Figure 2: Yield on the ICE BofA 1-3 Year Global Corporate Index
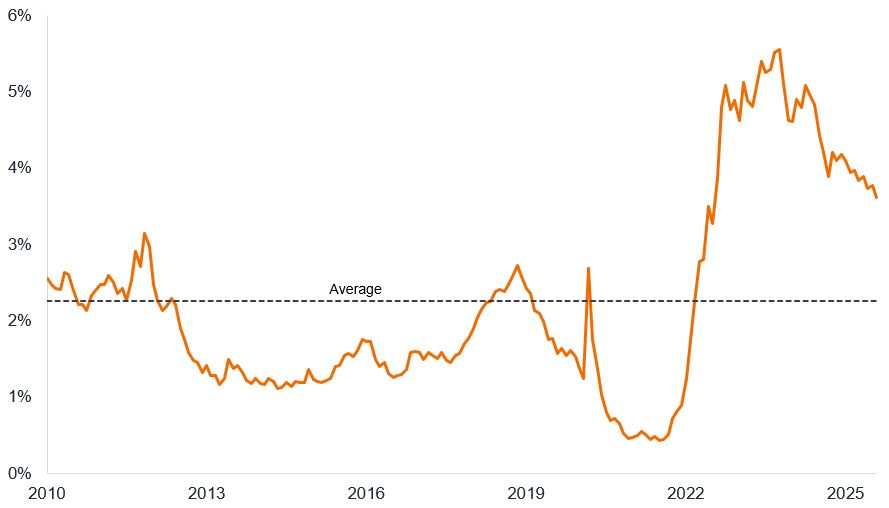
Source: Bloomberg, ICE BofA 1-3 year Global Corporate Index, 31 January 2010 to 31 August 2025. The yield shown is the yield to worst, which is the lowest yield a bond with a special feature (such as a call option) can achieve provided the issuer does not default. When used to describe an index, this statistic represents the weighted average across all the underlying bonds held. Yields may vary over time and are not guaranteed. Past performance does not predict future returns.
Investors could seek to lock in today’s yield by buying an individual bond, but we think that a fixed maturity bond fund could be a less risky route. Just like an individual bond it has a regular coupon and fixed maturity date but comes with the added benefit of diversification across a portfolio of bonds. Furthermore, credit selection is undertaken by a team of experts, who will monitor the portfolio throughout its fixed term, helping to avoid default risk and maximise the yield.
1Source: Politico, “Trump tariff income tracker”, cumulative year to date total versus 2024, 3 September 2025.
2Source: Bloomberg, World Interest Rate Probability, 8 September 2025. There is no guarantee that past trends will continue, or forecasts will be realised.
3Source: LSEG I/B/E/S, US S&P 500 earnings rose 13.3% in Q2 2025 v Q2 2024 with 496 out of 500 companies having reported at 5 September 2025. European STOXX 600 earnings rose 4.3% in Q2 2025 v Q2 2024, with 280 out of 600 companies having reported at 2 September 2025.
Fixed income securities are subject to interest rate, inflation, credit and default risk. The bond market is volatile. As interest rates rise, bond prices usually fall, and vice versa. The return of principal is not guaranteed, and prices may decline if an issuer fails to make timely payments or its credit strength weakens.
Please note that diversification neither assures a profit nor eliminates the risk of experiencing losses.
The ICE BofA 1-3 Year Global Corporate Bond Index tracks the performance of investment grade corporate debt publicly issued in the major domestic and Eurobond markets, with a remaining term to final maturity less than 3 years.
Corporate bond: A bond issued by a company. Bonds offer a return to investors in the form of periodic payments and the eventual return of the original money invested at issue on the maturity date.
Credit rating: A score given by a credit rating agency such as S&P Global Ratings, Moody’s and Fitch on the creditworthiness of a borrower. For example, S&P (Moody’s) ranks investment grade bonds from the highest AAA (Aaa) down to BBB (Baa3) and high yields bonds from BB (Ba1) through B (B1) down to CCC (Caa1) in terms of declining quality and greater risk, i.e. CCC rated borrowers carry a greater risk of default.
Credit spread: The difference in yield between securities with similar maturity but different credit quality. Widening spreads generally indicate deteriorating creditworthiness of corporate borrowers, and narrowing indicate improving.
Default: The failure of a debtor (such as a bond issuer) to pay interest or to return an original amount loaned when due.
Diversification: A way of spreading risk by mixing different types of assets/asset classes in a portfolio, on the assumption that these assets will behave differently in any given scenario.
Federal Reserve (Fed): The central bank of the US which determines its monetary policy.
High yield bond: Also known as a sub-investment grade bond, or ‘junk’ bond. These bonds usually carry a higher risk of the issuer defaulting on their payments, so they are typically issued with a higher interest rate (coupon) to compensate for the additional risk.
Inflation: The rate at which prices of goods and services are rising in the economy.
Interest rate risk or Duration: A measure of the sensitivity of a bond’s price to changes in interest rates. The longer a bond’s duration, the higher its sensitivity to changes in interest rates and vice versa. Bond prices rise when their yields fall and vice versa.
Investment grade bond: A bond typically issued by governments or companies perceived to have a relatively low risk of defaulting on their payments, reflected in the higher rating given to them by credit ratings agencies.
Maturity: The maturity date of a bond is the date when the principal investment (and any final coupon) is paid to investors. Shorter-dated bonds generally mature within 5 years, medium-term bonds within 5 to 10 years, and longer-dated bonds after 10+ years.
Monetary policy: The policies of a central bank, aimed at influencing the level of inflation and growth in an economy. Monetary policy tools include setting interest rates and controlling the supply of money.
Tariff: A tax or duty imposed by the government of one country on the import of goods from another country.
Yield: The level of income on a security over a set period, typically expressed as a percentage rate.
Yield curve:A graph that plots the yields of government bonds against their maturities. Normally, the yield curve is upward sloping, where yields for shorter-maturity bonds are lower than yields for bonds with a longer maturity.
Yield to worst: The lowest yield a bond (index) can achieve provided the issuer(s) does not default; it takes into account special features such as call options (that give issuers the right to call back, or redeem, a bond at a specified date).
Volatility measures risk using the dispersion of returns for a given investment. The rate and extent at which the price of a portfolio, security or index moves up and down.
These are the views of the author at the time of publication and may differ from the views of other individuals/teams at Janus Henderson Investors. References made to individual securities do not constitute a recommendation to buy, sell or hold any security, investment strategy or market sector, and should not be assumed to be profitable. Janus Henderson Investors, its affiliated advisor, or its employees, may have a position in the securities mentioned.
Past performance does not predict future returns. The value of an investment and the income from it can fall as well as rise and you may not get back the amount originally invested.
The information in this article does not qualify as an investment recommendation.
There is no guarantee that past trends will continue, or forecasts will be realised.
Marketing Communication.