
Key takeaways:
- A super El Niño can expose vulnerabilities across energy systems, infrastructure, supply chains and financial markets that often remain hidden during more stable periods.
- Extreme events reveal protection gaps and can strengthen demand for insurance, reinsurance and other risk-transfer solutions.
- The investment opportunity extends beyond decarbonisation to resilience, favouring businesses that help economies absorb shocks, adapt to disruption and continue operating under more volatile conditions.
The prospect of a super El Niño has once again pushed weather forecasts, hurricane projections and commodity markets to the forefront of investor attention. Some of the strongest El Niño events in recent history, including 1982–83, 1997–98 and 2015–16, coincided with significant economic disruption, affecting everything from agricultural production and hydropower generation to insurance losses and global supply chains. Yet weather is only part of the story.
Chart 1: Daily sea surface temperature, El Niño 3.4 (5°S – 5°N, 120-170°W)
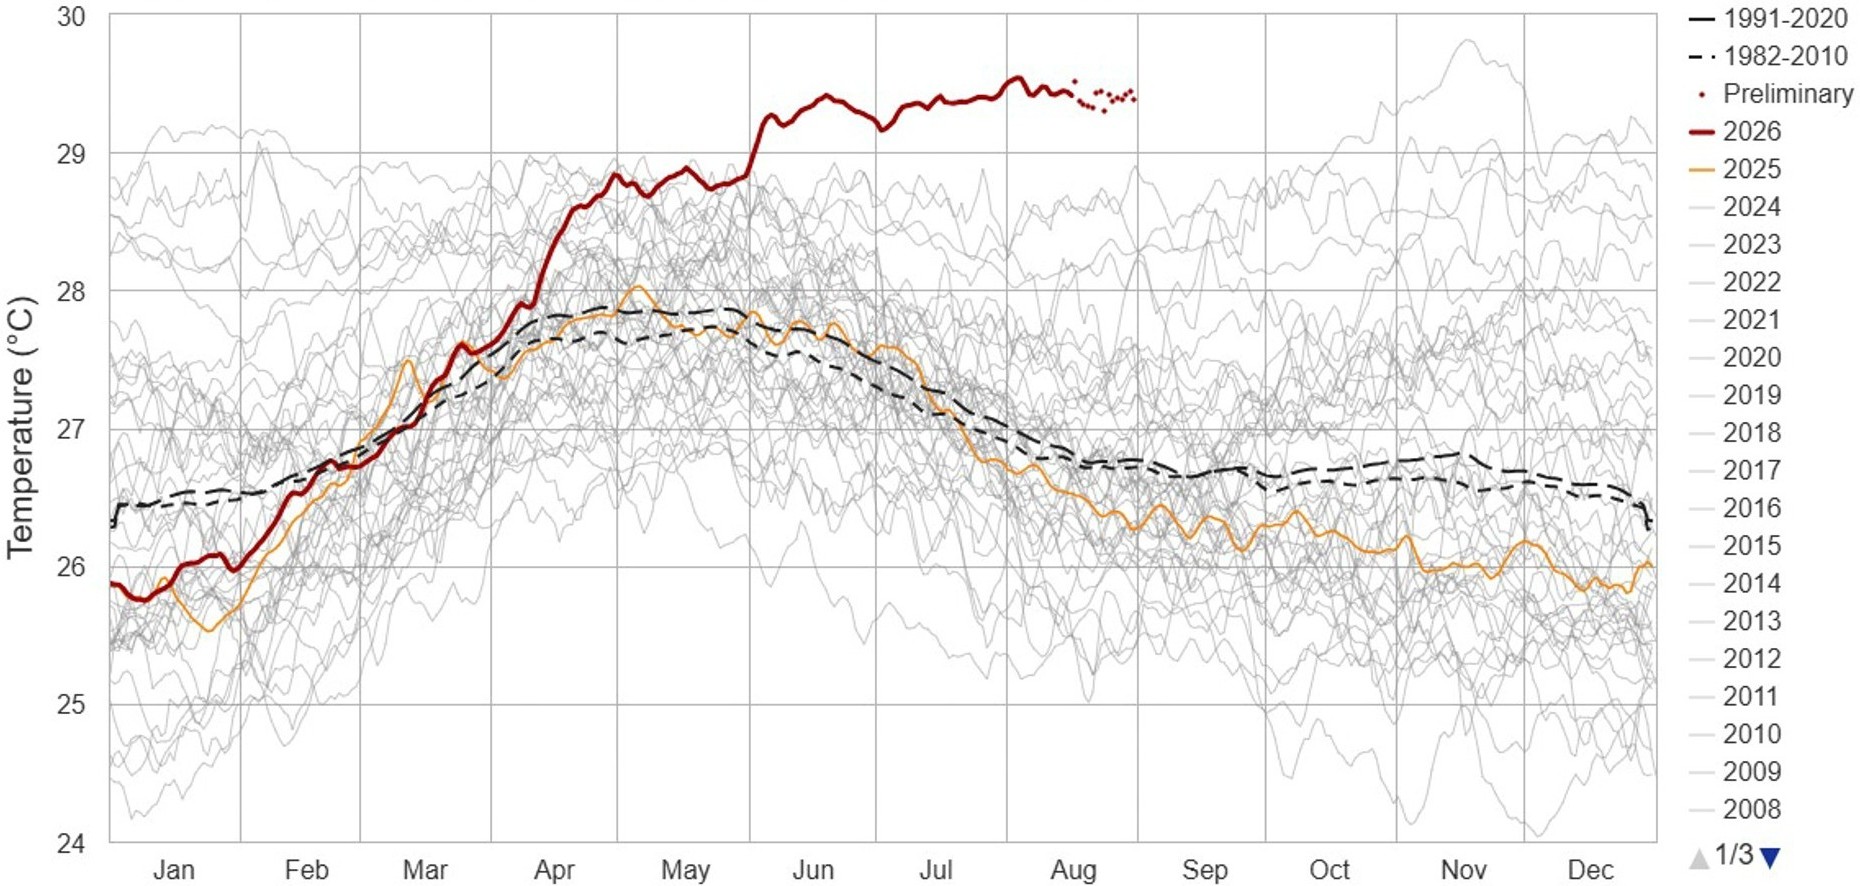
Source: Climate Reanalyzer, Climate Change Institute, University of Maine, as at 2 September 2026.
For investors, major El Niño events function as stress tests. They expose vulnerabilities that already exist within energy systems, infrastructure networks, insurance markets and supply chains, often accelerating trends that were already underway.
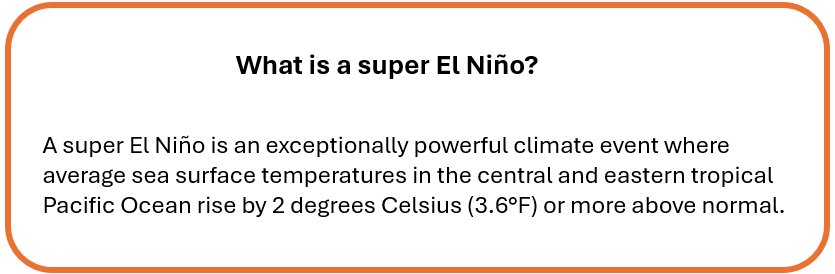
A stress test for a world with fewer normal years
Major El Niño events can potentially cause economic disruption that lingers long after the weather pattern fades. During the 2015–16 event, flooding disrupted mining in northern Chile, drought affected agriculture across parts of Southeast Asia and Australia, and hydropower systems came under pressure in several markets. In Indonesia, drought conditions contributed to severe peatland fires in Borneo, estimated to have caused around US$16 billion in economic damage, equivalent to roughly 1.9% of GDP1, and associated with an estimated 100,000 premature deaths across Indonesia, Malaysia and Singapore. These events expose dependencies on water, logistics and stable weather patterns, highlighting how physical disruptions can ripple through economies, supply chains and financial markets.
These episodes also challenge a broader assumption embedded in financial markets: that operating conditions will remain broadly stable over time. As climate systems spend less time within historical ranges and more time oscillating between extremes, forecasts based on past experience become less reliable. The result is a greater focus on tail risks, increasing the value of resilience and adaptability. For investors, the challenge extends beyond understanding the next El Niño, but in identifying which businesses can potentially continue to perform in a more volatile operating environment.
The current super El Nino is breaking records and is a direct result of a warming climate. Global markets have become narrowly focused on chasing AI riches and we believe rising physical climate risks are being mispriced. As climate volatility keeps on increasing, resilience will become an even more important source of long-term value creation.”
– Hamish Chamberlayne, Head of Global Sustainable Equities
When physical climate risk becomes financial risk
The economic consequences of climate-related disruption have long occupied an unusual position in financial markets. Most investors acknowledge the risk, yet incorporating it into valuations, financing costs and capital allocation decisions remains challenging because physical risk is abstract until it generates observable financial consequences.
This shift from physical disruption to financial consequence is already visible. Droughts affecting hydropower in parts of Asia and Latin America have exposed power markets’ dependence on stable water availability. Flooding in Chile has revealed vulnerabilities in global copper supply chains, while agricultural disruption continues to influence food prices, export revenues and financing decisions. Insurance is one of the clearest channels through which physical climate risk becomes financially visible. Changes in pricing, coverage and underwriting appetite can affect project economics, access to capital and asset values.
The insurability imperative
There is considerable nuance in the relationship between climate risk and insurance. Greater perceived risk can increase demand for protection, but losses do not translate mechanically into stronger insurance economics. What matters for investors is how risk is priced, retained and transferred.
A super El Niño brings existing vulnerabilities into sharper focus, particularly where climate risks remain poorly understood, underinsured or underestimated. Floods, droughts and storms expose vulnerabilities that often remain hidden during more stable periods, forcing households, businesses and governments to reassess how much risk they are carrying on their own balance sheets.
In many cases, these events expose substantial protection gaps. Insurance coverage has expanded over time, with more than 40% of global natural catastrophe losses insured on average over the past decade, compared with 23% in the mid-nineties2. Yet the gap remains significant. Research undertaken on behalf of the European Commission found that only around 20–30% of agricultural climate losses across Europe are currently insured. In emerging markets, up to 80-90% of catastrophe losses are uninsured3. Extreme events test whether these levels of retained risk remain sustainable.
Historically, periods of disruption have often been followed by greater insurance penetration, stronger demand for risk transfer and broader participation from insurers, reinsurers and capital markets. As climate volatility becomes more visible, demand is likely to broaden from additional coverage towards a wider range of risk-transfer solutions.
This widening need for protection creates opportunities across the insurance market. Insurance brokers are well placed as clients seek guidance in assessing exposures, strengthening their risk profiles and structuring increasingly complex insurance and reinsurance programmes. The growing role of capital markets provides another indication of this demand: alternative reinsurance capital reached a record US$121 billion in June 2025, while outstanding catastrophe bond volume rose 19% to US$55 billion4. We believe property and casualty insurers should also benefit, but rising demand alone is not enough. The investment case ultimately rests on disciplined pricing, risk selection, claims management and access to reinsurance, which help determine whether greater exposure can potentially translate into durable returns.
From climate transition to resilience transition
For much of the past decade, climate investing has been framed primarily through the lens of decarbonisation. The central question was how economies could reduce emissions while maintaining growth. That remains an important objective, but a super El Niño highlights a parallel challenge receiving increasing attention: how economies continue to function when physical climate volatility becomes a more persistent feature of the operating environment.
This shift broadens the focus of climate investing. Alongside reducing future climate risks, investors are increasingly paying attention to the systems that underpin economic activity, from insurance markets and electricity grids to industrial supply chains and critical infrastructure.
Energy systems provide one of the clearest examples. Drought conditions affecting hydroelectric generation have repeatedly highlighted the vulnerability of power markets that depend on stable water availability, while higher temperatures increase cooling demand. These pressures are increasing the value of resilience within power systems and reshaping how investors assess technologies such as battery storage, transmission networks and grid infrastructure. While these assets were initially championed for their role in reducing emissions, they are increasingly valued for the reliability, flexibility and adaptability they provide when conditions move outside historical norms.
The same resilience dynamic is visible across industrials and infrastructure. Weather-related disruptions often expose vulnerabilities that make spending on maintenance, automation, monitoring systems and critical infrastructure more attractive. Mining company Sandvik is a useful example. With roughly two-thirds of mining revenues derived from aftermarket activities, the company benefits not only from commodity production itself but from the need to improve the reliability and productivity of mining operations following periods of disruption. Similar dynamics can be observed across engineering and infrastructure businesses such as Jacobs and Stantec. Healthcare distributor McKesson’s extensive networks and temperature-sensitive supply chains further illustrate the value of facility resilience, cooling systems and operational redundancy.
Conclusion: Identifying the winners of a more volatile world
Extreme weather has a way of exposing assumptions that are rarely challenged during calmer periods. It reveals where infrastructure depends on stable climatic conditions, where supply chains lack flexibility, where risks remain uninsured and where resilience has been underinvested.
As climate change influences the frequency, intensity and persistence of these disruptions, the operating environment becomes less defined by stability and more by variability. As the climate system spends less time in the benign middle and more time oscillating between extremes, assumptions of stable operating conditions become harder to sustain. Resilience therefore becomes more than a defensive characteristic; it becomes a source of competitive advantage.
For investors, the opportunity lies in identifying the businesses that help economies absorb shocks, adapt to disruption and continue functioning when conditions move outside historical norms.
IMPORTANT INFORMATION
References made to individual securities do not constitute a recommendation to buy, sell or hold any security, investment strategy or market sector, and should not be assumed to be profitable.
1 Source: ‘Causes of Indonesia’s forest fires’, March 2020, World Development 127(2): 104717, DOI:10.1016/j.worlddev.2019.104717
2 Source: Carbon Brief, ‘How wildfires and storms drove insurance losses in 2025 – in three charts’, 31 March 2026.
3 Source: European Environment Agency, ‘Economic losses from weather- and climate-related extremes in Europe’, 14 October 2025.
4 Source: Reinsurance News, ‘Record $121bn alternative capital signals further growth in ILS market’, 28 August 2025.
Alternatives: An investment that is not included among the traditional asset classes of equities, bonds, or cash, such as property or infrastructure, hedge funds, commodities, private equity, art, derivatives, or cryptocurrencies.
Artificial intelligence (AI) is the capability of computers and machines to perform tasks that normally require human intelligence, such as learning, reasoning, problem-solving, and decision-making.
Balance sheet: A financial statement that summarises a company’s assets, liabilities, and shareholders’ equity at a particular point in time. Each segment gives investors an idea as to what the company owns and owes, as well as the amount invested by shareholders. It is called a balance sheet because of the accounting equation: assets = liabilities + shareholders’ equity.
Environmental, Social, and Governance (ESG) factors relate to the quality and functioning of the natural environment, the rights, well-being and interests of people and communities, and the governance of companies & their stakeholders.
Tail risk: Risk of an unlikely event that, if it occurs, has a disproportionately large negative impact on markets or portfolio returns.
Climate volatility: Financial and economic uncertainty arising from changing climate conditions and extreme weather events, which can affect company earnings, supply chains, asset values and economic growth.
These are the views of the author at the time of publication and may differ from the views of other individuals/teams at Janus Henderson Investors. References made to individual securities do not constitute a recommendation to buy, sell or hold any security, investment strategy or market sector, and should not be assumed to be profitable. Janus Henderson Investors, its affiliated advisor, or its employees, may have a position in the securities mentioned.
Past performance does not predict future returns. The value of an investment and the income from it can fall as well as rise and you may not get back the amount originally invested.
The information in this article does not qualify as an investment recommendation.
There is no guarantee that past trends will continue, or forecasts will be realised.
Marketing Communication.
Important information
Please read the following important information regarding funds related to this article.
- Shares can lose value rapidly, and typically involve higher risks than bonds or money market instruments. The value of your investment may fall as a result.
- Shares of small and mid-size companies can be more volatile than shares of larger companies, and at times it may be difficult to value or to sell shares at desired times and prices, increasing the risk of losses.
- The Fund follows a growth investment style that creates a bias towards certain types of companies. This may result in the Fund significantly underperforming or outperforming the wider market.
- Due to the Fund’s Sustainability Approach, it may exclude or invest less or more in certain companies and may therefore perform differently to funds that have a similar financial objective, but that do not have a binding Sustainability Approach. Political, regulatory or investor sentiment about sustainability initiatives may change over time and impact the Fund’s performance.
- Derivatives may be used with the aim of reducing risk or managing the portfolio more efficiently. However, this introduces other risks, in particular, that a derivative counterparty may not meet its contractual obligations.
- If the Fund holds assets in currencies other than the base currency of the Fund, or you invest in a share/unit class of a different currency to the Fund (unless hedged, i.e. seeks to mitigate exchange rate movements between the share/unit class currency and the base currency of the Fund), the value of your investment may be impacted by changes in exchange rates.
- When the Fund, or a share/unit class, seeks to mitigate exchange rate movements of a currency relative to the base currency (hedge), the hedging strategy itself may positively or negatively impact the value of the Fund due to differences in short-term interest rates between the currencies.
- Securities could become hard to value or to sell at a desired time and price, especially in extreme market conditions when asset prices may be falling, increasing the risk of investment losses.
- Losses could be incurred if a counterparty became unwilling or unable to meet its obligations, or as a result of failure or delay in operational processes or the failure of a third party provider.