
Key takeaways:
- US 10-year Treasury yields have historically always fallen below where they were at the date of the last rate hike (July 2023, 3.87%), in the period following the last hike. This history suggests two divergent paths to lower yields, with bond markets currently tracking the more frustrating path. If yields follow history and resume a downward path this sets up the potential for higher quality bonds to deliver both income and capital gain for investors in 2024.
- The disinflation trend remains intact (it was never going to be a straight line) and evidence suggests recent economic momentum in the US (US growth exceptionalism) may be waning.
- Adopting a global approach to investing means we can take a view on each region, expressing those views within the overall duration call.
Big picture view – history is on your side
The historical evidence from the US 10-year Treasury market is that when the central bank stops hiking and moves to easing mode this has been a good environment for sovereign bonds. This is the case whether you look at the period of persistent higher inflation in the 1970s or more recent history as shown below. The chart below separates change in yields into two historical periods: the 1969-81 period (characterised by rising and high inflation) and the 1984-2018 period (characterised by declining or low inflation). Overlaid is the most recent experience from July 2023.
Change in US 10-year Treasury yield after last rate hike
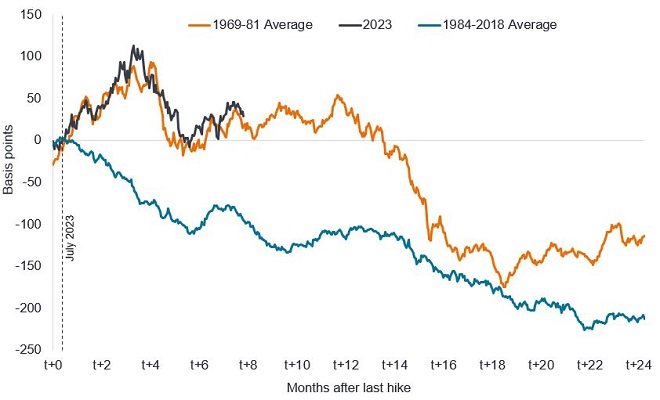
Source: Bloomberg, Janus Henderson calculations, 5 March 2024. Basis point (bp) equals 1/100 of a percentage point, 1bp = 0.01%. Past performance does not predict future returns. There is no guarantee that past trends will continue, or forecasts will be realised.
So far in 2024, bond yields have backed up from the two-month collapse in yields seen in November / December last year. This is not a huge surprise in the sense that markets rarely rally in a straight line. The performance of US 10-year yields since July 2023 (black line) has continued to track the average in the 1970s (orange line) with frightening precision (given that this is an average of three cycles). If bond markets continued to follow this more rangebound path, then bond yields would still provide income but the potential capital gains from a material decline in yields would not occur until Q3 2024. Conversely, we could reconnect to the 1984-2018 average path (blue line), which could see yields decline materially over the next 18 months.
This, together with an assessment of different economic factors and lead indicators, encourages us to favour a long duration stance. Recall that bond prices rise when yields fall, and vice versa, so a longer duration stance offers the potential to capture more capital gain if yields fall.
Duration – the essentials
Duration measures the sensitivity of a bond’s price or a fixed income portfolio’s price to changes in interest rates. It can be thought of as a measure of how long it takes, in years, for an investor to be repaid a bond’s price by the bond’s total cash flows. For example, a bond with a 5-year duration would typically see its bond price rise/fall 5% if interest rates fell/rose 1%. The longer a bond’s duration, the higher its sensitivity to changes in interest rates and vice versa. ‘Going short duration’ refers to reducing the average duration of a portfolio, while ‘going long duration’ refers to extending a portfolio’s average duration.
Where are we today?
In terms of what’s new so far this year, a few things stand out:
Very strong demand for core fixed income – this is seen in European government bond auctions where investor demand broke records, in terms of the amount by which bond issues were oversubscribed, while total bond sales across European governments and corporates reached a record €280 billion in January 2024.1 In addition, we have seen record US investment grade corporate bond supply (issuance), and investor demand more than matching it, given that credit spreads have continued to tighten through this period.2
The inflation story (ex-US) continues to firmly follow the expected disinflationary path with some big downside surprises in Australia and Switzerland. The month-on-month inflation rate in January for the US surprised to the upside. But this was a function of a historically unusual divergence of market rents and Owners’ Equivalent Rent (OER) – an estimation of the rent a property owner would pay if they had to rent their home – as well as higher asset prices (which meant that ‘portfolio management services’ added another 0.1% to inflation).3 It is hard to argue either of these are repeatable, or the beginning of a new inflation story. The bigger story remains for higher 12-month (year-on-year) core inflation rates to converge down to the weaker 6-month run rates given base effects whilst high (and lagging) rents in the inflation data continue on a path to converge down to actual market rent inflation seen in the last 12-18 months. We do not think one or two datapoints derails the core inflation trends, and we still expect US core Personal Consumption Expenditure (PCE) to be around 2.2% year-on-year (yoy) by June (note, the growing wedge between PCE which is the Fed’s preferred inflation measure and core Consumer Price Index (CPI), which we believe will likely be closer to 3% yoy by June 2024). There is no guarantee that past trends will continue, or forecasts will be realised.
Figure 2: New tenant rent index suggests rental inflation to head lower
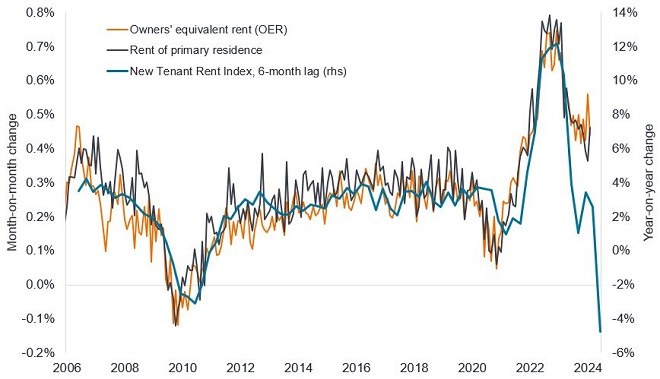
Source: LSEG Datastream, Bureau of Labor Statistics, Owners’ Equivalent Rent (OER), Rent of Primary Residence, month-on-month % change, New Tenant Rent Index, year-on-year % change, lagged by 6 months, February 2006 to February 2024. Rent of primary residence measures the change in rent for tenants who rent their home. The New Tenant Rent Index is a subset of CPI data that captures changes in rent for new tenants and has typically led other rent data. There is no guarantee that past trends will continue, or forecasts will be realised.
Growth momentum remains weak, with the exception of the US which has been the growth outlier since 2023. Most cyclical sectors continue to suggest a long bathtub shape recovery (i.e. extended trough). Growth indicators such as the ISM new orders and the Purchasing Manager Indices (PMIs) have picked up from low levels, yet the long lead indicators that we follow suggest that there is a risk of a head fake (false dawn). Historical instances of ISM new orders recovering back through 50 (a figure above 50 indicates expansion) when real money contraction was negative include 1957, 1970, 1980 and 1990. In those cases, the new orders index subsequently fell back below 45, with those relapses associated with recessions.4 Alongside that, we have not seen strong guidance from companies / industries during the recent earnings season to suggest a meaningful turn is here.
Evidence for our stance across different regions
While Figure 1 focused on the US due to the long data history, if we look globally there are opportunities for the portfolio where underlying growth momentum is weaker – this is critical as we believe that the rate of change in growth momentum drives bond yields.
- UK – the Bank of England (BoE) is seen by some as a potential laggard in rate cuts, with higher core inflation / wage growth than elsewhere. In the February meeting, the Monetary Policy Committee was split, with the majority of members (6) voting to hold rates, while two called for a rate hike and one for a rate cut. The labour market is loosening, which is not so visible in the official numbers due to a low response rate, but job vacancies have fallen for 20 consecutive months.5 In addition, UK firms did not see the profit margin expansion of US or Europe, so from that perspective they could be the first to cut jobs. It is also worth noting the pace of fiscal consolidation (downward change in government borrowing) in the UK this year is expected to be greater than that of the US or the Eurozone.6 In that regard, monetary policy may need to do more to stabilise the negative drag on the economy and we may see the BoE forced into more aggressive rate cuts later. Moreover, the UK is no longer an outlier on inflation. In fact, we believe UK headline CPI inflation could be below the 2% target by April / May, and could even hit 1.5% by the summer thanks to not only the reduction in the energy price cap, but also lower goods and food inflation. To us, the downside risks (to yields) are being underestimated. There is no guarantee that past trends will continue, or forecasts will be realised.
- Europe – we expect the European region to be at the forefront of rate cuts due to the extremely weak growth outlook, and rapid disinflation. This is unusual in that it is typical for central banks to follow the Fed, but it could well be that the Swiss National Bank and European Central Bank (ECB) move earlier. The debate is around when the first rate cut could occur with the doves favouring April and the more hawkish members of the ECB Governing Council favouring June. With all the concerns about fiscal largesse and excess bond supply, it is important to remember that in Germany, despite near zero economic growth, the commitment to fiscal discipline and aversion to increasing debt is high (the debt brake, which limits German government borrowing, is enshrined in law since 2009).
- Australia – the Reserve Bank of Australia (RBA) has been saying that additional rate hikes cannot be ruled out, but to us economic momentum is fading as evidenced by a string of inflation, employment and other misses in the economic data this year. The unemployment rate has risen by 0.6% from the lows.7 Employment is at risk of weakening more than expected as prior strong population growth feeds supply, while demand moderates. A second phase of the slowdown is via investment, from a slowing of public sector investment and soft private investment. The transmission of rate hikes to the economy should happen faster than elsewhere due to the housing market where mortgages are predominantly floating rate (i.e. not fixed for long terms so move with the change in interest rates).8 This is showing through in the change in real disposable income over the past 18 months, which is among the weakest in the OECD.9 The yield curve in Australia is firmly upward sloping beyond the short term, while 10-year yields are well above 2-year yields; this creates potential for enhanced income when the yield is hedged back into other currencies, such as GBP.10
Duration of the strategy
We have maintained duration at the top end of the range (circa 9 years) despite the more frustrating path that yields have followed (see Figure 1). In our view, this is the wrong time to be cutting duration because evidence is building that we are entering rate-cutting territory, which historically supports declining yields. Under the surface, we have rotated exposure around geographies in the developed world (and maturities) as reflected in Figure 3.
Figure 3: Portfolio duration for Strategic Bond Strategy (in years) – contribution by currency
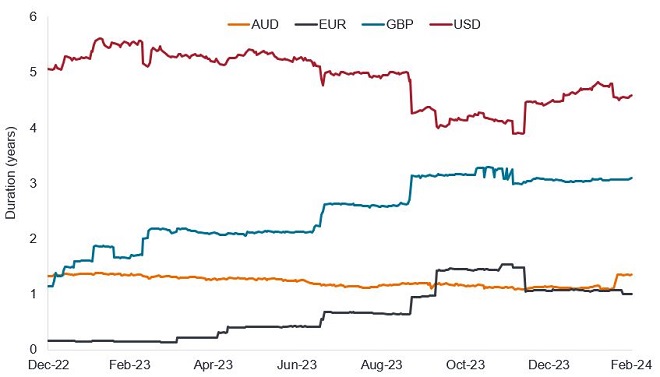
Source: Janus Henderson Investors, representative account of Janus Henderson Strategic Bond Strategy, as at 29 February 2024. AUD = Australian Dollar, EUR = Euro, GBP = British Pound, USD = US Dollar. Portfolio duration can vary over time.
Summary
We expect our long duration position has the potential to perform irrespective of whether we see a hard or soft landing for the economy, on the assumption that the downward trend in inflation allows central banks to move to easing policy.
Fixed income securities are subject to interest rate, inflation, credit and default risk. The bond market is volatile. As interest rates rise, bond prices usually fall, and vice versa. The return of principal is not guaranteed, and prices may decline if an issuer fails to make timely payments or its credit strength weakens.
There is no guarantee that past trends will continue, or forecasts will be realised.
1Source: Reuters, European debt sales break January record, 1 February 2024.
2Source: Bloomberg, ICE BofA US Corporate Index and ICE BofA Euro Corporate Index, year-to-date option-adjusted spreads to 29 February 2024. The ICE BofA US Corporate Index tracks the US dollar denominated investment grade corporate debt publicly issued in the US domestic market. The ICE BofA Euro Corporate Index tracks the EUR denominated investment grade corporate debt publicly issued in the Eurobond or Euro member domestic markets.
3Source: Bureau of Labor Statistics, January 2024 CPI data.
4Source: Money Moves Markets, Hard landing watch: US ISM Manufacturing Survey, October 2023.
5Source: LSEG Datastream, UK vacancies, latest figures to December 2023.
6Source: Morgan Stanley, UK Fiscal policy, 8 February 2024.
7Source: LSEG Datastream, Australia unemployment rate, June 2023 to January 2024.
8Source: Reserve Bank of Australia, Statement on Monetary Policy: Mortgage interest payments in advanced economies, February 2023.
9Source: OECD, Households’ economic well-being: the OECD dashboard, Household disposable income per capita, change between Q3 2022 and Q3 2023, February 2024.
10Source: Bloomberg, Janus Henderson calculations, 8 March 2024.
10-Year Treasury Yield is the interest rate on US Treasury bonds that will mature 10 years from the date of purchase.
Base effects: Distortions in year-on-year comparisons caused by an usually high or low reference point a year ago. These tend to wash out over time.
Core Personal Consumption Expenditure (PCE) Price Index is a measure of prices that people living in the US pay for goods and services, excluding food and energy. It is a measure of inflation.
Core fixed income: a term typically used to refer to investment grade government and corporate bonds.
Credit spread is the difference in yield between securities with similar maturity but different credit quality. Widening spreads generally indicate deteriorating creditworthiness of corporate borrowers, and narrowing indicate improving.
Cyclical: Companies or industries that are highly sensitive to changes in the economy, such that revenues generally are higher in periods of economic prosperity and expansion and are lower in periods of economic downturn and contraction.
Default: The failure of a debtor (such as a bond issuer) to pay interest or to return an original amount loaned when due.
Disinflation: A fall in the rate of inflation.
Duration: the sensitivity of a bond’s price to a change in interest rates.
Fiscal policy: Describes government policy relating to setting tax rates and spending levels. Fiscal consolidation or discipline is when a government seeks to reduce its borrowing by spending less or raising taxes, fiscal easing or largesse is the opposite.
Hawkish: An indication that policy makers are looking to tighten financial conditions, for example, by supporting higher interest rates to curb inflation. The opposite of dovish, which describes policymakers loosening policy, i.e. leaning towards cutting interest rates to stimulate the economy.
Inflation: The rate at which prices of goods and services are rising in the economy. Core inflation typically excludes volatile items such as food and energy prices. A common measure for inflation is the Consumer Price Index (CPI).
Investment grade bond: A bond typically issued by governments or companies perceived to have a relatively low risk of defaulting on their payments, reflected in the higher rating given to them by credit ratings agencies.
Lead indicator: A piece or set of economic data that can help provide an early signal of where we are in an economic cycle.
Maturity: The maturity date of a bond is the date when the principal investment (and any final coupon) is paid to investors. Shorter-dated bonds generally mature within 5 years, medium-term bonds within 5 to 10 years, and longer-dated bonds after 10+ years.
Monetary policy refers to the policies of a central bank, aimed at influencing the level of inflation and growth in an economy. It includes controlling interest rates and the supply of money. Monetary tightening refers to central bank activity aimed at curbing inflation and slowing down growth in the economy by raising interest rates and reducing the supply of money.
Purchasing Managers Indices (PMI) is a survey that acts as a leading insight into the prevailing direction of economic trends, based on the view of managers across different industries. The index is based on five indicators: new orders, inventory levels, production, supplier deliveries and the employment environment. The Institute for Supply Management (ISM) conducts a widely followed manufacturing PMI and Services PMI survey for the US.
The real interest rate is the rate of interest an investor, saver or lender receives after allowing for inflation.
Recession: A significant decline in economic activity (negative economic growth) lasting longer than a few months. A soft landing is a slowdown in economic growth that avoids a recession. A hard landing is a deep recession.
Term premium: In standard economic theory, yields on Treasury securities are composed of two components: expectations of the future path of short-term Treasury yields and the Treasury term premium. The term premium is defined as the compensation that investors require for bearing the risk that interest rates may change over the life of the bond. Since the term premium is not directly observable, it must be estimated.
Yield: The level of income on a security over a set period, typically expressed as a percentage rate. For equities, a common measure is the dividend yield, which divides recent dividend payments for each share by the share price. For a bond, at its most simple, this is calculated as the coupon payment divided by the current bond price.
Yield curve: A yield curve plots the yields (interest rate) of bonds with equal credit quality but differing maturity dates. Typically bonds with longer maturities have higher yields. An inverted yield curve occurs when short-term yields are higher than long-term yields.
US Treasury securities are direct debt obligations issued by the US Government. The investor is a creditor of the government. Treasury Bills and US Government Bonds are guaranteed by the full faith and credit of the US government, are generally considered to be free of credit risk and typically carry lower yields than other securities.
These are the views of the author at the time of publication and may differ from the views of other individuals/teams at Janus Henderson Investors. References made to individual securities do not constitute a recommendation to buy, sell or hold any security, investment strategy or market sector, and should not be assumed to be profitable. Janus Henderson Investors, its affiliated advisor, or its employees, may have a position in the securities mentioned.
Past performance does not predict future returns. The value of an investment and the income from it can fall as well as rise and you may not get back the amount originally invested.
The information in this article does not qualify as an investment recommendation.
There is no guarantee that past trends will continue, or forecasts will be realised.
Marketing Communication.