
Key takeaways:
- Thirty percent of the Russell Mid Cap Growth Index now trades above 10 times sales, requiring these companies to achieve sales growth that historically only a low single-digit percentage of firms have delivered organically.
- We believe the market is overpaying for growth, particularly for the most expensive stocks. The current premium is very wide relative to history and higher than discounted cash flow models suggest is appropriate.
- Fundamental investors face higher tracking error as stocks deviate further from fair value, but we see opportunity in double-digit growers outside the most expensive reaches of the growth index.
The performance concentration in highly valued mid-cap growth stocks has been remarkable. What does the data reveal?
The numbers are striking. Over the last three years, about half the Russell Mid Cap Growth Index’s return has come solely from stocks in the most expensive price-to-sales decile. The three most highly valued deciles have driven two-thirds of the index’s return.1
What’s even more telling is where valuations stand today. At the start of 2022, a stock needed to trade above 15 times sales to be in the top decile. Today, the cutoff is 22 times sales, and 30% of the benchmark now trades over 10 times sales.
To put that in perspective, for a company trading at 10 times sales to justify its valuation, it would need to compound sales at 20% per year organically to reach a 30% operating margin after 10 years. When we looked at 1,400 public companies with over $500 million in sales a decade ago, only 48 compounded sales at that pace. Most did so through acquisitions, not organic growth. Yet 30% of the benchmark trades at valuations that assume this kind of exceptional business performance.
How do you assess the current premium investors are paying for growth?
The market should pay a premium for growth – that’s rational. A faster grower deserves to trade at a higher multiple than a slower grower, all else equal. But that premium is not infinite, because today’s high-growth companies become tomorrow’s mature businesses.
One way to frame this is by asking: How much should the market pay for an extra point of revenue growth? Analysis shows the current premium is very wide relative to history and also high relative to what discounted cash flow (DCF) models suggest is appropriate. Simply put, we believe the market is overpaying for growth, especially for the most extreme growers in the top price-to-sales decile.
Exhibit 1: The impact of a one-point acceleration in revenue growth on forward P/E ratios (1965 through September 2025)
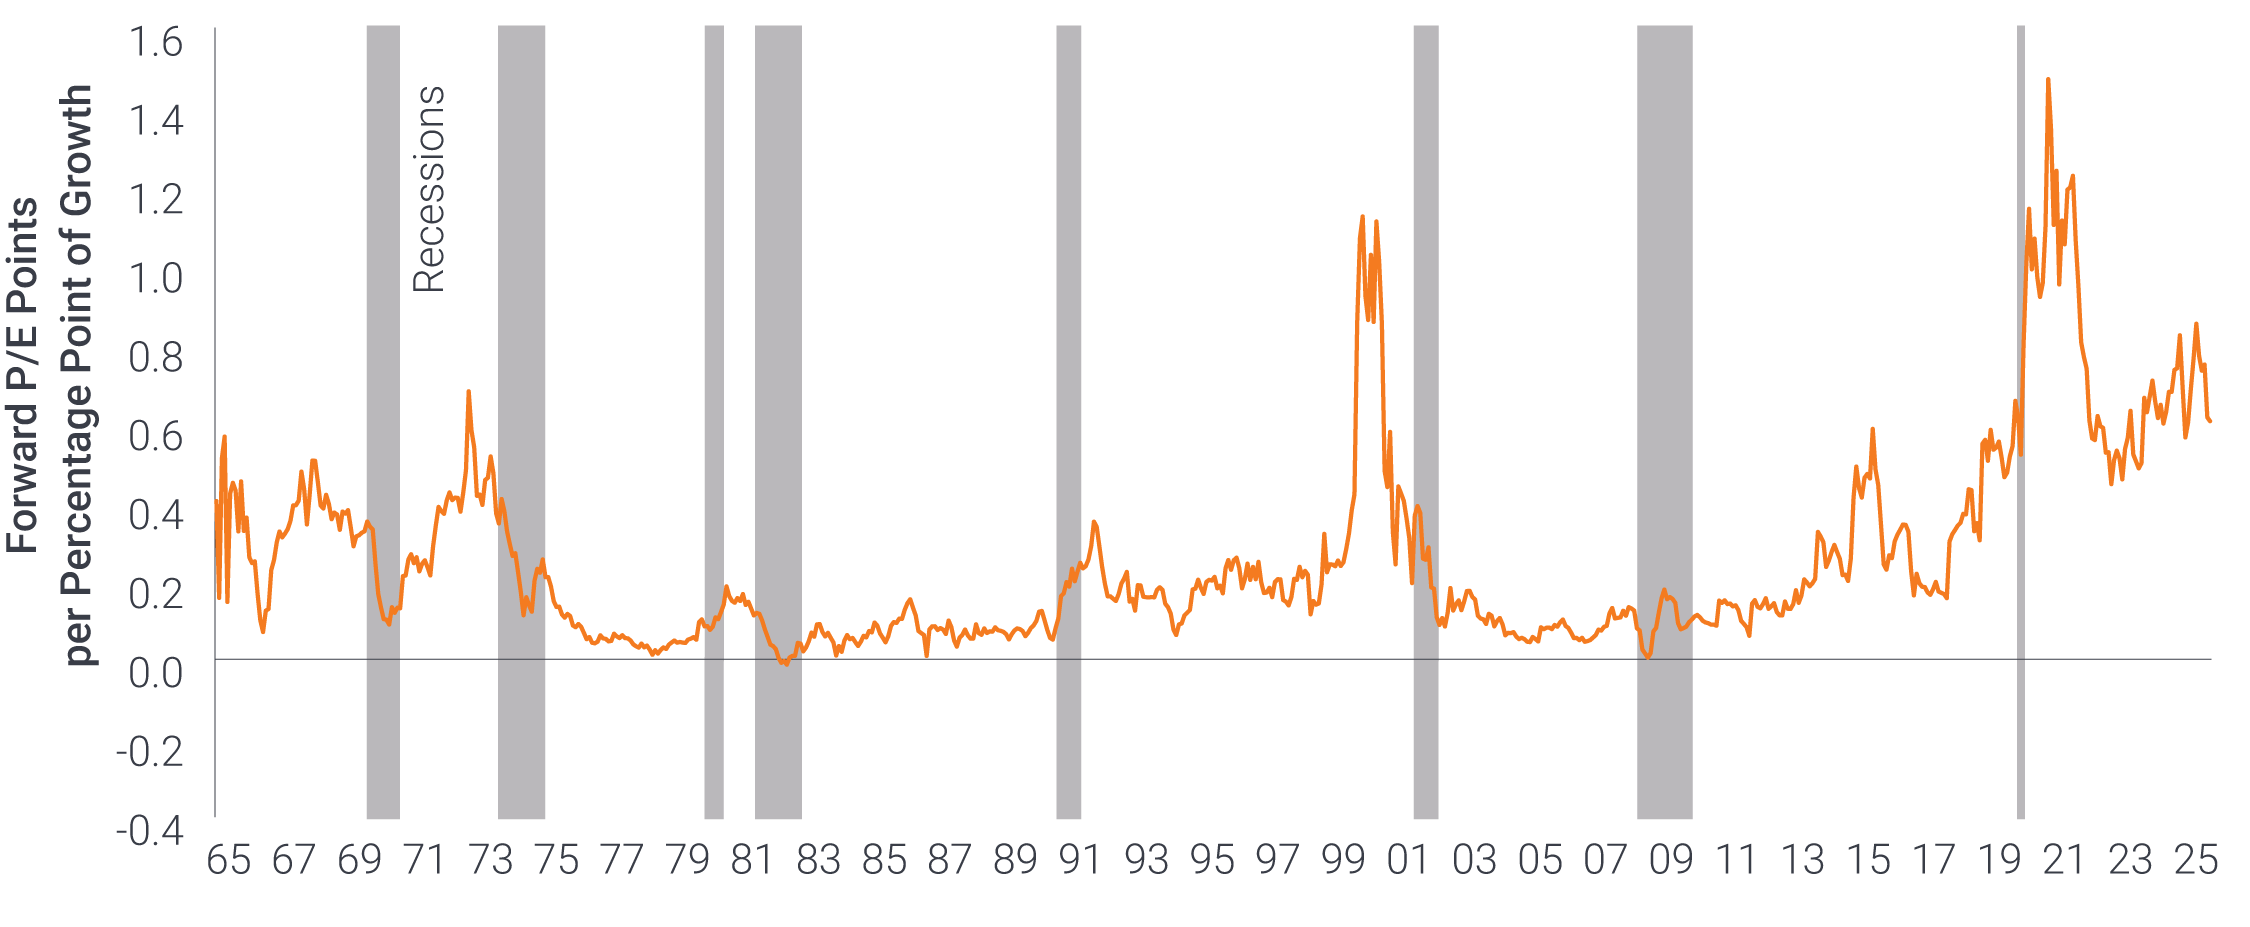
Source: National bureau of Economic Research, Empirical Research Partners Analysis, as of December 31, 2025. Note: Large capitalization stocks (excludes financials). Based on cross-sectional regression of forward P/E ratios onto trend revenue growth. Trailing P/Es are used before 1977. Trend revenue growth is five-year trailing growth rate, annualized.
We’ve only seen these valuation extremes three times in history: the Nifty Fifty era of the 1970s, the dot-com bubble, and now. Each time, growth as a factor subsequently underperformed for a sustained period.
The Nifty Fifty may be the better analogy for today than the dot-com era. During the dot-com period, stocks rocketed up and then crashed. But in the Nifty Fifty period, a cohort of blue-chip growth stocks performed well and then underperformed over a decade as their valuations returned to earth despite posting excellent growth. These were called “one-decision stocks” because they were considered so technologically advanced that they would compound forever. And they did compound revenue at double digits from 1973 to 1979, but their stock prices compounded at negative double digits during the same period.
We’re seeing pockets of this today. Companies like Airbnb, Workday, ServiceNow, and Atlassian have compounded revenue at an impressive pace since 2021, yet their stocks have been flat or down as multiples compressed.
Opportunities do emerge, however, if we widen the scope. We can find plenty of great growth companies in the mid-cap space that aren’t in the growth index – and we don’t have to pay the large premiums those index constituents command. There are 129 double-digit earnings growers in the Russell Mid Cap Growth Index and 222 in the Russell Mid Cap Value Index. Those double-digit growers in the value index may be purchased for 12 times lower price-to-earnings ratio, on average, than those in the growth index.
You’ve described significant valuation distortions. Has something fundamentally changed to justify why these premiums have persisted?
Fifteen years ago, when we sold a stock, the buyer was likely another long-term fundamental investor. Today that’s unlikely. According to research from Empirical Research Partners, retail investors now make up about a third of trading activity. Quantitative traders represent other 25%, with only about 10% coming from long-only fundamental investors like us.
Exhibit 2: U.S. stocks estimated shares of trading volume by constituency Q1 2025
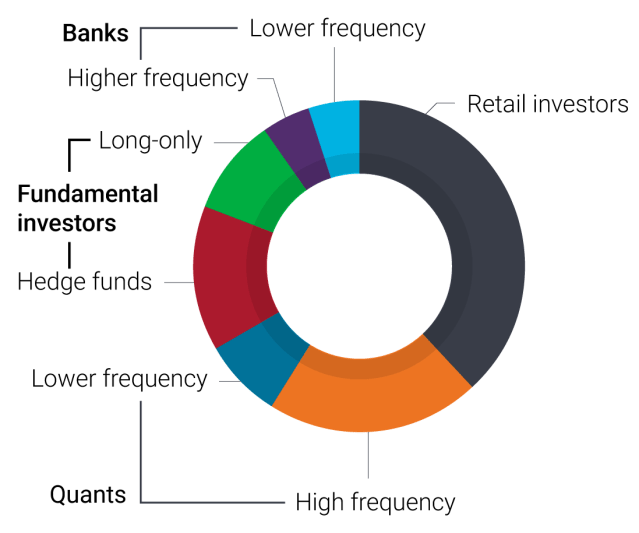
Source: Bloomberg L.P., Empirical Research Partners Analysis. Excludes market makers and high-frequency traders. Data as of 31 March 2025.
This shift has happened for clear reasons. Retail market activity exploded with zero-commission trading and a more speculative mindset among younger investors. Quantitative strategies have grown as more computing power and alternative data have become available. And multi-manager hedge funds have expanded due to solid performance, though they trade with shorter time horizons and use leverage.
The market is a complex adaptive system, and changes in the makeup of participants can lead to new behavior patterns. Take momentum as an example: Momentum has always existed in markets but was historically kept in check by valuation-conscious fundamental investors who tend to sell into strength. Today, many market participants, including retail traders, quants, and hedge funds, invest in ways that amplify momentum. I believe this helps explain why we’ve seen such a momentum-driven market in recent years.
How does this market structure affect your approach as a long-term fundamental investor?
This structure creates both challenge and opportunity. Most other participants are short-term and pro-cyclical, which means there’s opportunity to take the other side. However, we should expect higher tracking error, as stocks will deviate further from fair value and stay there longer because there are fewer fundamental investors to drive them back to long-term fair value.
That said, two forces still tether stocks to fundamentals over time. First, momentum cuts both ways: When it reverses, often due to changing fundamentals, the corrections can be sharp. Second, corporate actions act as constraints. Overvalued companies issue stock, while undervalued companies buy back shares aggressively or even go private. If a stock with durable fundamentals gets cheap enough that capital returns alone provide a solid return, it can find a bottom. Conversely, if a stock gets expensive enough, dilutive equity issuance can act as a ceiling.
As fundamental investors committed to rigorous research, I believe we’re positioned for a period where our approach can thrive in this new market environment. But the ride will likely be bumpier along the way, with greater performance dispersion relative to the market.
1 Source: FactSet as of December 2025. JHI analysis.
Russell Midcap® Growth Index reflects the performance of U.S. mid-cap equities with higher price-to-book ratios and higher forecasted growth values.
Russell Midcap® Value Index reflects the performance of U.S. mid-cap equities with lower price-to-book ratios and lower forecasted growth values.
Tracking Error is the divergence between the price behavior of an investment and an index.
Discounted Cash Flow (DCF) analysis is a valuation method used to estimate the attractiveness of an investment opportunity. DCF analysis uses future free cash flow projections and discounts them (most often using the weighted average cost of capital) to arrive at a present value, which is used to evaluate the potential for investment. If the value arrived at through DCF analysis is higher than the current cost of the investment, the opportunity may be a good one.
Price-to-Earnings (P/E) Ratio measures share price compared to earnings per share for a stock or stocks in a portfolio.
These are the views of the author at the time of publication and may differ from the views of other individuals/teams at Janus Henderson Investors. References made to individual securities do not constitute a recommendation to buy, sell or hold any security, investment strategy or market sector, and should not be assumed to be profitable. Janus Henderson Investors, its affiliated advisor, or its employees, may have a position in the securities mentioned.
Past performance does not predict future returns. The value of an investment and the income from it can fall as well as rise and you may not get back the amount originally invested.
The information in this article does not qualify as an investment recommendation.
There is no guarantee that past trends will continue, or forecasts will be realised.
Marketing Communication.