
Key takeaways:
- The U.S. consumer has been portrayed as stressed, but we still see a fundamentally positive environment. Credit card spending data show stable to slightly accelerating trends that do not support expectations of a broad consumer pullback.
- Despite inflationary pressure stemming from higher energy prices, we see three underappreciated supports for spending: a less energy-intensive economy, a stable labor market and three years of real wage growth, and household balance sheets that are in generationally strong shape.
- We believe near-term uncertainty has created attractive entry points in consumer discretionary. Restaurants, retail, and travel-related companies are now trading below historical valuation ranges despite earnings growth in line with long-term norms.
Media coverage has portrayed the U.S. consumer as increasingly cautious and stressed, even as actual spending has remained stronger than sentiment would suggest. The conflict in the Middle East has pushed energy prices higher, and that raises the question: Will households eventually pull back, and if so, what would that mean for company earnings and economic growth?
When we assess the overall health of consumer spending and weigh the factors that support it, we still see a fundamentally positive environment. The picture that emerges from credit card transactions, labor market trends, and household balance sheets is not one of a consumer on the brink; it is one of a healthy consumer who is adjusting, reallocating, and continuing to spend.
What the spending data shows
One of the more useful gauges of consumer health comes from credit card spending data, which captures activity across income levels and categories in real time. Visa and MasterCard both provided updates in late May. Their message was consistent: Spending trends are stable to slightly accelerating.
Visa described an “enormous amount of resilience” across discretionary and nondiscretionary categories, across all spending bands, with slight improvement continuing through mid-May and beyond. MasterCard reported continued growth into May, with consumers making adjustments between categories. These trends indicate that consumers are not pulling back but shifting somewhat toward nondiscretionary purchases as energy prices rise.
That distinction matters. We are not seeing distress; we are seeing budgeting. This is particularly true for households where gasoline can represent a larger share of monthly spending. But the majority of U.S. consumers have been able to manage the increase in gas prices and have not meaningfully reduced overall spending. We don’t think pockets of strain automatically translate into a broader consumer collapse.
Three underappreciated supports
There are three factors supporting consumer health that are often overlooked. First, the U.S. economy is dramatically less energy-intensive than it used to be. Compared with the 1980s, 1990s, 2000s, or even 2010s, households and businesses require meaningfully less energy per dollar of economic activity. Renewables have grown steadily in the energy mix, and fuel efficiency mandates have raised miles per gallon standards for vehicles over the past decade and a half.
For the typical household, gasoline represents roughly 3% to 4% of total spending. A sharp run-up in prices delivers a shock of hundreds of basis points on that line item – uncomfortable, but manageable for most consumers.
Second, wages have outpaced inflation since 2022. That margin has narrowed recently, but the cumulative effect of three years of positive real wage growth has strengthened purchasing power (Exhibit 1). What’s more, unemployment remains low at 4.3%, and job openings remain substantial. It is a labor market with low velocity – not a lot of job creation or losses – but one that is stable and not deteriorating. Furthermore, the fears that artificial intelligence (AI) could rapidly cannibalize employment have not shown up in the aggregate data.
What has shown up is productivity: The economy continues to post strong productivity gains, increasingly amplified by AI adoption across industries well beyond technology. Consumer companies that deploy AI effectively in operations and customer engagement are already seeing the benefits. Productivity-driven wage growth directly supports purchasing power.
Exhibit 1: U.S. real average hourly earnings
Real wage growth has accumulated over the last three years.
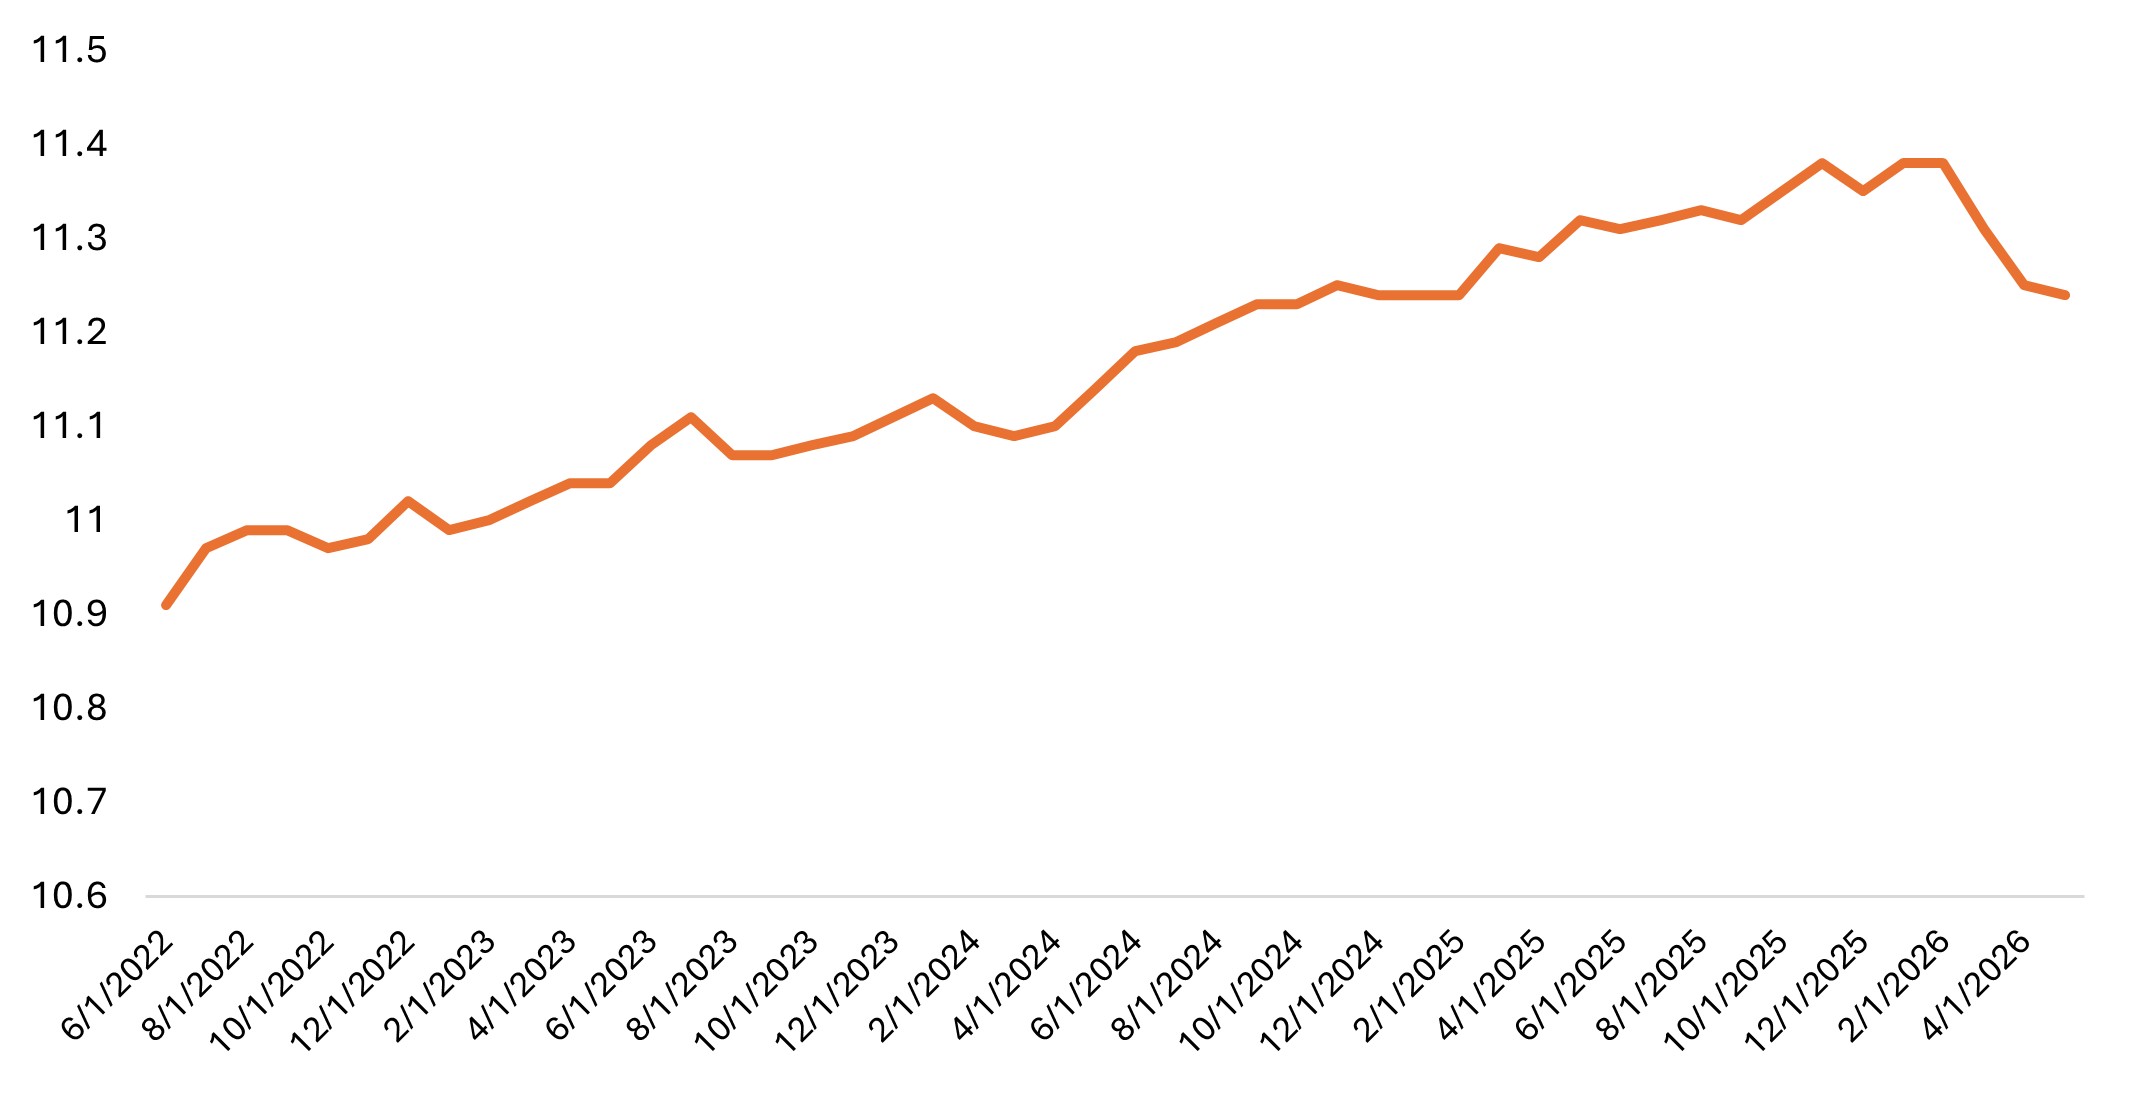
Source: Bloomberg, Bureau of Labor Statistics. Private Nonfarm Employees, Seasonally Adjusted.
Third, household balance sheets are in generationally strong shape (see Exhibit 2). Nearly 40% of owner-occupied homes carry no mortgage debt whatsoever. Household equity in residential real estate is at historically elevated levels. In addition, years of compounding equity market gains have created a meaningful wealth effect.
Further, higher interest rates, often discussed as a pure headwind, are actually a net benefit for households with more assets than liabilities. Those households earn more on their cash and fixed-income holdings.
Exhibit 2: Household debt service ratio
Debt service burden as a share of disposable income has remained well below historical averages.
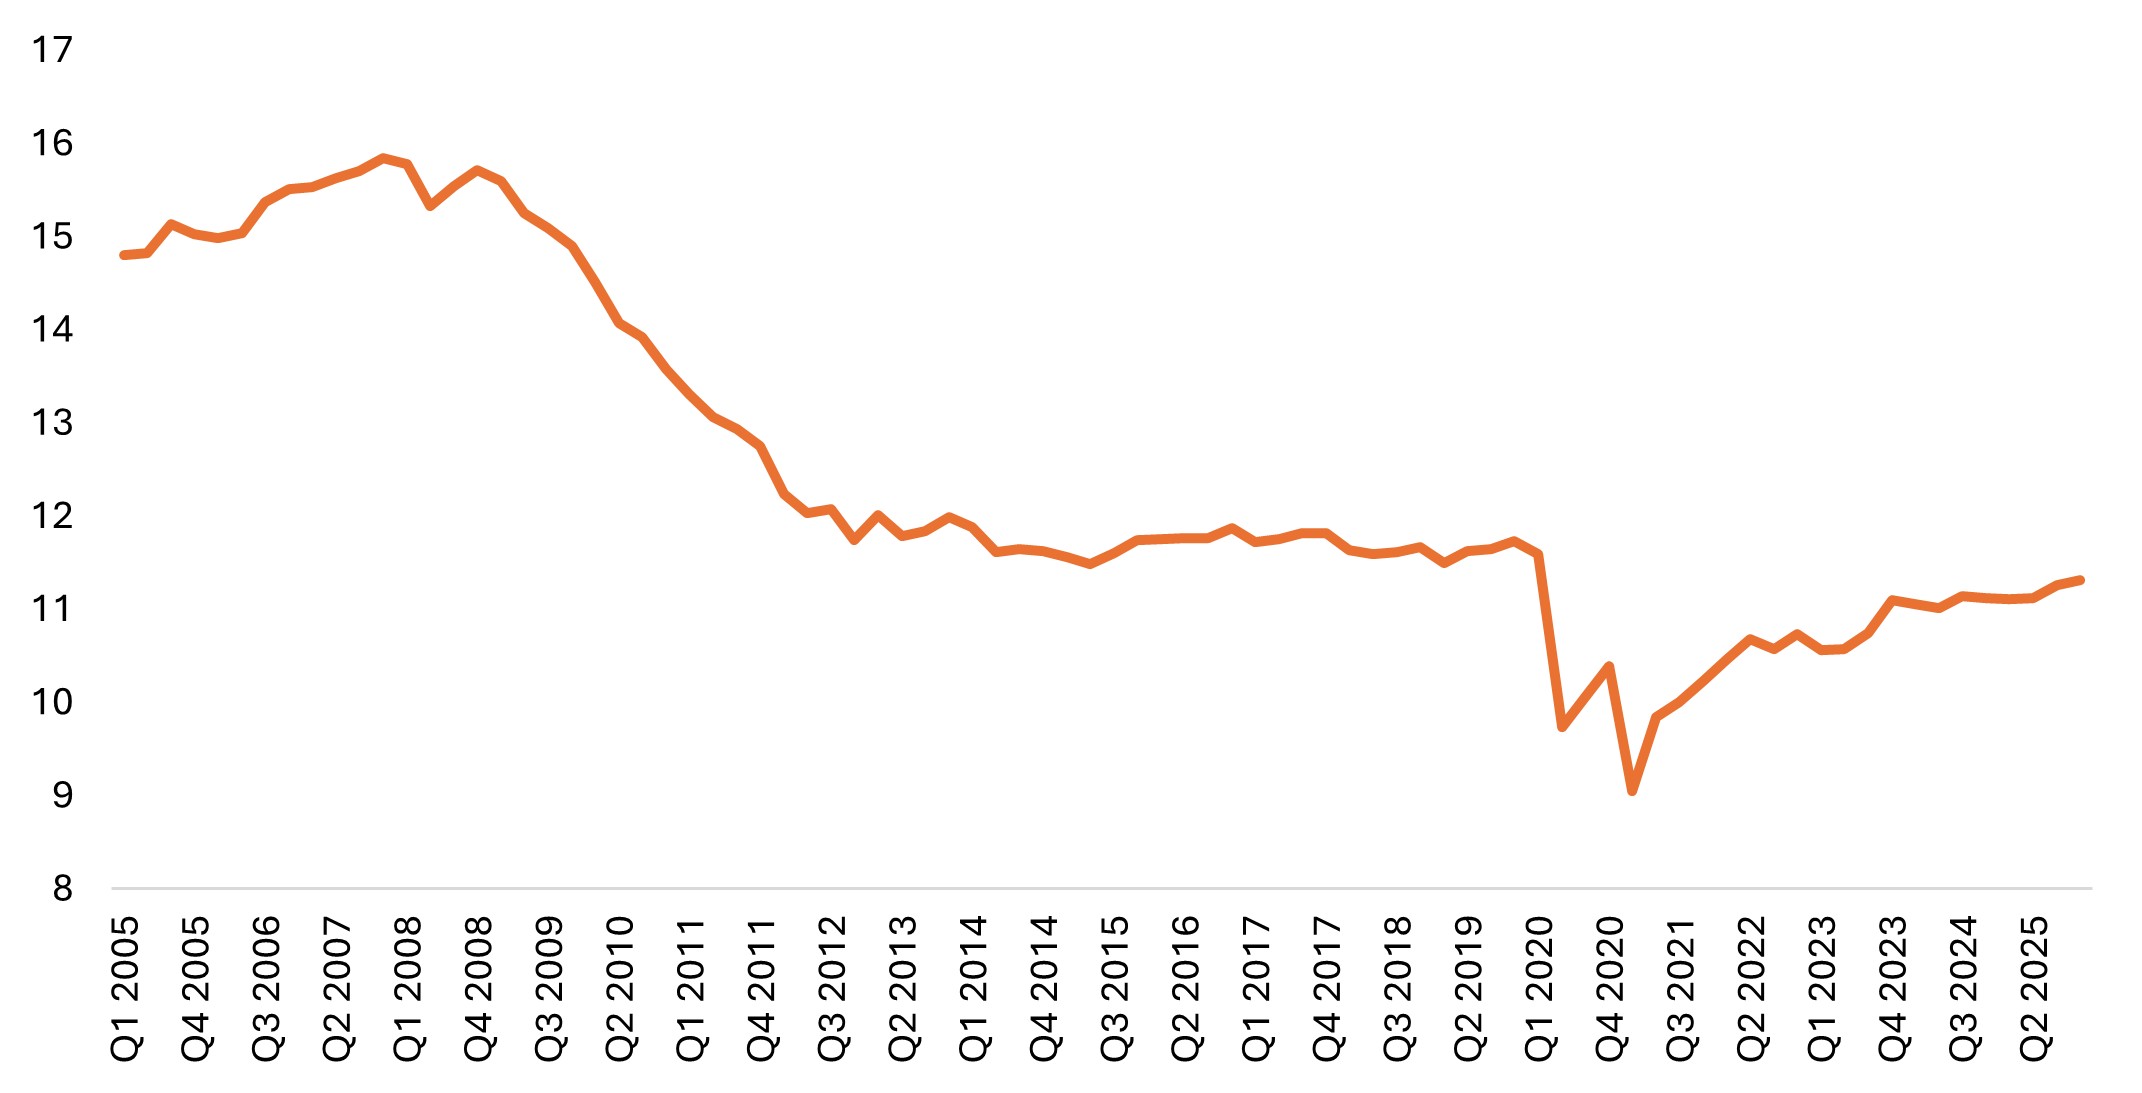
Source: Federal Reserve. Household debt service payments as a percentage of disposable personal income; seasonally adjusted. Combined mortgage and consumer debt service ratio. Last update: March 20, 2026.
Where we see opportunity
The uncertainty around inflation and energy has led to multiple compression across parts of the consumer sector. We have been finding attractive value in consumer discretionary companies during the pullback, particularly in restaurants, retail, and travel-related names. Several of these companies now trade below their historical valuation ranges despite earnings growth that remains in line with long-term norms and business models that are unlikely to be disrupted by AI.
Part of the reason behind this is that consumer preference for experiences – travel, dining, live entertainment – over physical goods has been building for years. We’ve been tracking the trend with our own classification method (see Exhibit 3). The preference for experiences was interrupted only by pandemic lockdowns and has since resumed with no signs of slowing. Travel-oriented companies continue to report strong demand, with weakness concentrated in the Middle East region – providing some evidence that travelers are simply redirecting spending elsewhere. These trends suggest that people would rather spend on the next trip than on upgrading household products.
Exhibit 3: Goods vs. Experiences (JHI-defined) – $USD
As a percentage of personal consumption expenditures (PCE), experiences remain a clear preference over goods.
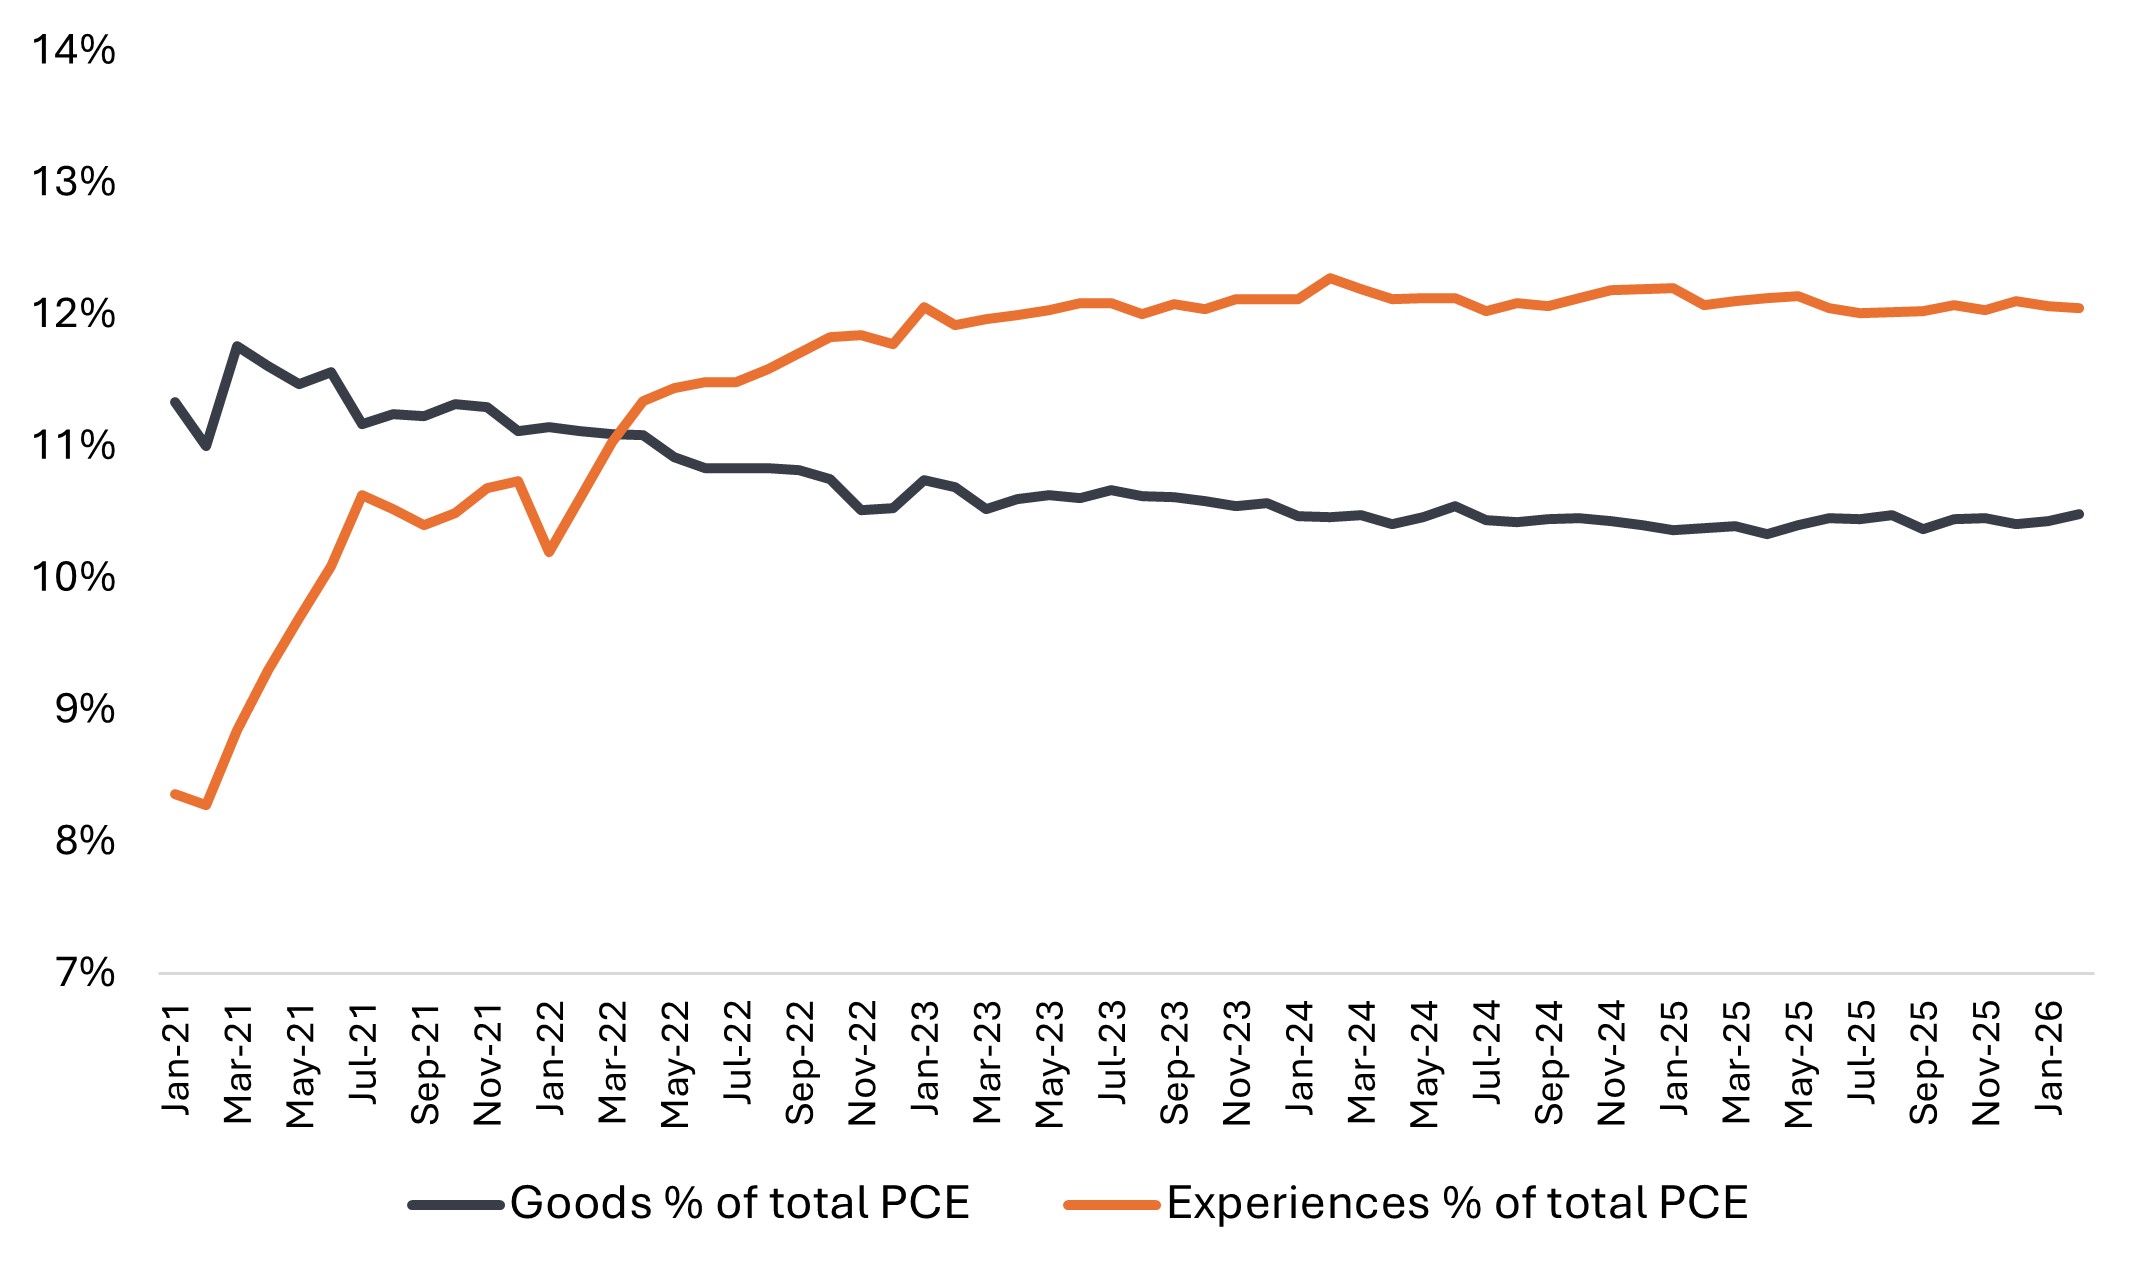
Source: Janus Henderson Investors analysis and classification. Data from U.S. Bureau of Economic Analysis. PCE is Personal Consumption Expenditures. From January 2021 to February 2026.
Reasons for confidence
Overall, we remain constructive on the consumer but also selective and watchful.
Not every consumer is in the same position. Some households are managing the current environment comfortably, while others are feeling more pressure. A prolonged conflict that keeps oil sustained at elevated levels could be a real constraint on economic growth – which reinforces the importance of being selective and focusing on companies aligned with where consumer spending remains strongest.
Higher energy prices have tempered some of the potential upside for consumer-driven economic growth. But the underlying supports – household balance sheets, real wage growth, and a stable labor market – remain intact. For investors willing to look past near-term uncertainty, we believe consumer-facing equities continue to offer attractive growth opportunities.
IMPORTANT INFORMATION
Basis point (bp) equals 1/100 of a percentage point. 1 bp = 0.01%, 100 bps = 1%.
Consumer discretionary industries can be significantly affected by the performance of the overall economy, interest rates, competition, consumer confidence and spending, and changes in demographics and consumer tastes.
Consumer staples industries can be significantly affected by demographics and product trends, competitive pricing, food fads, marketing campaigns, environmental factors, and government regulation, the performance of the overall economy, interest rates, and consumer confidence.
These are the views of the author at the time of publication and may differ from the views of other individuals/teams at Janus Henderson Investors. References made to individual securities do not constitute a recommendation to buy, sell or hold any security, investment strategy or market sector, and should not be assumed to be profitable. Janus Henderson Investors, its affiliated advisor, or its employees, may have a position in the securities mentioned.
Past performance does not predict future returns. The value of an investment and the income from it can fall as well as rise and you may not get back the amount originally invested.
The information in this article does not qualify as an investment recommendation.
There is no guarantee that past trends will continue, or forecasts will be realised.
Marketing Communication.
- Shares/Units can lose value rapidly, and typically involve higher risks than bonds or money market instruments. The value of your investment may fall as a result.
- An issuer of a bond (or money market instrument) may become unable or unwilling to pay interest or repay capital to the Fund. If this happens or the market perceives this may happen, the value of the bond will fall.
- When interest rates rise (or fall), the prices of different securities will be affected differently. In particular, bond values generally fall when interest rates rise (or are expected to rise). This risk is typically greater the longer the maturity of a bond investment.
- The Fund invests in high yield (non-investment grade) bonds and while these generally offer higher rates of interest than investment grade bonds, they are more speculative and more sensitive to adverse changes in market conditions.
- If a Fund has a high exposure to a particular country or geographical region it carries a higher level of risk than a Fund which is more broadly diversified.
- The Fund may use derivatives to help achieve its investment objective. This can result in leverage (higher levels of debt), which can magnify an investment outcome. Gains or losses to the Fund may therefore be greater than the cost of the derivative. Derivatives also introduce other risks, in particular, that a derivative counterparty may not meet its contractual obligations.
- When the Fund, or a share/unit class, seeks to mitigate exchange rate movements of a currency relative to the base currency (hedge), the hedging strategy itself may positively or negatively impact the value of the Fund due to differences in short-term interest rates between the currencies.
- Securities within the Fund could become hard to value or to sell at a desired time and price, especially in extreme market conditions when asset prices may be falling, increasing the risk of investment losses.
- Some or all of the ongoing charges may be taken from capital, which may erode capital or reduce potential for capital growth.
- The Fund could lose money if a counterparty with which the Fund trades becomes unwilling or unable to meet its obligations, or as a result of failure or delay in operational processes or the failure of a third party provider.
- In addition to income, this share class may distribute realised and unrealised capital gains and original capital invested. Fees, charges and expenses are also deducted from capital. Both factors may result in capital erosion and reduced potential for capital growth. Investors should also note that distributions of this nature may be treated (and taxable) as income depending on local tax legislation.