
Key takeaways:
- Dividend-focused stocks have outperformed growth stocks over the past 25 years, underscoring the long-term role of compounding dividends in building wealth.
- Historically narrow market leadership has created broad income opportunities, with nine of 11 S&P 500 sectors now offering dividend yields above the overall index.
- Despite concerns about higher interest rates, dividend-paying, lower-valuation stocks may be less rate-sensitive than growth stocks while helping investors balance portfolios heavily geared toward capital gains.
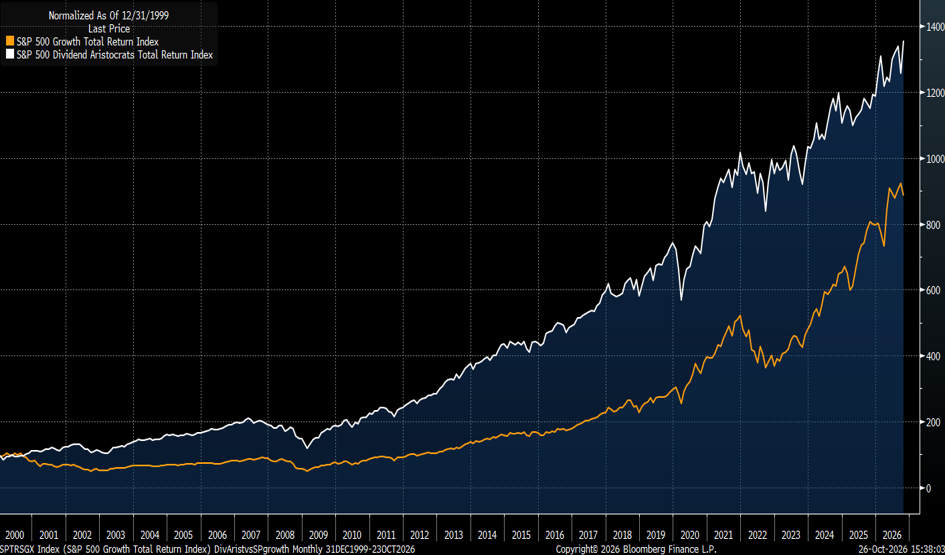
Investors seem to have forgotten about the benefits of investing for dividend yield, despite compounding dividends having long been one of the simplest ways to build wealth over time. Exhibit 1 shows the compounded total return of the S&P 500 Dividend Aristocrats® versus the total return of the S&P 500® Growth Index since year end 1999.
Growth investing has been popular, and growth stocks certainly get more attention than dividend stocks, but the Dividend Aristocrats® Index has nonetheless handily outperformed growth stocks for more than 25 years.
Exhibit 1: S&P 500 Dividend Aristocrats ® vs S&P 500® Growth Index (Dec 31, 1999 – Oct 22, 2026)
Source: Bloomberg Finance L.P. RBA/JHI.
Narrow leadership = Broad dividend yield
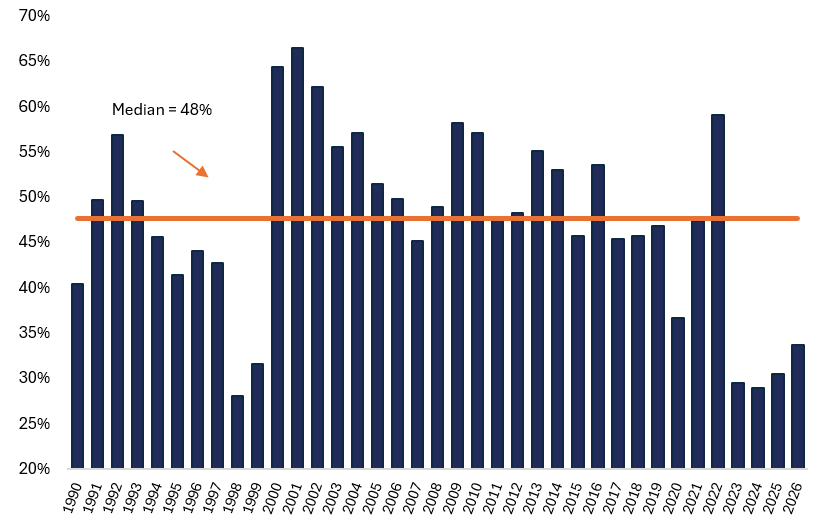
The stock market has been historically narrow over the past several years. Exhibit 2 shows the percent of S&P 500® Index companies that have outperformed the index each year since 1990 (and year to date for 2026). The period from 2023-2025 was the narrowest market in the history of the data, with only 30% of S&P 500 stocks outperforming the overall market over the three-year period.
Exhibit 2: S&P 500: Percentage of stocks that outperformed the Index (1990 – 30 September 2026)
Source: RBA/JHI, BofAML U.S. Strategy.
The counterbalance to extremely narrow leadership is that superior dividend yield is now broadly available. Table 1 shows the current indicated annual dividend yield of each S&P 500 economic sector as of October 21, 2026.
Nine of the 11 S&P 500 sectors now offer dividend yields greater than that of the overall market. If one agrees that dividend investing is an important component to wealth building, then there appears to be a broad universe of stocks from which to choose.
Table 1: Annual dividend by sector
| Sector | Dividend Yield |
| Real Estate | 3.36% |
| Utilities | 2.85% |
| Consumer Staples | 2.48% |
| Energy | 2.23% |
| Materials | 1.78% |
| Health Care | 1.44% |
| Financials | 1.40% |
| Communication Services | 1.33% |
| Industrials | 1.08% |
| S&P 500® | 0.98% |
| Consumer Discretionary | 0.84% |
| Technology | 0.47% |
Note: Dividend yield is the indicated annual dividend yield for each representative Sector SPDR and for the S&P 500®. Source: Bloomberg Finance L.P.
Investors’ portfolios seem heavily geared toward capital gains, not income
After the Global Financial Crisis (GFC), investors became very risk averse, largely because the S&P 500 and NASDAQ total returns were down more than 45% from 31 October 2007 to 31 March 2009. Their losses and accompanying fear of capital risk led investors to structure portfolios for dividend yield. That preference for “safe” yield continued for many years, even as the bull market charged ahead.
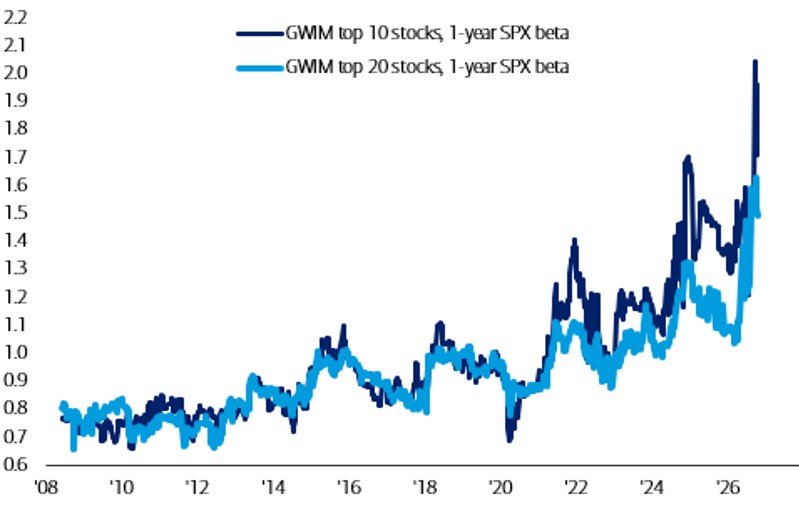
Exhibit 3 depicts how investors’ post-GFC preference for safety has morphed into extreme risk taking. The chart, courtesy of Bank of America Securities and reprinted with permission, shows the equity beta of individual investors’ largest equity positions.
Beta measures non-diversifiable market-related risk within the context of a well-diversified portfolio. A beta of 1.0 suggests that the portfolio moves in tandem with the overall equity market. A beta less than one typically indicates a more conservative portfolio with less volatility than the overall market. A beta greater than one suggests a more aggressive portfolio that has more volatility than the overall market.
Reflecting the post-GFC conservatism, individual investors’ favored equities had a combined beta of roughly 0.75 in the years after the GFC. Dividend-yielding stocks tend to have lower betas because the cash received via dividends is, somewhat obviously, lower volatility than the overall equity market.
Investors’ willingness to take on additional portfolio risk is depicted by the rising lines in the chart, and the combined beta of individuals’ favorite stocks is now a mind-boggling 1.5. In other words, individual investors are taking roughly twice the market risk they were willing to take 15 years ago.
Exhibit 3: Top 10 and Top 20 GWIM Stocks, 1-YR Beta to SPX
Source: BofA Global Research. Reprinted by permission. Copyright © 2025 Bank of America Corporation (“BAC”). The use of the above in no way implies that BAC or any of its affiliates endorses the views or interpretation or the use of such information or acts as any endorsement of the use of such information. The information is provided “as is” and none of BAC or any of its affiliates warrants the accuracy or completeness of the information.
Dividend stocks are not necessarily bond proxies
Because long-term interest rates have recently risen, some investors have questioned whether higher-yielding stocks should be thought of as bond proxies and could be more sensitive to changes in interest rates than growth stocks. However, history suggests the opposite is true.
Much as a 5-year coupon-bearing note has a shorter duration (i.e., lower interest-rate sensitivity) relative to a 30-year zero-coupon bond, a lower P/E higher-yielding stock has less interest-rate sensitivity than a high P/E zero-yield stock.
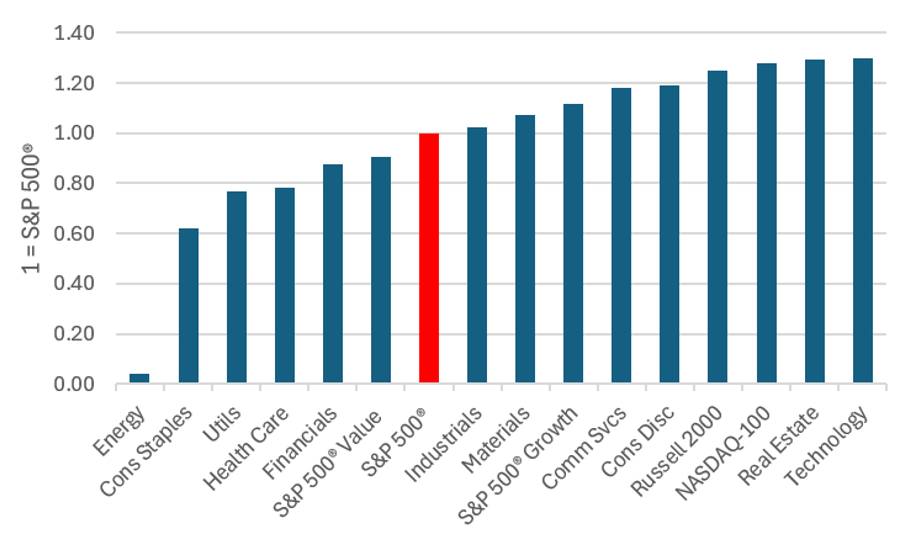
Exhibit 4 shows the interest-rate sensitivity of each S&P 500 economic sector and selected equity indices based on monthly total returns over the past five years. The overall equity market is, of course, sensitive to interest rates, so the interest-rate sensitivities in the graph are shown relative to the S&P 500 to gauge whether a sector is more or less sensitive than the overall market.
Several points are worth noting:
- Supporting the duration comment earlier, growth stocks appear more interest-rate sensitive than value stocks.
- Utilities, typically considered bond proxies, might indeed be bond proxies, but they are short-duration bond proxies. The sector is less interest-rate sensitive than the overall equity market.
- Small stocks, as depicted by the Russell 2000 Index, are indeed quite interest-rate sensitive, as many assert, but the NASDAQ-100, an index that is often thought of as being insensitive to rates, is more sensitive than small caps.
Exhibit 4: Sensitivity to 10-year interest rates (scaled to 1.0 = S&P 500 sensitivity*)
Source: Bloomberg Finance L.P. RBA/JHI, as of September 30, 2026. Higher sensitivity to rates than index (1.0) equals weaker performance than the index when rates have risen over the past 5-year period.
Don’t forget yield
Dividend yield has historically been a critical component of wealth building, but investors today seem to have forgotten that. In fact, today’s investors appear to be taking immense capital risk.
There is always a place for growth investing in a portfolio, and these comments are not meant to imply otherwise. However, there is also a place for value investing and dividends, and investors should not ignore that historically potent source of total return.
INDEX DESCRIPTIONS:
The following descriptions, while believed to be accurate, are in some cases abbreviated versions of more detailed or comprehensive definitions available from the sponsors or originators of the respective indices. Anyone interested in such further details is free to consult each such sponsor’s or originator’s website.
The past performance of an index is not a guarantee of future results.
Each index reflects an unmanaged universe of securities without any deduction for advisory fees or other expenses that would reduce actual returns, as well as the reinvestment of all income and dividends. An actual investment in the securities included in the index would require an investor to incur transaction costs, which would lower the performance results. Indices are not actively managed and investors cannot invest directly in the indices.
S&P 500® Growth Index: The S&P 500® Growth Index is a free-float-adjusted, market-capitalization-weighted index. All the stocks in the underlying parent index are allocated into value or growth. Stocks that do not have pure value or pure growth characteristics have their market caps distributed between the value & growth indices.
S&P Dividend Aristocrats Index: The S&P 500® Dividend Aristocrats index is designed to measure the performance of S&P 500 index constituents that have followed a policy of consistently increasing dividends every year for at least 25 consecutive years.
Sectors: Sector references in this report are based on the S&P 500 sector constituents in accordance with the Global Industry Classification Standard (GICS®) developed by MSCI Barra and Standard & Poor’s.
Beta measures the volatility of a security or portfolio relative to an index. Less than one means lower volatility than the index; more than one means greater volatility.
Volatility measures risk using the dispersion of returns for a given investment.
These are the views of the author at the time of publication and may differ from the views of other individuals/teams at Janus Henderson Investors. References made to individual securities do not constitute a recommendation to buy, sell or hold any security, investment strategy or market sector, and should not be assumed to be profitable. Janus Henderson Investors, its affiliated advisor, or its employees, may have a position in the securities mentioned.
Past performance does not predict future returns. The value of an investment and the income from it can fall as well as rise and you may not get back the amount originally invested.
The information in this article does not qualify as an investment recommendation.
There is no guarantee that past trends will continue, or forecasts will be realised.
Marketing Communication.