Key takeaways:
- Electrification is increasing demand for critical materials faster than many supply chains can respond.
- Copper and uranium each face structural supply constraints that may support higher prices over the medium term.
- Resource security and supply resilience are becoming increasingly important considerations for policymakers, industry and investors.
A changing resource landscape
Much of the discussion around the energy transition has focused on the technologies at the heart of it. Electric vehicles, battery storage, data centres, power networks and low-carbon electricity generation have all garnered substantial attention.
What is often overlooked is the growing challenge of securing the critical minerals and metals, such as lithium, nickel, cobalt, copper and uranium, required to support this transition.
The International Energy Agency (IEA) estimates that demand for key critical minerals has risen by close to 10% a year in recent years, with energy sector applications accounting for roughly three-quarters (75%) of demand growth in 2025.1
At the same time, mine permitting timelines have lengthened, project costs have risen and new supply has become increasingly difficult to develop. The result is a market environment where resource scarcity is becoming a more important investment consideration.
Alongside increasingly fraught geopolitics and a tangible drift away from globalisation, this shift helps explain why governments are increasingly focused on resource security. Reliability and resilience are emerging as priorities not only across energy systems, but also throughout the raw material supply chains that support them.
In my view, this creates a compelling backdrop for selected opportunities across critical resources.
Copper: The return of scarcity
Copper remains one of the clearest examples of this trend.
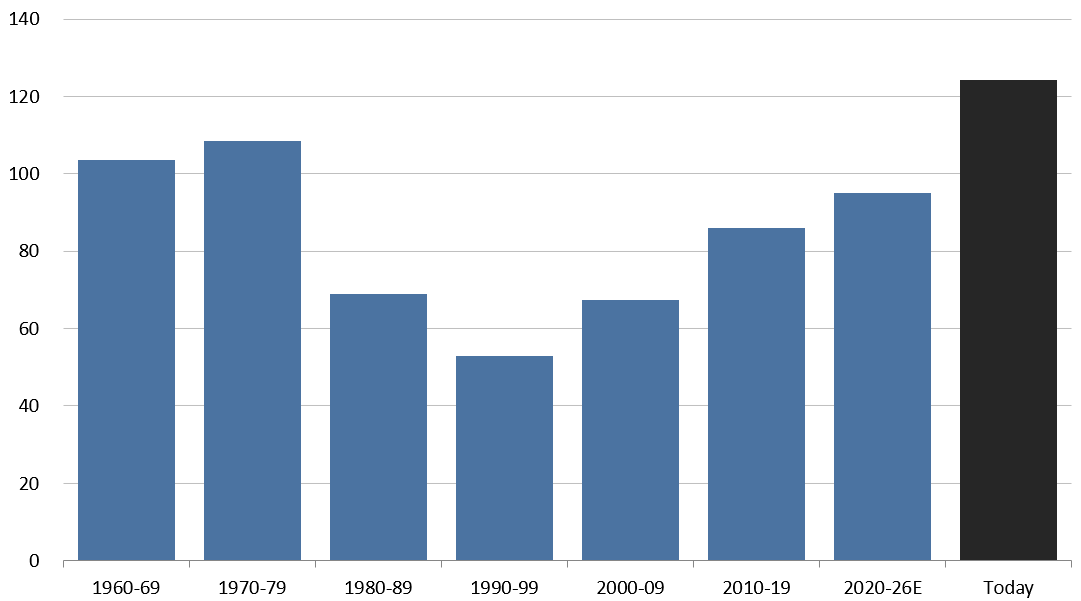
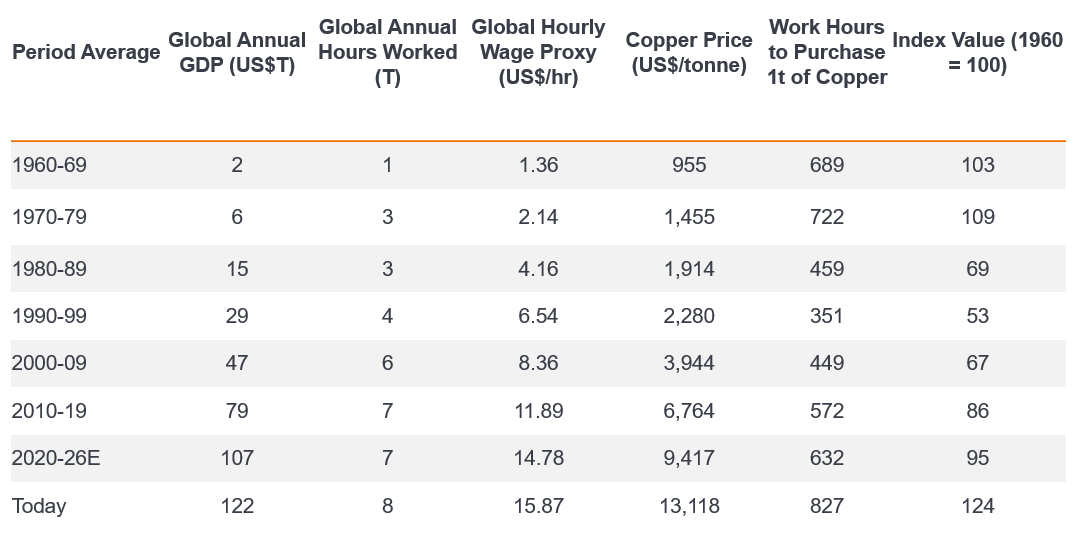
Recent research by Chris LaFemina at US-based investment bank Jefferies highlights an often-overlooked measure of scarcity: the global number of work hours required to afford a tonne of copper. By this measure, copper became progressively more abundant during the decades leading up to China’s industrialisation. Since the late 1990s, however, that trend has steadily reversed.
Exhibit 1: Hours of work required to purchase one tonne of copper (Indexed, 1960 = 100)
Source: USGS, World Bank, Conference Board, Jefferies as at 30 September 2026.
Note: The data displayed is calculated by using global nominal gross domestic product (GDP) divided by numbers of hours worked as a proxy for average worker income per hour globally and then comparing that measure of income per hour to the nominal price of copper.
The explanation for this trend’s reversal appears straightforward.
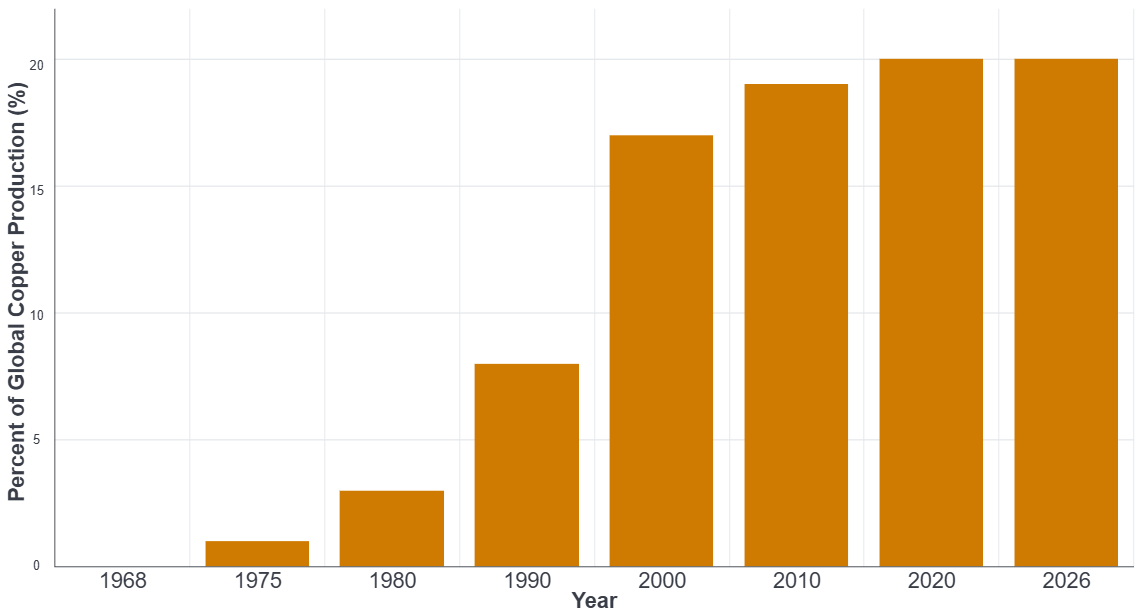
On the supply side, the commercialisation of solvent extraction-electrowinning (SX-EW) technology in the late 1960s unlocked substantial new copper resources and drove decades of supply growth. However, SX-EW production growth has largely matured, accounting for around one-fifth of global copper production and showing signs of plateauing (Exhibit 2).
Exhibit 2: Estimated SX-EW share of global copper production
Source: USGS, World Bank, Conference Board, Jefferies as at 30 September 2026.
Demand dynamics, however, have evolved in the opposite direction (Exhibit 3). Research suggests copper consumption has increased faster than real global GDP since 2011, implying the global economy has become increasingly copper-intensive. Under the IEA’s Stated Policies Scenario, copper records the largest absolute increase among the major energy minerals, with global demand rising by around seven million tonnes by 2040.2
Electrification, renewable energy deployment, electric vehicles and data centre construction all contribute to this trend.
Exhibit 3: Global copper consumption versus real global GDP
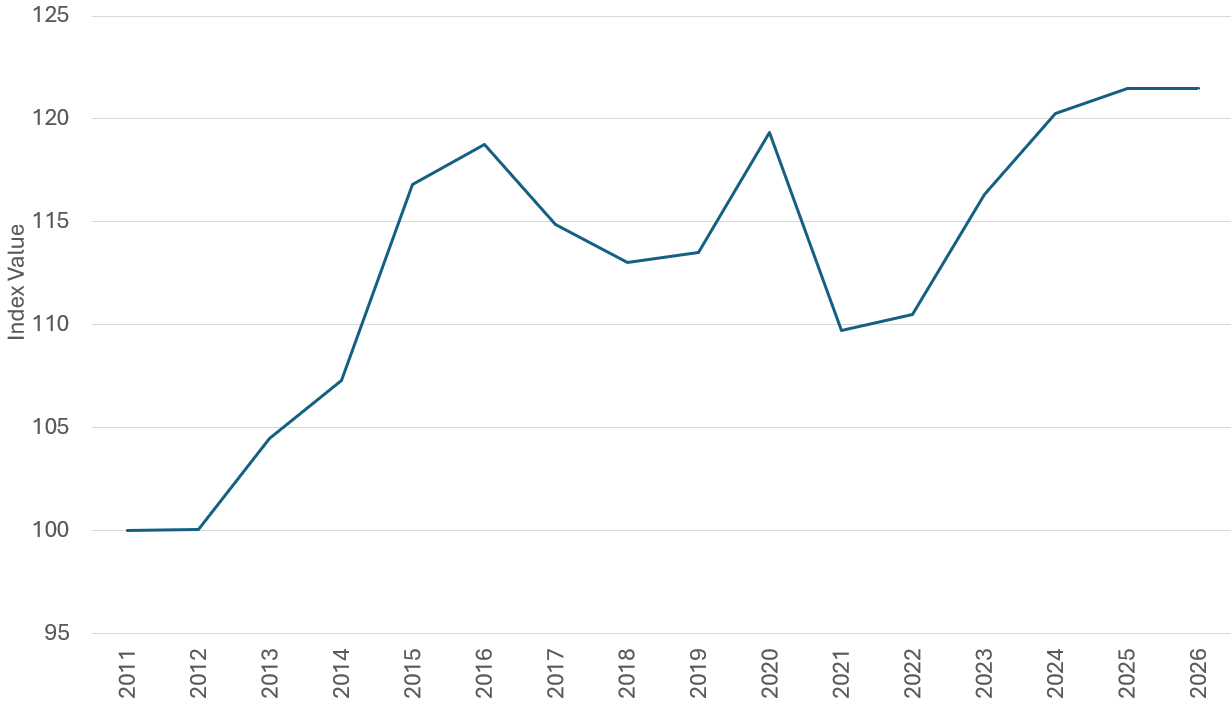
Source: USGS, World Bank, Conference Board, Jefferies as at 30 September 2026.
The implication is significant. For many years, copper supply growth was sufficient to meet rising demand. Today, that balance appears less comfortable. The IEA estimates that supply from existing and announced mining projects could fall around 25% short of primary copper requirements in 2035 under its Stated Policies Scenario, after accounting for recycling and refining losses.3
While forecasting commodity prices is inherently difficult, I believe the long-term direction of travel remains favourable. As electrification grows and supply constraints become more visible, copper is likely to become increasingly valuable within the global economy.
Uranium’s supply challenge persists
The uranium market provides another illustration of how supply disruptions can have meaningful implications for commodity fundamentals.
Recent results from Kazatomprom, one of the world’s largest uranium producers, revealed further delays to its sulphuric acid project. The company indicated that commissioning could move from early 2027 towards 2028 following project disruptions.4
This may appear to be a company-specific development, but it has broader implications.
Sulphuric acid is a critical input for in-situ uranium production. Constraints in sulphur supply resulting from the Middle East conflict have already created challenges for parts of the uranium industry. Delays to new acid capacity potentially limit one of the industry’s largest producers to increase production into an already tight market.
Uranium mining remains geographically concentrated. Kazakhstan accounted for 38% of uranium mine production in 2024, while Kazakhstan, Canada and Namibia together represented more than 72% of the global total. Six countries – adding Uzbekistan, Australia and Russia – accounted for nearly 93% of production.5
At the same time, global interest in nuclear power continues to strengthen as governments seek reliable, low-carbon electricity sources capable of supporting increasingly electrified economies. As of 20 September 2026, the International Atomic Energy Agency (IAEA) recorded 417 nuclear reactors in operation worldwide and a further 78 reactors, representing 81.3 gigawatts of capacity, under construction.6
This combination of rising demand and constrained supply remains supportive for the sector.
Lithium: The importance of perspective
Lithium markets have been considerably more volatile.
Following a sharp correction in lithium prices between late 2022 and early 2024 which saw spot prices fall up to 85%, many producers experienced significant share price declines. Yet short-term market sentiment can sometimes obscure the longer-term picture.
The fundamental investment case for lithium remains closely tied to battery storage and transport electrification. Solar power, grid storage and electric vehicle adoption all continue to support long-term demand growth. As such, the market subsequently turned again in 2026, with lithium prices doubling from previous cyclical lows on the back of battery storage demand and tightening inventories.
Importantly, battery demand is becoming increasingly diversified. Growth is no longer solely reliant on electric vehicles. Energy storage systems where batteries are deployed onto the electricity grid are emerging as a significant additional source of demand as power systems become increasingly renewable and distributed.
This diversification is already visible, with global battery demand growing by more than 35% in 2025 to exceed 1.5 terawatt-hours, with stationary storage emerging as a major source of incremental demand. Batteries now account for an estimated 88% of global lithium use, spanning electric vehicles, grid storage and other rechargeable applications.7
As a result, periods of weakness may create opportunities for investors willing to look beyond near-term commodity cycles.

The strategic value of critical resources
What links copper, uranium and lithium is not simply their role in the energy transition. It is their growing strategic importance.
That strategic importance reflects not only growing demand but also evolving supply chains. Across critical energy transition minerals, China leads in processing and refining, accounting for around 70% of output in 2025, while the dominant suppliers – Australia, Chile and the Democratic Republic of the Congo (DRC) – provided more than three-quarters of all growth in refined supply between 2023 and 2025.8
The world is building more electricity infrastructure, deploying more renewable generation, expanding battery capacity and adding new sources of power demand from areas such as artificial intelligence (AI) and data centres. Each of these trends requires physical resources.
At the same time, supply growth is becoming harder to secure.
This does not mean every commodity or every producer will benefit equally. Resource industries remain cyclical, and selectivity remains essential. Cost structures, operational execution, geopolitical risk and capital discipline will continue to separate winners from losers.
However, the broader direction is becoming increasingly clear.
For many years, markets largely focused on the technologies enabling the energy transition. Increasingly, investors are recognising that access to the materials underpinning those technologies may be just as important.
Conclusion: Identifying opportunity in critical resources
The energy transition is often discussed as a technology story. In reality, it is equally a resources story.
Copper, uranium and lithium each illustrate how growing electrification can collide with real-world supply constraints. While the details differ across markets, the underlying message is similar: critical resources are becoming more strategically valuable.
As governments, industries and consumers pursue greater electrification and energy security, I believe the companies that can reliably discover, develop and produce these essential materials should play an increasingly important role in the global economy.
1,2,3,6 Source: International Energy Association, Global Critical Minerals Outlook 2026, 16 July 2026.
4 Source: Kazatomprom 1H 2026 Financial Results, 21 August 2026.
5 Source: OECD-NEA/IAEA Uranium 2026; 2024 production data, September 2026.
7,8 Source: IEA Global Critical Minerals Outlook 2026; USGS Mineral Commodity Summaries 2026.
Commodity: Financial securities that may be subject to significant price movements (i.e., carrying a greater degree of risk). Examples include equities, commodities, property, lower-quality bonds, and some currencies.
Copper: A highly conductive metal widely used in electricity networks, renewable energy systems, electric vehicles and data centres.
Critical minerals: Minerals considered essential for economic activity, national security, and energy technologies, where supply disruptions could have significant consequences. Examples include lithium, cobalt, nickel and rare earth elements.
Electrification: The process of replacing systems powered by fossil fuels with systems powered by electricity, such as electric vehicles, heat pumps and electric industrial processes.
Energy transition: The long-term shift from a fossil fuel-based energy system towards lower-carbon energy sources, including renewables, nuclear power and energy storage technologies.
Gross domestic product (GDP): GDP is a measure of the size and heath of a country’s economy over a specific period, usually either quarterly or yearly.
Infrastructure investment: Investment into the physical assets of a nation or company, such as roads, railways, bridges, water, sewerage, port facilities, or telecommunications. Given that it usually requires large amounts of money, it is typically undertaken by governments or specialised investment strategies.
Inventory turnover: A measure of how quickly a business sells (and restocks) its inventory during a given period of time.
Lithium: A lightweight metal used primarily in rechargeable batteries for electric vehicles, consumer electronics and energy storage systems.
Resource security: The ability of countries or industries to maintain reliable access to the raw materials required for economic activity and strategic priorities.
Risk / Risk taking: The acceptance of greater risk in exchange for potentially higher returns. This can apply to both individual investors and companies. An assessment of investors’ attitude to risk forms a fundamental part of identifying a suitable investment strategy for their objectives.
Secular themes / trends: Long-term investment themes with strong growth potential, such as climate change, AI, clean energy, or changing demographics.
Security: A broad term that refers to shares, bonds, or any other financial instrument.
Solvent extraction and electrowinning (SX-EW) is a two-stage hydrometallurgical process used to extract and purify high-purity metals – primarily copper – from low-grade ores, tailings, or waste materials.
Supply constraint: A situation where production capacity, resources, infrastructure or regulation limits the availability of a commodity or product relative to demand.
Uranium: A metal used as fuel in nuclear reactors to generate electricity.
Volatility: The rate and extent at which the price of a portfolio, security, or index moves up and down. If the price swings up and down with large movements, it has high volatility. If the price moves more slowly and to a lesser extent, it has lower volatility. The higher the volatility, the higher the risk of the investment.
These are the views of the author at the time of publication and may differ from the views of other individuals/teams at Janus Henderson Investors. References made to individual securities do not constitute a recommendation to buy, sell or hold any security, investment strategy or market sector, and should not be assumed to be profitable. Janus Henderson Investors, its affiliated advisor, or its employees, may have a position in the securities mentioned.
Past performance does not predict future returns. The value of an investment and the income from it can fall as well as rise and you may not get back the amount originally invested.
The information in this article does not qualify as an investment recommendation.
There is no guarantee that past trends will continue, or forecasts will be realised.
Marketing Communication.
Important information
Please read the following important information regarding funds related to this article.
- Shares can lose value rapidly, and typically involve higher risks than bonds or money market instruments. The value of your investment may fall as a result.
- Active management techniques that have worked well in normal market conditions could prove ineffective or negative for performance at other times.
- Emerging markets expose investors to higher volatility and greater risk of loss than developed markets; they are susceptible to adverse political and economic events, and may be less well regulated with less robust custody and settlement procedures.
- The Fund is focused towards particular industries or investment themes and may be heavily impacted by factors such as changes in government regulation, increased price competition, technological advancements and other adverse events.
- Derivatives may be used to help achieve the investment objective. This can result in leverage (higher levels of debt), which can magnify an investment outcome. Gains or losses may therefore be greater than the cost of the derivative. Derivatives also introduce other risks, in particular, that a derivative counterparty may not meet its contractual obligations.
- Securities could become hard to value or to sell at a desired time and price, especially in extreme market conditions when asset prices may be falling, increasing the risk of investment losses.
- The Fund's exposure to commodities may be subject to rapid and substantial price movements resulting in high volatility. Developments affecting commodities instruments, such as changes in supply and demand, government programs and policies, political events and changes in interest rates may have an impact on the Fund.
- Losses could be incurred if a counterparty became unwilling or unable to meet its obligations, or as a result of failure or delay in operational processes or the failure of a third party provider.
- Swap returns are subject to the returns of the index or reference assets. Valuations of investments, the index tracked or replicated, or the financial instruments used to track or replicate the index may, in certain circumstances, only be available from a limited number of market participants who may also act as counterparties to these transactions. This means valuations can be subjective, and different sources may provide significantly different values.
- The Fund uses a proprietary trading model, using quantitative analysis and algorithms to select positively or negatively trending investments. There is a risk that the investments selected using the model may perform differently than expected and may not achieve positive returns or outperform. Where the model relies on data and technology risks include inaccurate data and system failures. These are mitigated through the Investment Manager’s internal governance and oversight processes.