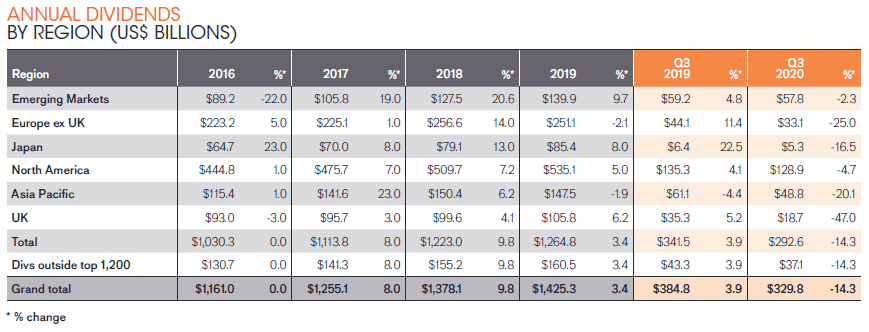
- Global dividends fell $55bn to $329.8bn in the third quarter, a fall of 11.4% on an underlying basis and a headline decline of 14.3%
- The decline was less severe than in Q2 because seasonal patterns in Q3 favour parts of the world where dividends have been more resilient
- China, Hong Kong and Canada were among the very few major countries to see higher dividends, but the weakest results came from the UK, Australia, and the Netherlands
- One third of companies cut or cancelled payouts, but encouragingly some companies restored dividends
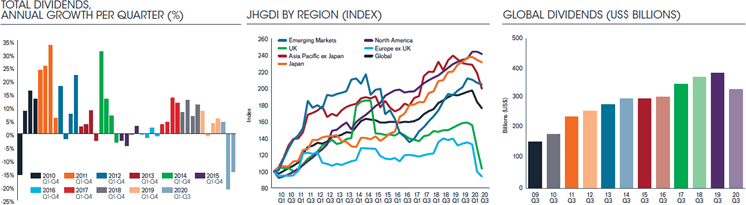
- JHGDI fell to 176.0 a level last seen almost three years ago
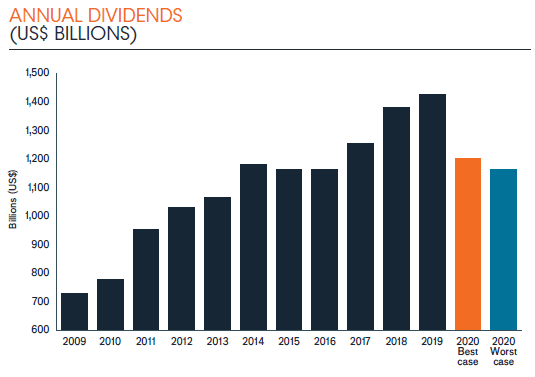
- Forecast raised for 2020 – best case now -17.5% (up from -19%); worst case -20.2% (up from -25%)
As the pandemic has worn on, so has its impact on the dividend-paying capacity of the world’s companies has become much clearer, according to the latest edition of the Janus Henderson Global Dividend Index. The third quarter saw total payouts fall by $55bn to $329.8bn, the lowest since 2016. The 14.3% headline decline was equivalent to a fall of 11.4% on an underlying basis, far better than Q2’s 18.3% decline. The smaller impact primarily reflects a geographic mix in the third quarter that emphasises parts of the world where dividends have proved more resilient, especially in North America and emerging markets, but it is also an indication that the worst is past. Overall, more than two-thirds of companies increased dividends or held them steady in Q3, compared to a little under one third that cut or cancelled them.
Q3 is China’s big dividend season and payouts there were 3.3% higher year-on-year. Three quarters of Chinese companies raised payouts or held them steady. Canada and Hong Kong were among the few major countries to see dividends rise too. The weakest results came from the UK, Australia, and the Netherlands.
Australian dividends have been among the hardest hit in the world. They fell 40.3% on an underlying basis, down to just $9.6bn, the lowest third-quarter total in at least 11 years, with cuts from the banks making a particularly large impact. UK payouts were 41.6% lower, while the cancellation of banking and brewing dividends impacted the Netherlands severely.
US companies pay two-fifths of the world’s dividends. The relatively small decline (-3.9% in Q3 and flat in Q2) is helping support the global total this year. Eight in ten US companies held or increased their payouts in Q3, with lower share buy-backs reportedly bearing the brunt of companies’ efforts to preserve cash. Janus Henderson estimates that the US total shareholder yield (which adds dividends and share buybacks) will be in line with the more resilient European nations this year.
Excluding Australia, dividends from Asia-Pacific ex Japan were exactly flat year-on-year, reflecting the milder impact of the pandemic both on the population and on the economy, stronger balance sheets, lower payout ratios and because many of this quarter’s payouts relate to 2019 earnings and were fixed several months ago. Hong Kong enjoyed the fastest dividend growth in the developed world in Q3, with payouts rising 9.9% on an underlying basis to $21.7bn, the second highest quarterly total on record from the territory.
The worst declines in Q3 came from consumer discretionary companies, down 43% in underlying terms, with car manufacturers and leisure companies making the deepest cuts. Media, aerospace and banks were also severely impacted. The most resilient sectors were classically defensive pharmaceuticals, food producers and food retailers, which all saw higher payouts on an underlying basis.
In April, in the midst of the greatest pandemic-induced uncertainty, Janus Henderson calculated that global dividends could fall at least 15% this year, but by as much as 35% on an underlying basis. In July the team narrowed this range to -19% to -25%. Janus Henderson is now confident that the final figure will come in towards the top end of our expectations. The best case now sees a fall of -17.5% to $1.20 trillion on an underlying basis, equivalent to a headline drop of -15.7%. Our worst case sees underlying dividends declining -20.2% to $1.16 trillion, a headline drop of -18.5%. The best case would eradicate more than three years of dividend growth, costing investors $224bn in lost income this year.
Jane Shoemake, Investment Director for Global Equity Income at Janus Henderson said: “The loss of $224bn in dividend income from around the world in 2020 is nothing to celebrate, but we have been encouraged by how resilient payouts have been in many parts of the world, especially in Asia, the US, Japan and emerging markets. This resilience is partly because companies seek to cushion investors from the disruption to their operations, but it’s also because payout ratios (the portion of profits distributed) have been comfortable in many parts of the world. The UK, Australia and parts of Europe have proved to be more vulnerable in part because payout ratios there were already too high, and a reset was overdue for some key companies. They now have a firmer basis for future growth. What’s more, two fifths of the world’s dividends have historically been paid by defensive sectors that are proving relatively insulated from the crisis, and the big growth sectors like technology are breezing through 2020 almost entirely unscathed.
In 2021 Q1 will still be affected by reductions, but then things should pick up. The big question mark is over the decisions the regulators in the UK, Europe and Australia will make around banking payouts. And of course, so much depends on the pandemic and the severity and duration of any further lockdowns. As a rough guide, we estimate a worst case for dividends to be flat next year on an underlying basis, but we believe they could rebound by 12% in our best-case scenario.”
-ends-
Press Enquiries
Stephen Sobey
Head of Media Relations Director,
T: 44 (0) 2078182523
E: Stephen.sobey@janushenderson.com
Nicole Mullin
Media Relations EMEA & LatAm
T: +44 (0)207 818 2511
E: Nicole.Mullin@janushenderson.com
Sarah de Lagarde
Global Head of Communications
T: 44 (0) 2078182626
E: Sarah.delagarde@janushenderson.com
Lia Esbry
European PR Executive
T: 44 (0) 2078183521
E: Lia.esbry@janushenderson.com
Past performance is no guarantee of future results. International investing involves certain risks and increased volatility not associated with investing solely in the UK. These risks included currency fluctuations, economic or financial instability, lack of timely or reliable financial information or unfavourable political or legal developments.
Notes to editors
Janus Henderson Group (JHG) is a leading global active asset manager dedicated to helping investors achieve long-term financial goals through a broad range of investment solutions, including equities, fixed income, quantitative equities, multi-asset and alternative asset class strategies.
At 30 September 2020, Janus Henderson had approximately US$358 billion in assets under management, more than 2,000 employees, and offices in 27 cities worldwide. Headquartered in London, the company is listed on the New York Exchange (NYSE) and the Australian Securities Exchange (ASX).
Methodology
Methodology
Each year Janus Henderson analyse dividends paid by the 1,200 largest firms by market capitalisation (as at 31/12 before the start of each year). Dividends are included in the model on the date they are paid. Dividends are calculated gross, using the share count prevailing on the pay date (this is an approximation because companies in practice fix the exchange rate a little before the pay date), and converted to US$ using the prevailing exchange rate. Where a scrip dividend is offered, investors are assumed to opt 100% for cash. This will slightly overstate the cash paid out, but we believe this is the most proactive approach to treat scrip dividends. In most markets it makes no material difference, though in some, particularly European markets, the effect is greater. Spain is a particular case in point. The model takes no account of free floats since it is aiming to capture the dividend paying capacity of the world’s largest listed companies, without regard for their shareholder base. We have estimated dividends for stocks outside the top 1,200 using the average value of these payments compared to the large cap dividends over the five-year period (sourced from quoted yield data). This means they are estimated at a fixed proportion of 12.7% of total global dividends from the top 1,200, and therefore in our model grow at the same rate. This means we do not need to make unsubstantiated assumptions about the rate of growth of these smaller company dividends. All raw data was provided by Exchange Data International with analysis conducted by Janus Henderson Investors.
[1] Revised upwards from -19.1% – see report for more details