Key takeaways:
- Delivering what we characterize as a “pre-emptive” cut, the Fed prioritized supporting a flagging labor market despite elevated inflation.
- Should the Fed’s view that tariffs represent a “one-off” to price levels prove inaccurate, December’s cut, along with any in 2026, could lead to persistent inflation exerting upward pressure on the long end of yield curves.
- In periods of elevated uncertainty, we believe bond investors should prioritize diversification and steady yields – two characteristics that can potentially be achieved by seeking out shorter-dated, global issuance.
Bond investors who were looking to unearth clear insight on the future state of the U.S. economy and policy rate path likely viewed the Federal Reserve’s (Fed) December statement as something of a nonevent. We found some value in it as – after a slight misdirection by Chairman Jerome Powell in his October comments – the central bank’s ensuing efforts to telegraph perhaps a final pre-emptive 25 basis point (bps) cut served as evidence of the Fed’s adherence to forward guidance.
One could argue that for a data-driven Fed, the notion of being pre-emptive is something of a contradiction, as the decision seemed to be made with an eye toward what might transpire over the next 12 months. Not helping matters was the dearth of recent economic data due to the recently resolved government shutdown. Furthermore, language referencing that risks on each side of the Fed’s dual mandate (price stability and full employment) are both present could have been grounds to wait and see – an approach taken by the two hawkish dissenters. But in the end, nine other voters concluded that a third successive rate cut was the most prudent course.
Tension within the data
For Chairman Powell, the rationale for favoring labor over prices could be found in tariffs. Data reveal that persistent inflation over much of 2025 is owed to an acceleration in goods prices. The Fed is pinning its hopes on the assumption that tariffs will be a one-time resetting of price levels and once that flows through, year-over-year inflation will again start to drift back toward the central bank’s 2.0% target.
Exhibit 1: Components of U.S. consumer price index
Persistent headline – and core – inflation are largely attributable to a rise in goods prices which is denting positive trends in core services and, more recently, energy prices.
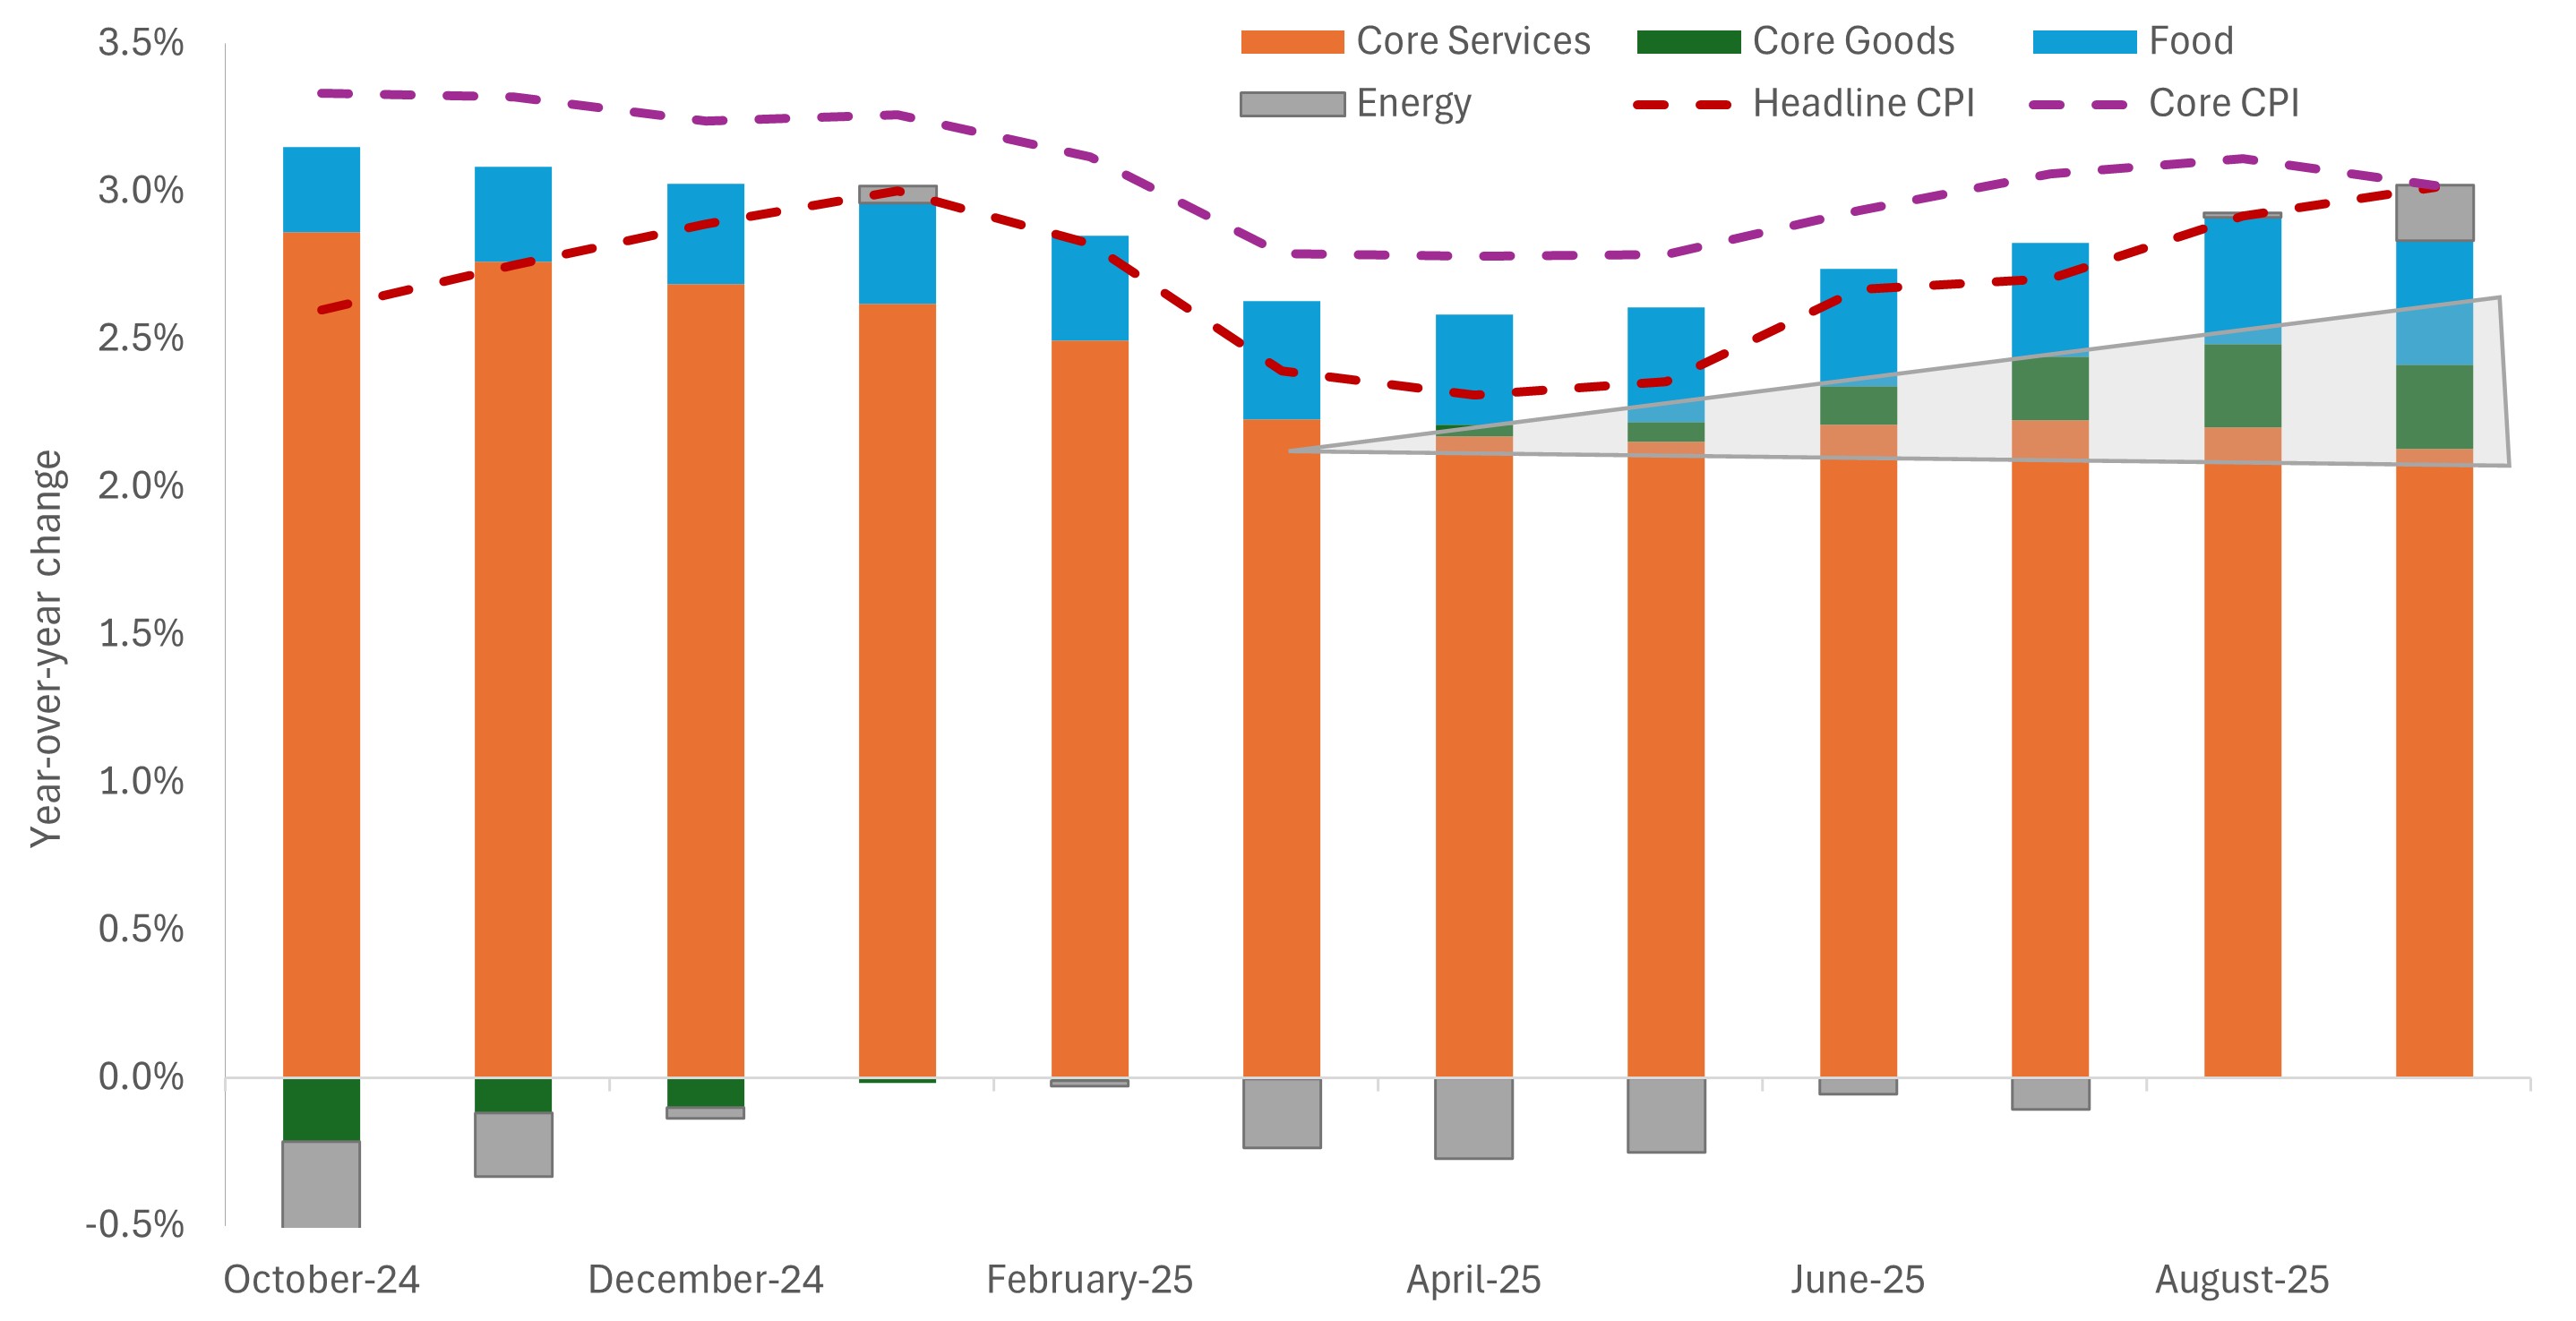
Source: Bloomberg, Janus Henderson Investors, as of 30 September 2025.
The Fed’s expectation that the upside risk to inflation may prove ephemeral allowed it to prioritize what it views as relatively worrying labor market trends. The unemployment rate ticked up three-tenths of one percent, to 4.4%, between June and September – the last available month. Similarly, average payroll gains have dipped to stall speed, averaging 39,000 over the last five available months. Even with an absence of October and November data – along with the administration’s immigration policy clouding labor market supply and demand dynamics – the mid-year softness proved sufficient for the Fed to act.
Exhibit 2: U.S. nonfarm payroll changes
The nonfarm payrolls data through September reflected a similar softening trend seen in private labor market data and this was likely enough to compel the Fed to tilt its bias toward supporting job growth.
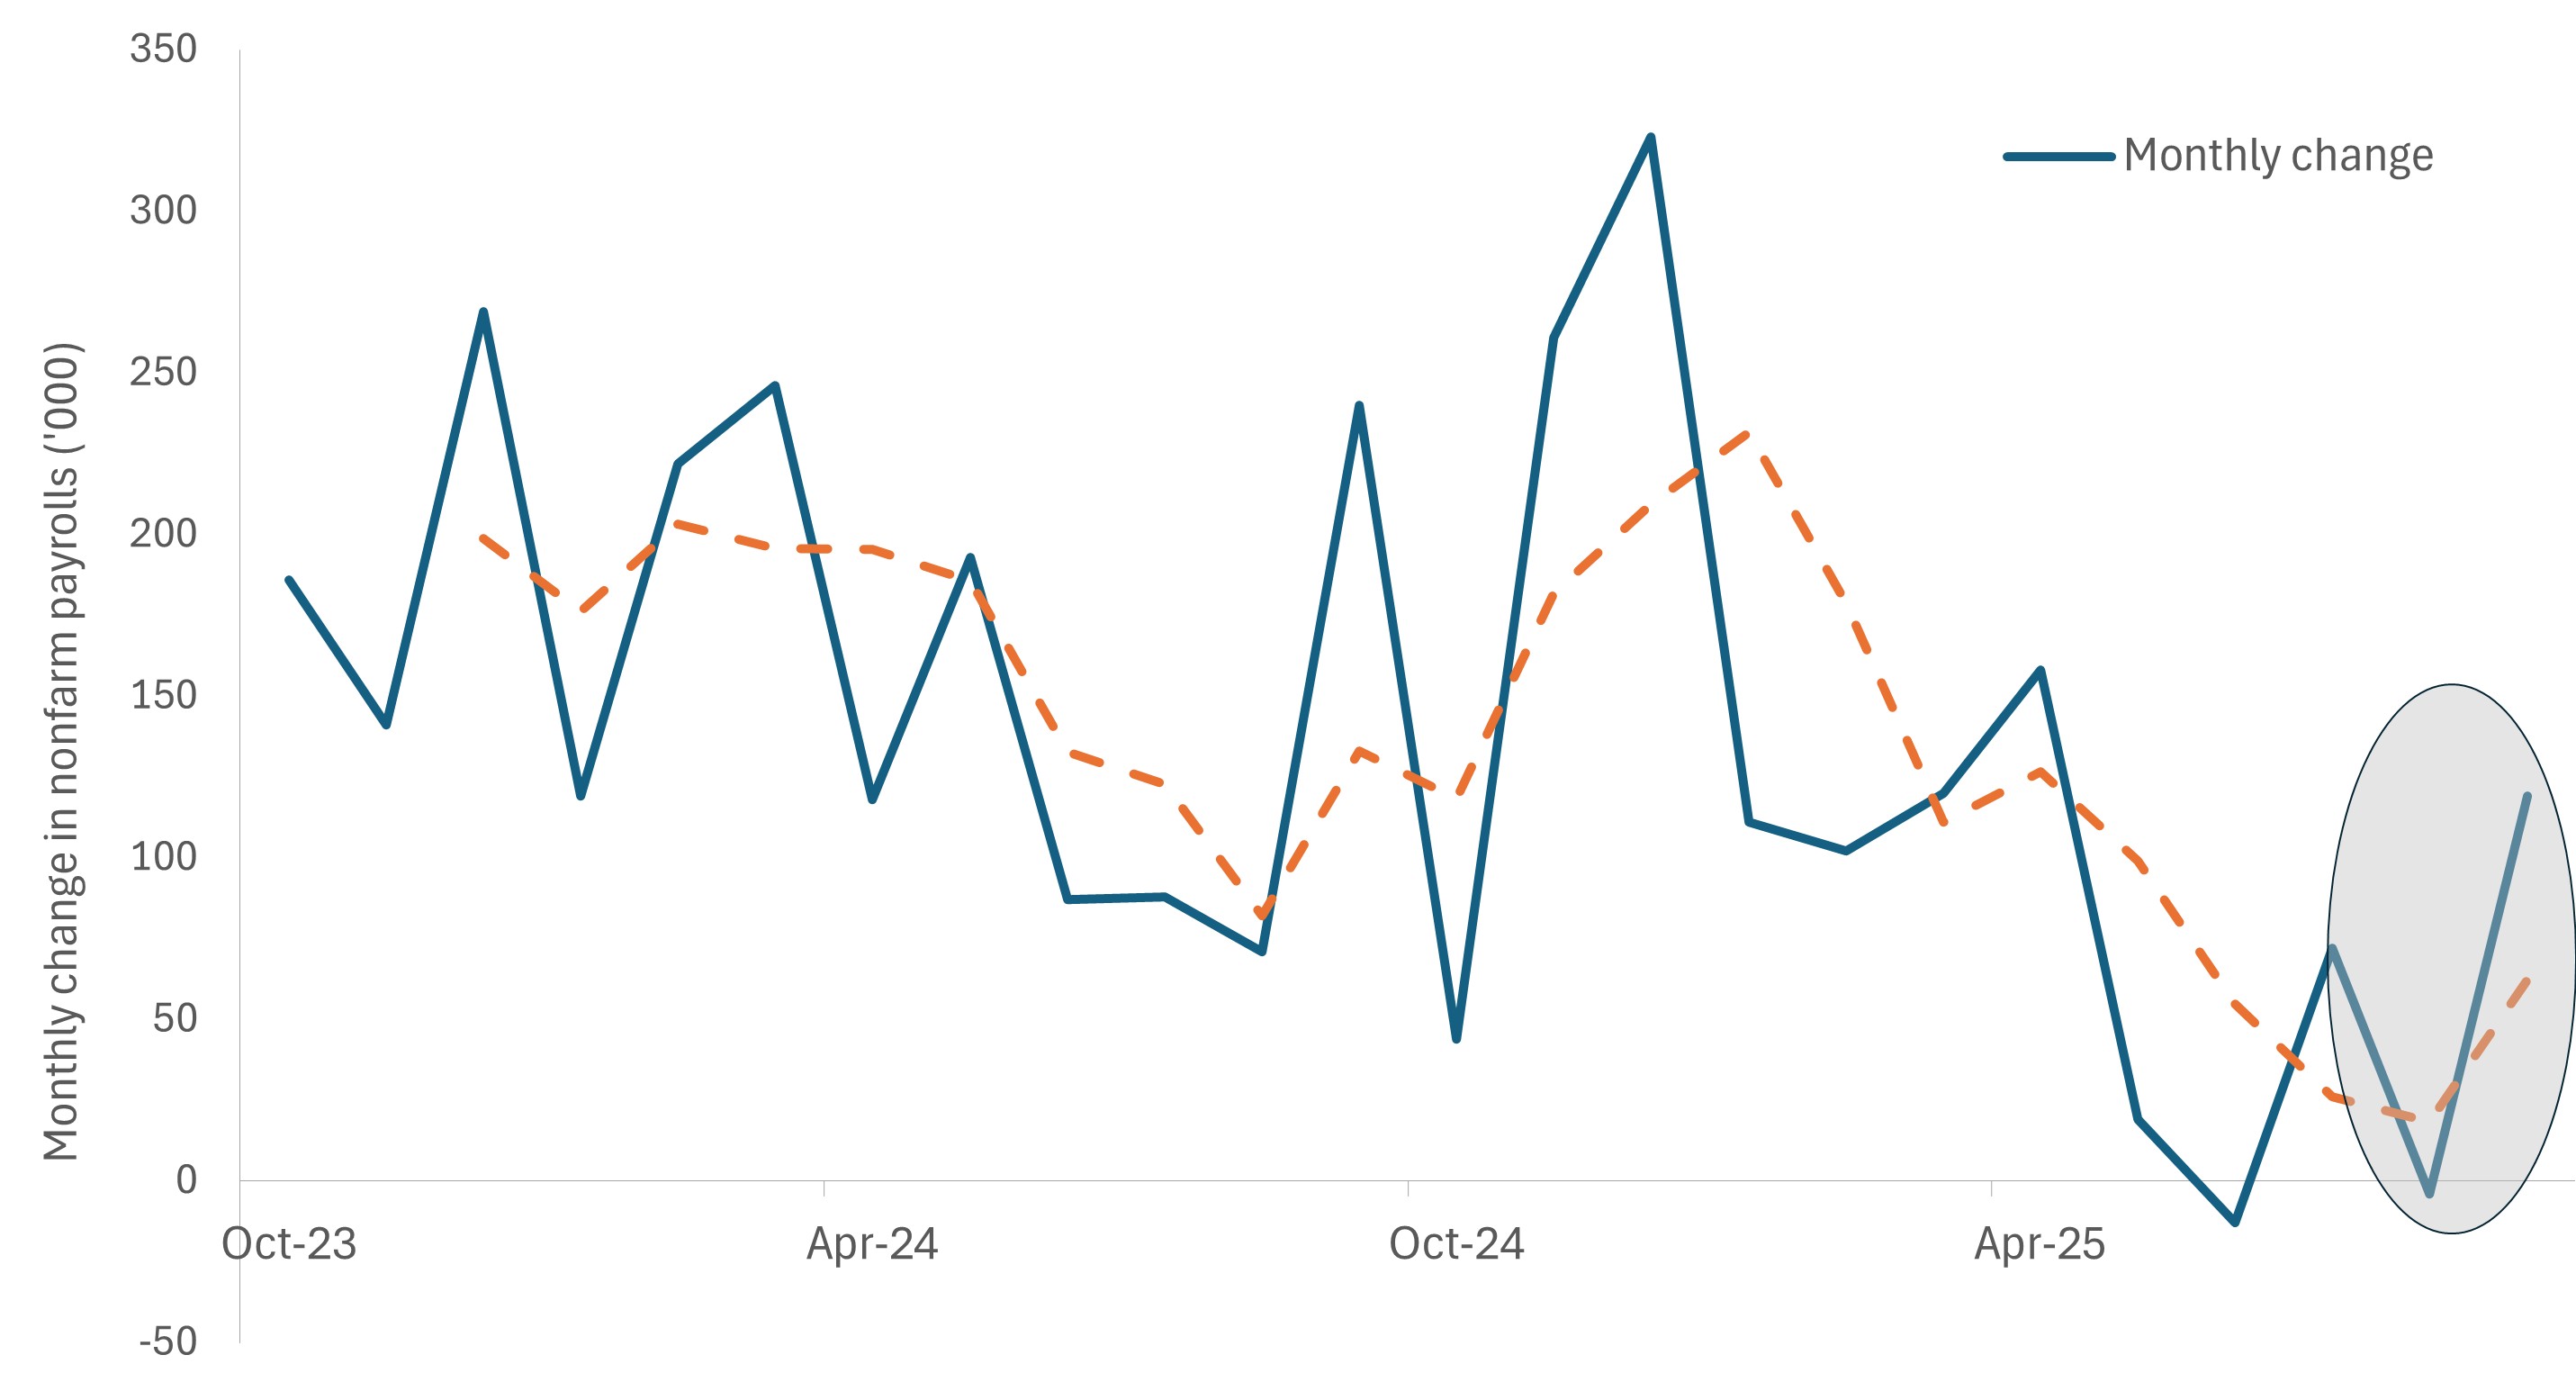
Source: Janus Henderson Investors, as of 30 September 2025.
The tension within the Fed’s mandate is further illuminated by the central bank’s updated Summary of Economic Projections. Even when factoring out the effects of the government shutdown, 2026 economic growth has been modestly revised upward. Reflecting the Fed’s sanguine view toward tariffs, both headline and core inflation for next year were modestly revised downward to 2.4% and 2.5%, respectively. Interestingly, even with plodding economic growth and the recent uptick, the unemployment rate is expected to finish 2026 at 4.4% – unchanged from its September projection.
The greatest evidence that the December decision can be characterized as a hawkish cut is the Fed’s own projected interest rate path being unchanged from October. The median estimate of surveyed members indicates one cut each in 2026 and 2027. Futures markets are more dovish, pricing in two 25 bps cuts next year. That view, however, could reflect the expected shift in the Fed’s composition, with the end of Chairman Powell’s tenure and the appointment of a new Chair who could more closely reflect President Trump’s attitude toward monetary policy. We must state that the Chair represents just one vote, and the presumption is that most members greatly respect the value placed on Fed independence.
Uncertainty merits diversification – and steady yield
The Fed itself admitted that it’s in the unenviable position of operating in an environment where both inflation and the labor market command their attention. Bond investors find themselves in the same predicament. We are aligned with the consensus view that future rate hikes are off the table. After this meeting, status quo means possibly only two more rate cuts this cycle. Should that prove to be too hawkish, economic growth could surprise to the downside, resulting in declining mid- to longer-dated Treasury yields.
Of course, the risk is that if a still-resilient consumer sector rolls over, following an already flagging housing market, cyclically exposed corporate credits could suffer. We see this as a low probability scenario but one that should not be completely ignored given current tight credit spreads.
A wild-card scenario is a potentially more-pliable Fed cutting rates more than anticipated, especially given that inflation is still residing above the bank’s 2.0% target. Tariffs’ impact on prices not proving transitory would compound the upward pressure on prices. That policy error, while likely not on the scale of the 1970s, in our view, would punish mid- to longer-dated bonds.
Exhibit 3: U.S. bond segments yield and duration exposure
After years of policy distortions upending the traditional relationship, shorter-dated securities again generate yields sufficient to absorb any potential upside interest rate risk; this characteristic is welcome in a period of inflation and rate uncertainty.
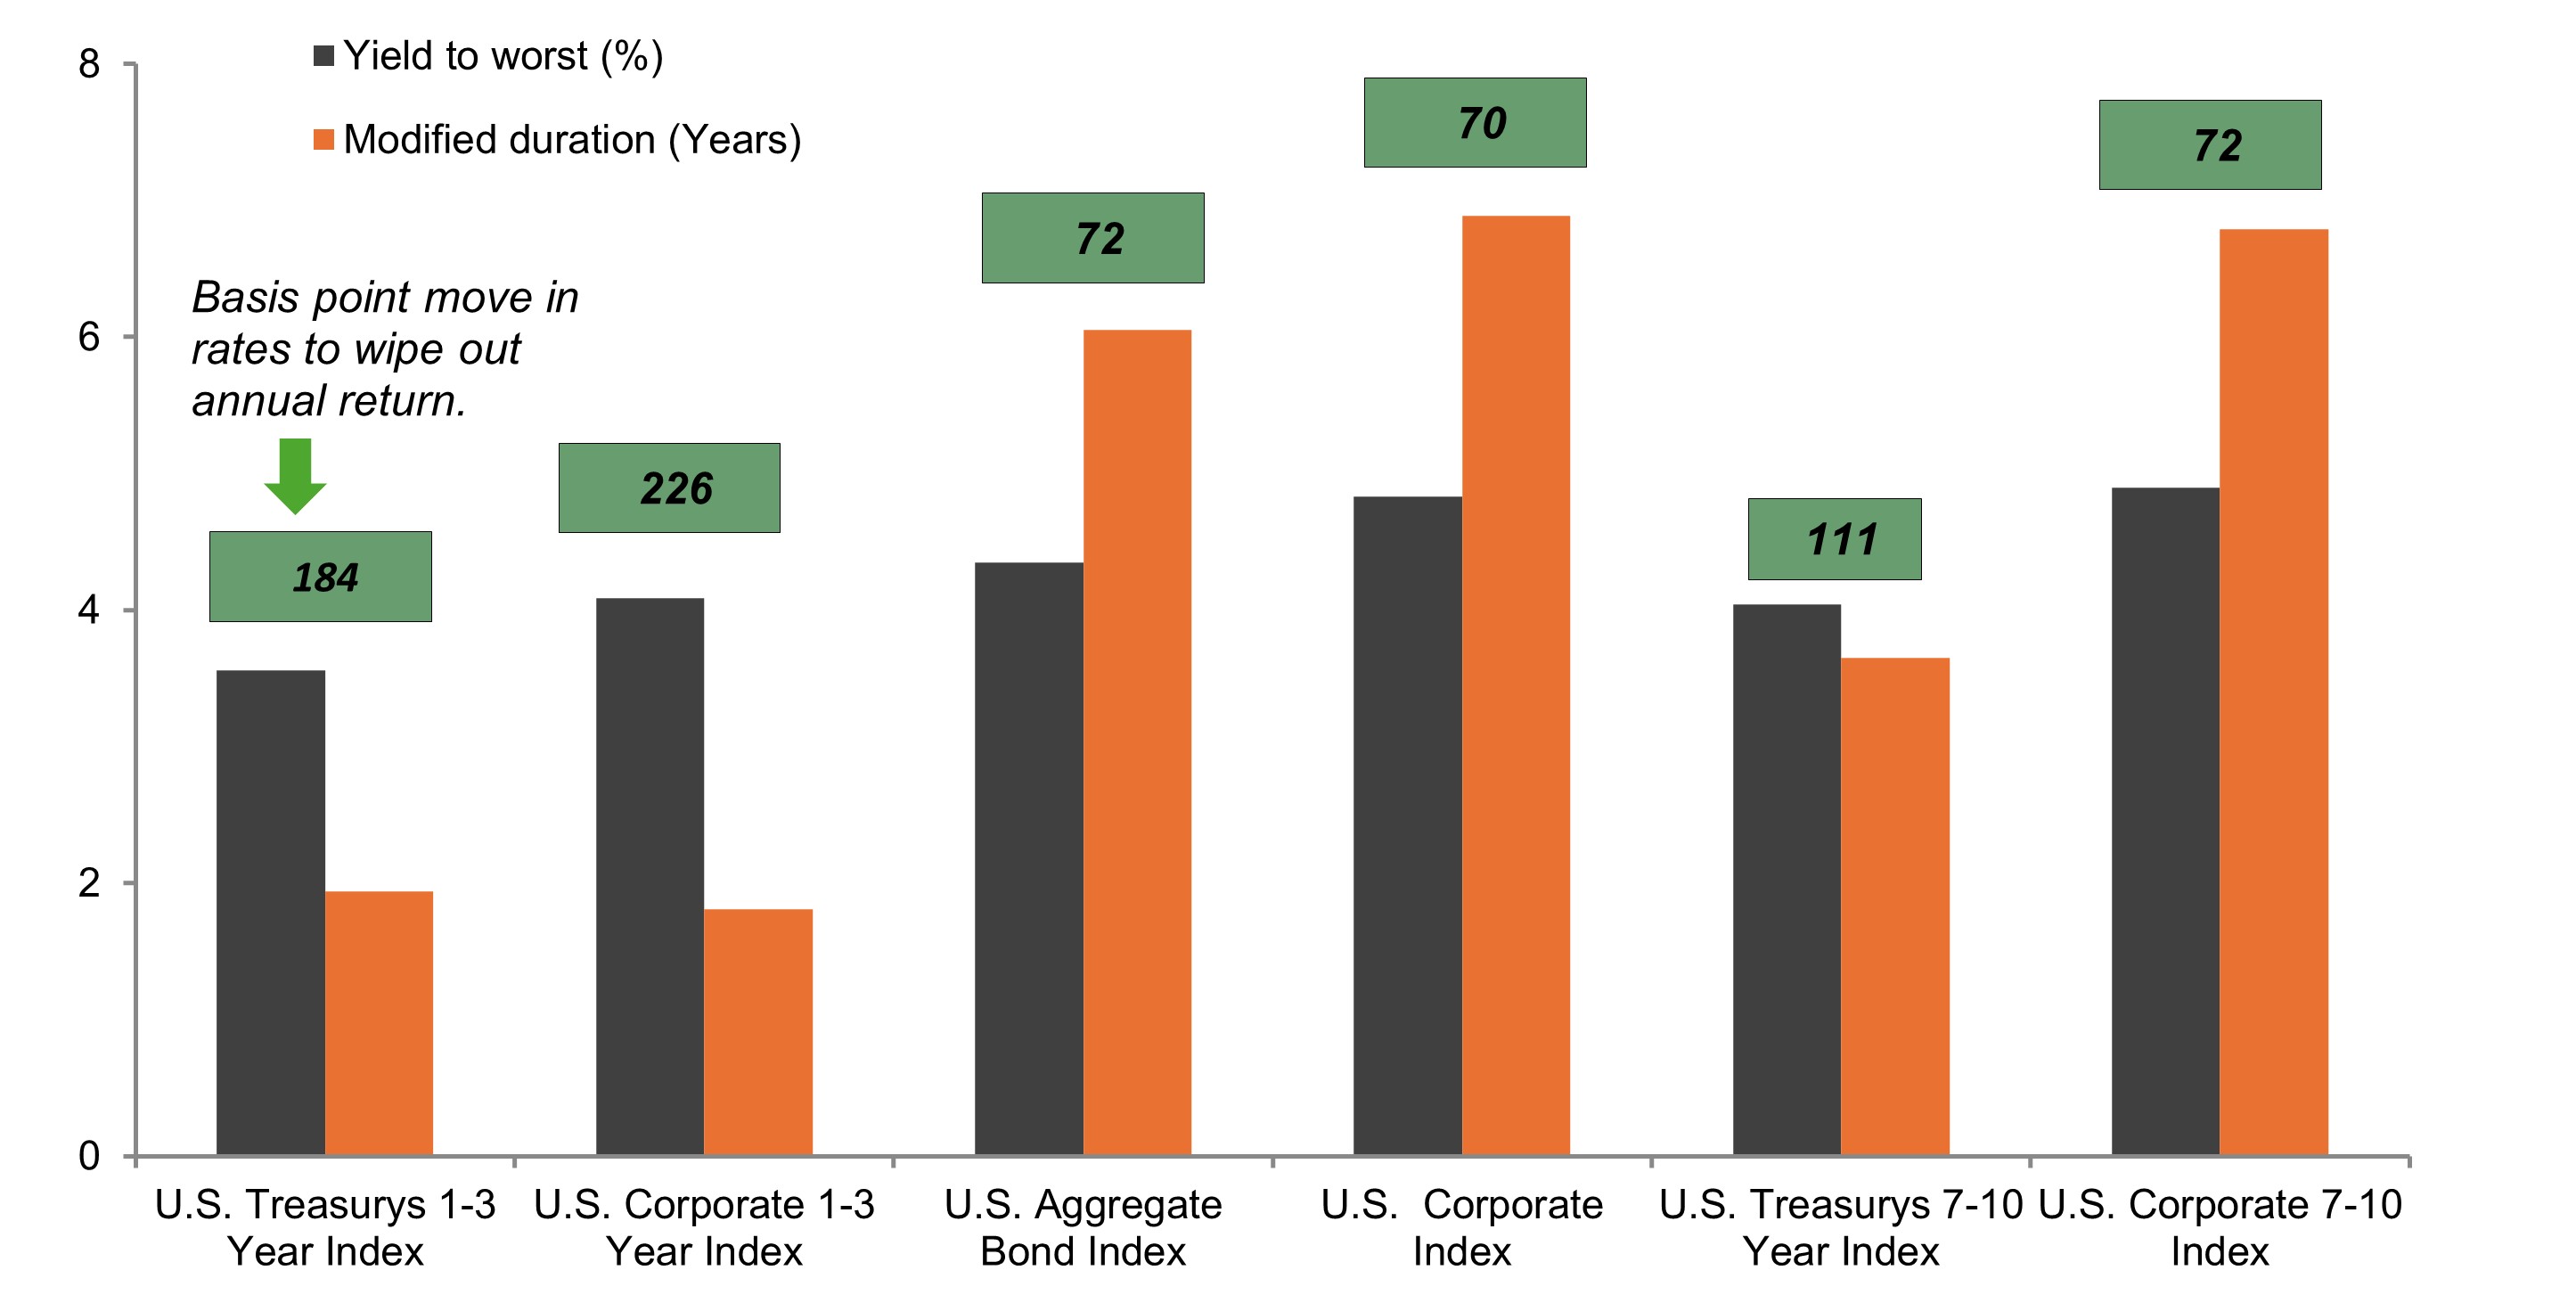
Source: Bloomberg, as of 10 December 2025.
As we argued in our Market GPS 2026 outlook, periods of economic and policy uncertainty don’t lend themselves well to excessive risk taking. With yields on the front end of sovereign and credit curves still attractive – albeit beneath recent highs – we believe fixed income investors can still generate attractive income streams via shorter-maturity issuance that is less exposed to interest rate volatility.
Lastly, we think uncertainty should force bond investors to prioritize diversification. An effective way to accomplish that in the current environment, in our view, is to allocate across jurisdictions. Economic cycles and policy prescriptions are diverging, enabling investors to capture income in regions with still high – and stable – rates while also participating in capital appreciation in countries where conditions merit a resumption of easing.
IMPORTANT INFORMATION
Diversification neither assures a profit nor eliminates the risk of experiencing investment losses.
Fixed income securities are subject to interest rate, inflation, credit and default risk. The bond market is volatile. As interest rates rise, bond prices usually fall, and vice versa. The return of principal is not guaranteed, and prices may decline if an issuer fails to make timely payments or its credit strength weakens.
Basis point (bp) equals 1/100 of a percentage point. 1 bp = 0.01%, 100 bps = 1%.
Bloomberg US Corporate Bond Index measures the investment grade, fixed rate, taxable corporate bond market.
The Bloomberg US Treasury 1-3 Year Index measures US dollar-denominated, fixed-rate, nominal debt issued by the US Treasury with 1-2.999 years to maturity.
The Bloomberg US Corporate 1-3 Year Index measures the investment grade, fixed-rate, taxable corporate bond market with 1-3 year maturities.
The Bloomberg US Treasury 7-10 Year Index measures US dollar-denominated, fixed-rate, nominal debt issued by the US Treasury with 7-10 years to maturity.
The Bloomberg US Corporate 7-10 Year Index measures the investment grade, fixed-rate, taxable corporate bond market with 7-10 year maturities.
Bloomberg U.S. Aggregate Bond Index is a broad-based measure of the investment grade, US dollar-denominated, fixed-rate taxable bond market.
Basis point: One basis point (bp) equals 1/100 of a percentage point, 1bp = 0.01%.
Credit spread: The difference in yield between securities with similar maturity but different credit quality. Widening spreads generally indicate deteriorating creditworthiness of corporate borrowers, and narrowing indicate improving.
Duration: Duration measures the sensitivity of a bond’s or fixed income portfolio’s price to changes in interest rates. The longer a bond’s duration, the higher its sensitivity to changes in interest rates and vice versa.
Monetary policy: The policies of a central bank, aimed at influencing the level of inflation and growth in an economy. Monetary policy tools include setting interest rates and controlling the supply of money.
Quantitative Easing (QE) is a government monetary policy occasionally used to increase the money supply by buying government securities or other securities from the market
Volatility measures risk using the dispersion of returns for a given investment. The rate and extent at which the price of a portfolio, security or index moves up and down.
Yield-to-worst: The lowest yield a bond with a special feature (such as a call option) can achieve provided the issuer does not default.
Yield curve plots the yields (interest rate) of bonds with equal credit quality but differing maturity dates. Typically bonds with longer maturities have higher yields.
These are the views of the author at the time of publication and may differ from the views of other individuals/teams at Janus Henderson Investors. References made to individual securities do not constitute a recommendation to buy, sell or hold any security, investment strategy or market sector, and should not be assumed to be profitable. Janus Henderson Investors, its affiliated advisor, or its employees, may have a position in the securities mentioned.
Past performance does not predict future returns. The value of an investment and the income from it can fall as well as rise and you may not get back the amount originally invested.
The information in this article does not qualify as an investment recommendation.
There is no guarantee that past trends will continue, or forecasts will be realised.
Marketing Communication.