Key takeaways:
- Sydney office market vacancy rates remain high but muted future supply, rising tenant enquiries, and recent deals hint at some stabilisation.
- Despite the Chifley development offering highly desirable premium office space, incentive levels in line with the average of 30% in the sector are being offered to attract tenants.
- The flight to quality, meeting evolving tenant needs and sustainability credentials are continuing themes for the global property sector.
The Sydney office market is somewhat bifurcated at the moment: on the one hand tenant demand in the wider market is weak with rising vacancy, and on the other, there are early signs of tightening and strength in the premium segment.
Following our recent trip to Sydney, where we visited the largest office development in the market, we share an update on the sector and explore what the future might hold.
Real estate is meant to be a simple business of supply and demand. Right now, whilst current office supply in Sydney remains elevated, future supply is running below the long-run average due to rising construction costs. At the same time, demand remains anaemic resulting in rental incentives (used to attract or retain tenants eg. fit out contributions, a rent discounts, rent-free periods) currently at eye-wateringly high levels. But this only gives us the headlines. Below the surface we see some green shoots for the best assets in the best locations. Does this signal the beginning of a new cycle for the Sydney office market or a stagnating market with few winners?
Chifley development: A panoramic paradox?
Our visit to Chifley Tower helped answer this question. There, we took in one of the best views from any office building in the world – from Charter Hall’s development at Chifley North Tower. The development will expand the Chifley precinct by adding an additional South Tower and offer combined space of almost 1.2 msqft, most of it office space.
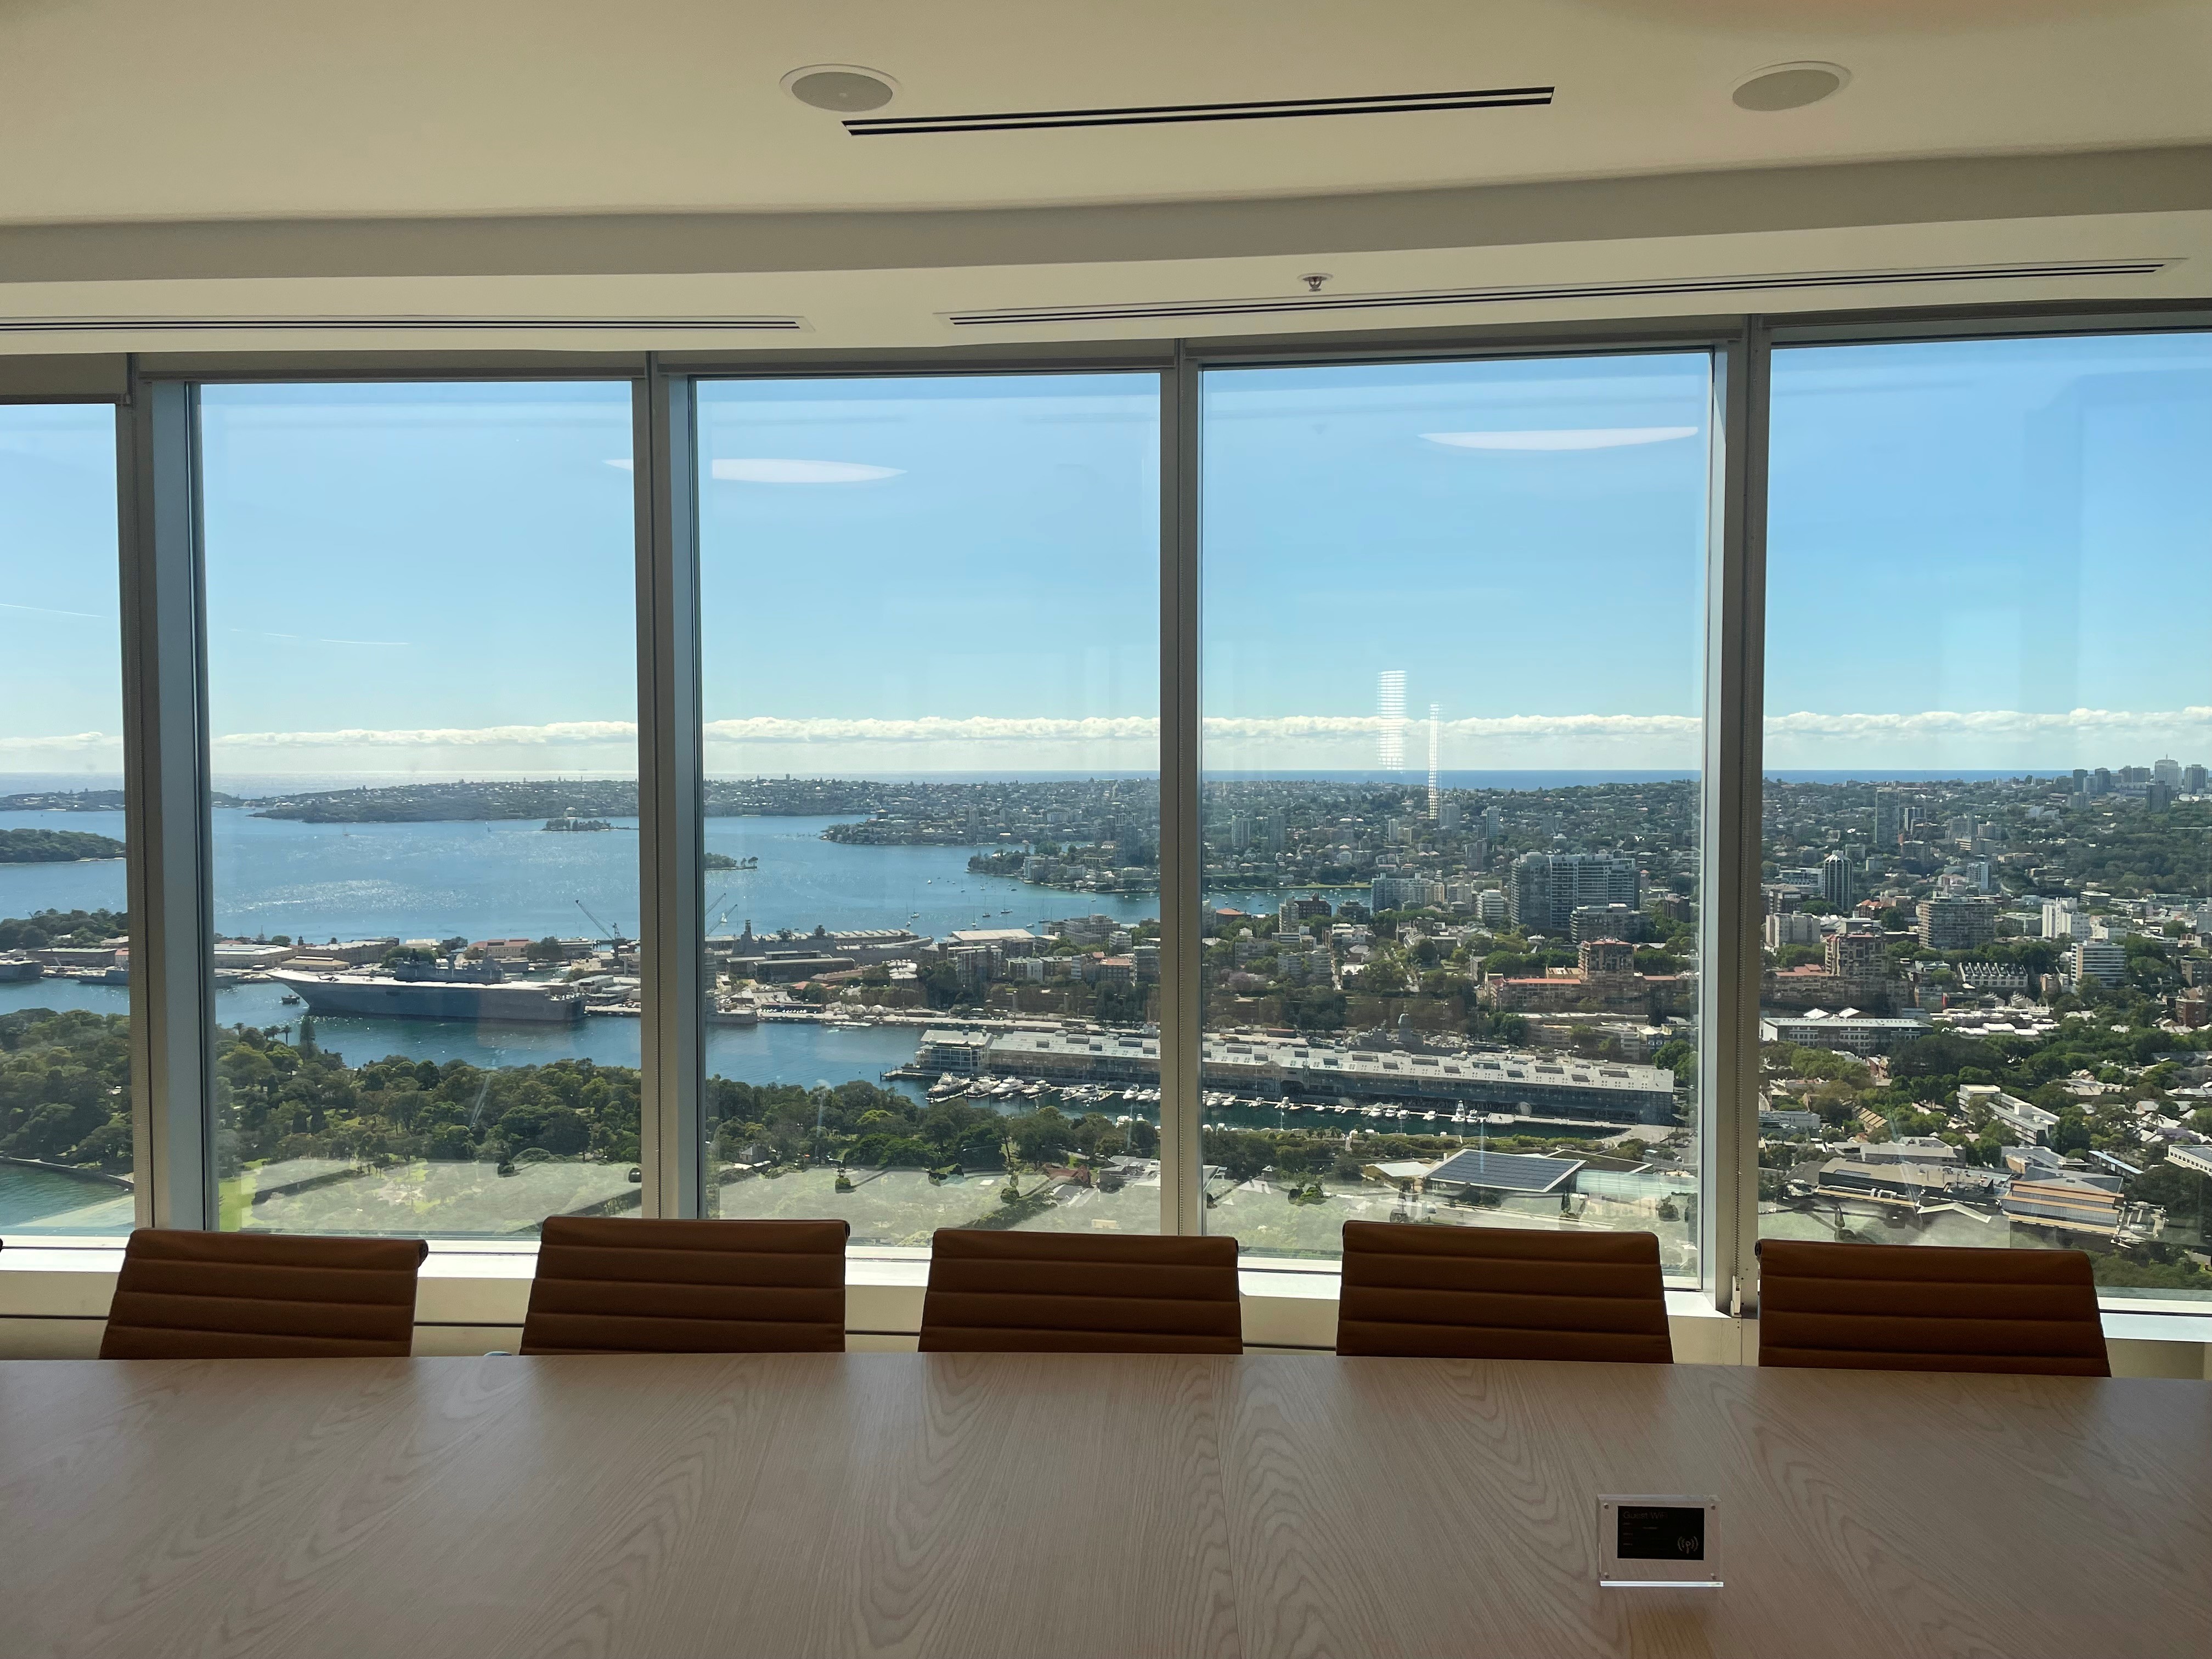
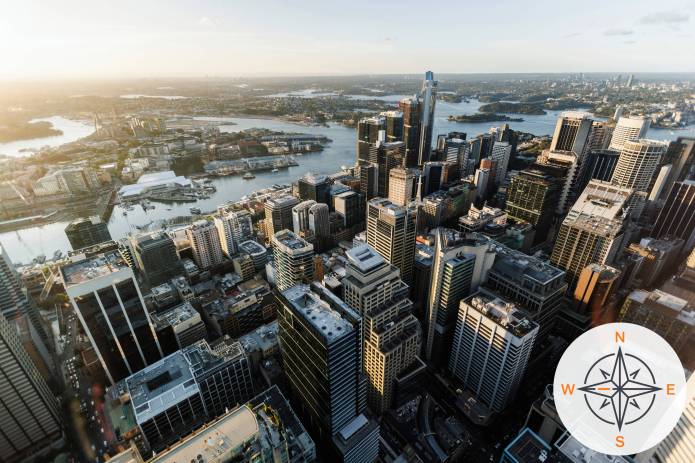
Chifley Tower view west towards Bondi. Image credit: Tim Gibson.
Due to complete in mid-2027, it looks to be one of the most sought-after locations and has already attracted investment banks UBS and Morgan Stanley as anchor tenants. In addition to new office space with amazing views, the Chifley development will offer ‘must have’ facilities such as fitness and wellness offerings, as well as additional ’third spaces‘. This reflects a theme in office markets globally i.e. the flight to quality, which seems to be the new base level as employers seek to get employees back into the office for longer.
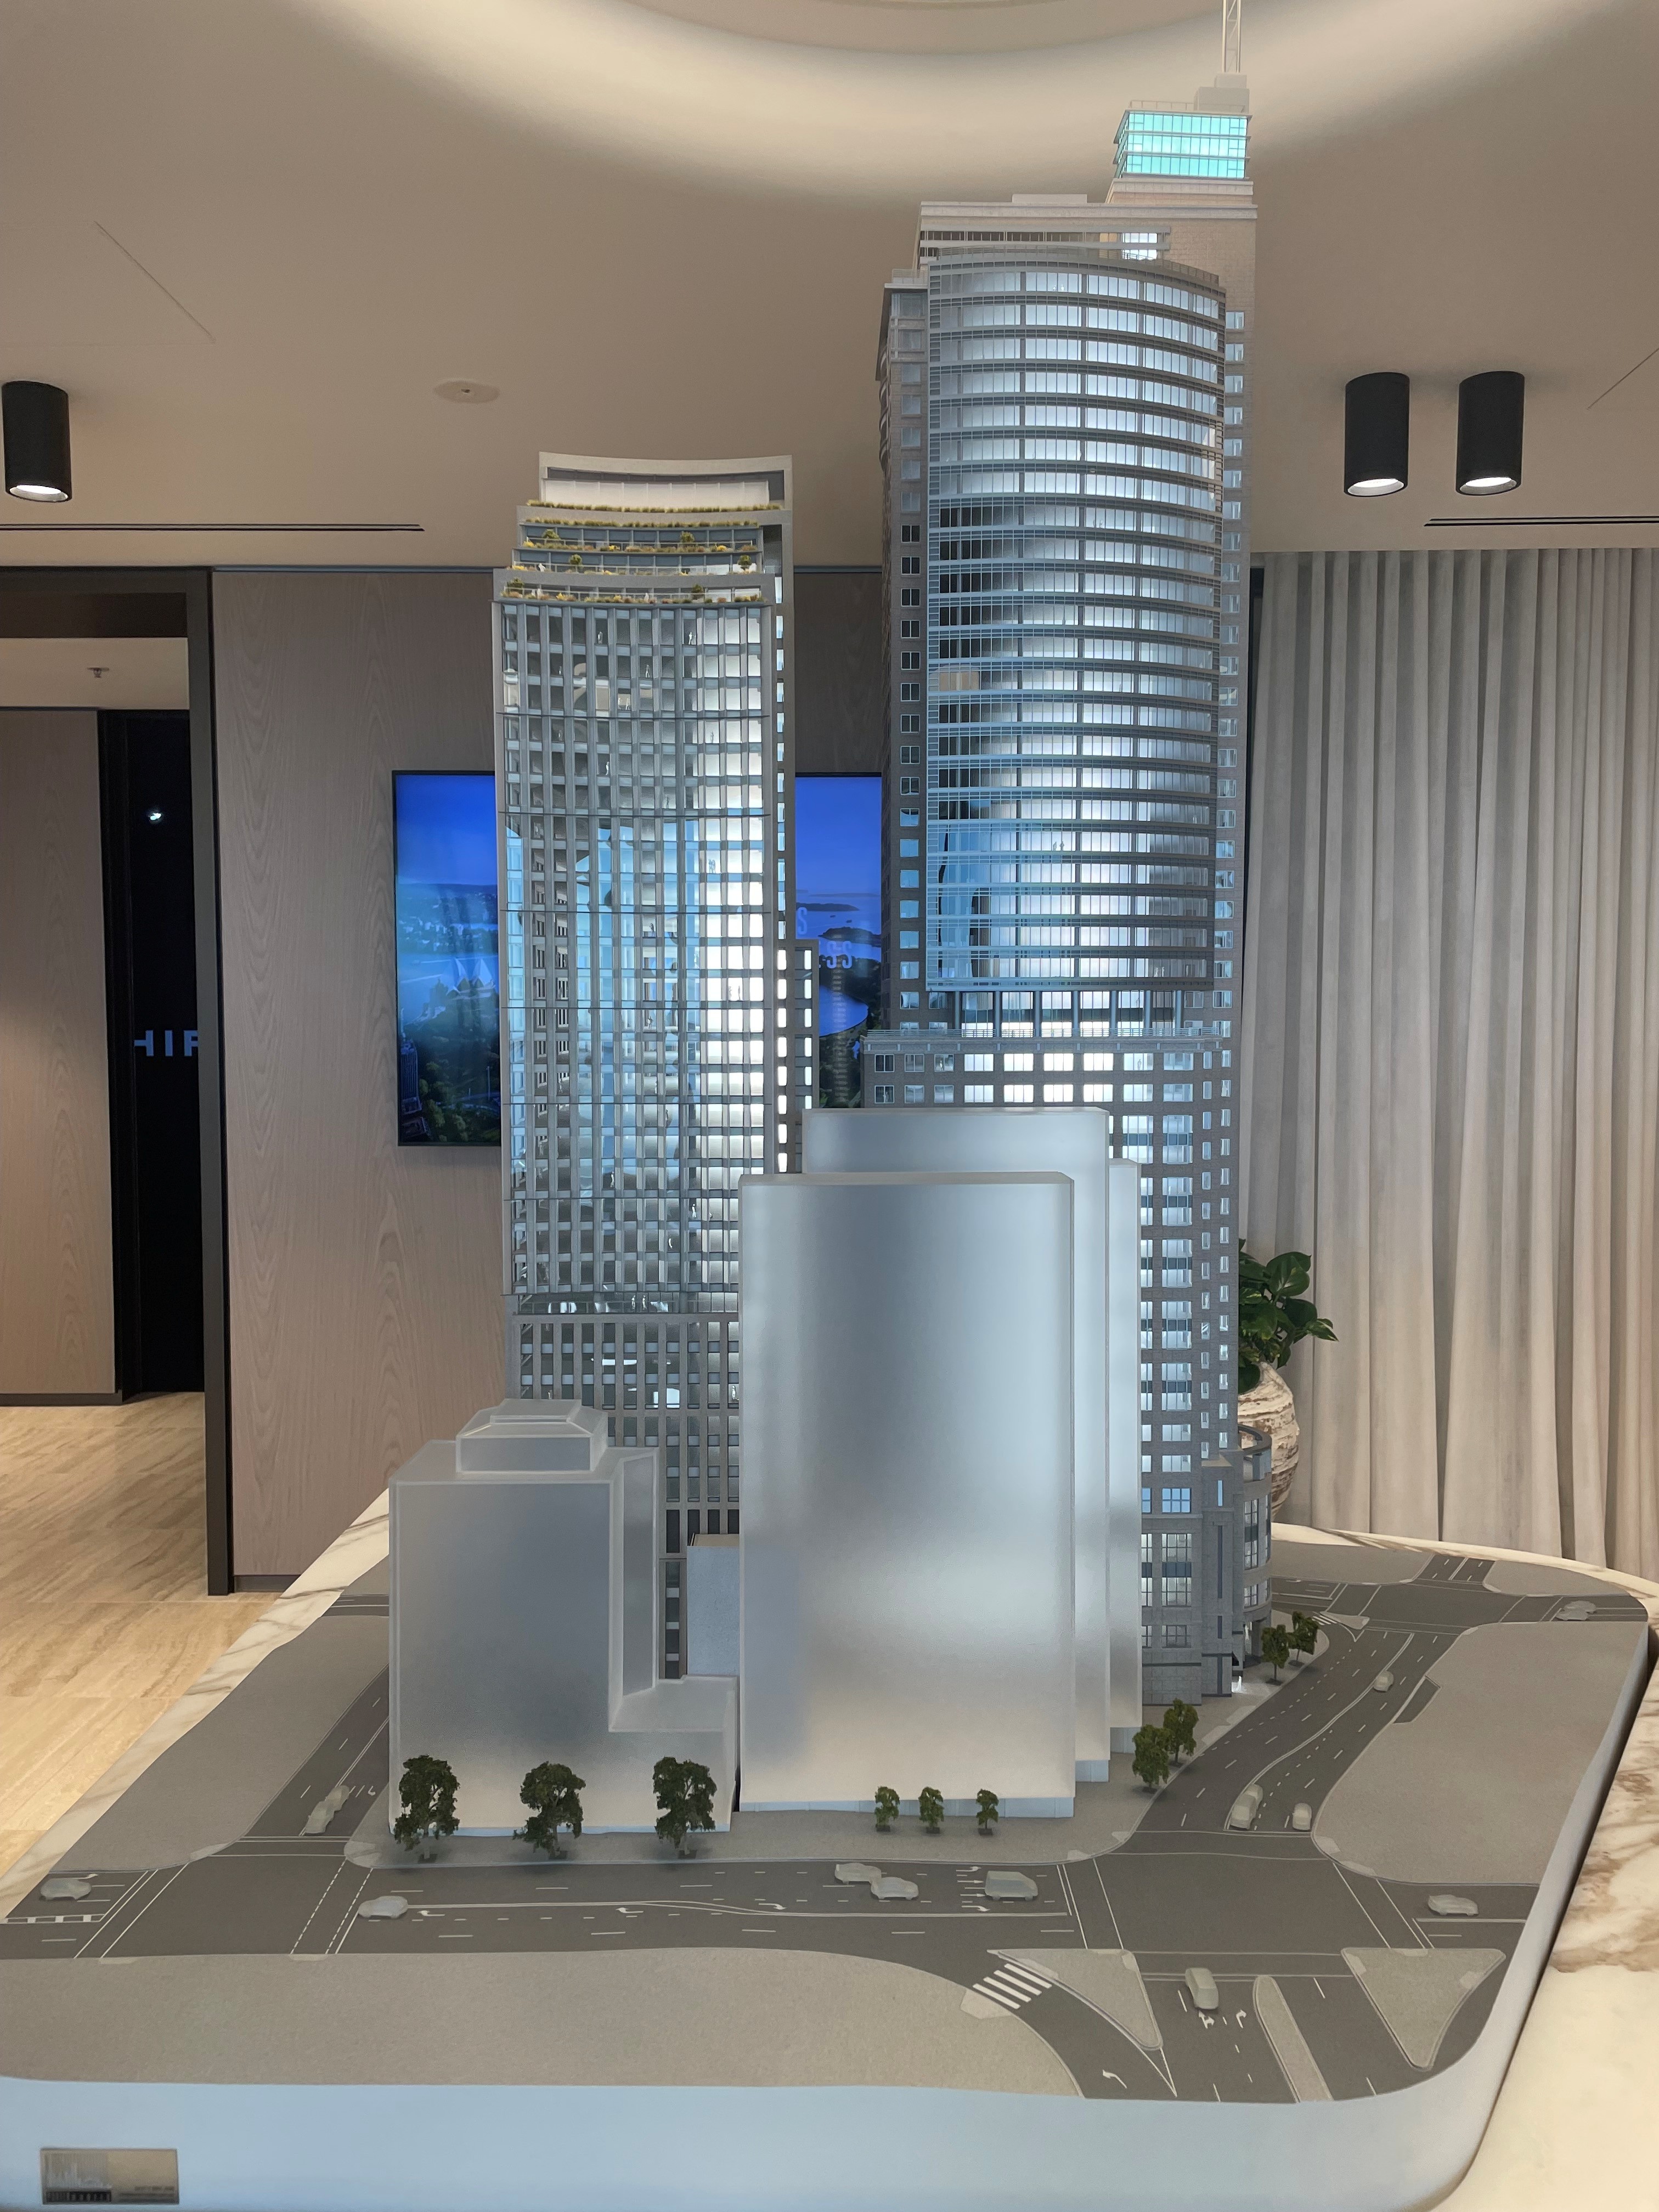
Scale model of Chifley development with new South Tower. Image credit: Tim Gibson.
However, dig a little deeper and we find that even for this new super prime asset, incentives remain in line with the market at 30% of the property’s headline gross rental value. While future supply remains muted with no new developments in 2026 and half of the 2027 pipeline already preleased, there is still a current vacancy rate of 14%. Today, Chifley South is 55% pre-leased, but this includes the developer Charter Hall taking 60,000sqft as their headquarters. No doubt this number will improve as completion nears, but for now, tenants have bargaining power.
Figure 1: Sydney central business district (CBD) upcoming major development projects
Total Net Lettable Area (NLA) in sqm
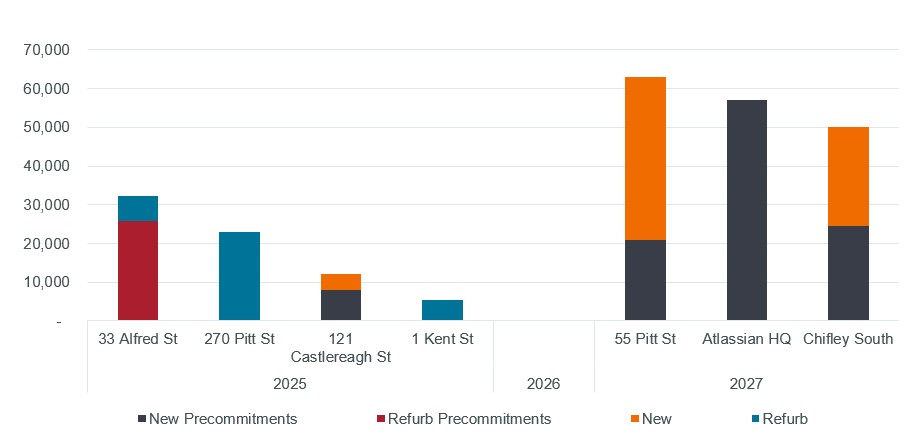
Source: CBRE Research; Sydney CBD; 3Q 2025.
Is Sydney office market weakness due to a lack of sellers rather than a lack of buyers?
According to CBRE, as of Q3 2025, the Sydney CBD office vacancy rate stands at 13.7%, with previously announced supply hitting the market. Prime vacancy sits at over 14% with secondary at 13%. The good news is that this vacancy level is expected to peak as new supply is more muted, tenant enquiry levels have increased and subleased space is being withdrawn.
Figure 2: Sydney CBD office vacancy rates by grade
Overall vacancy rate
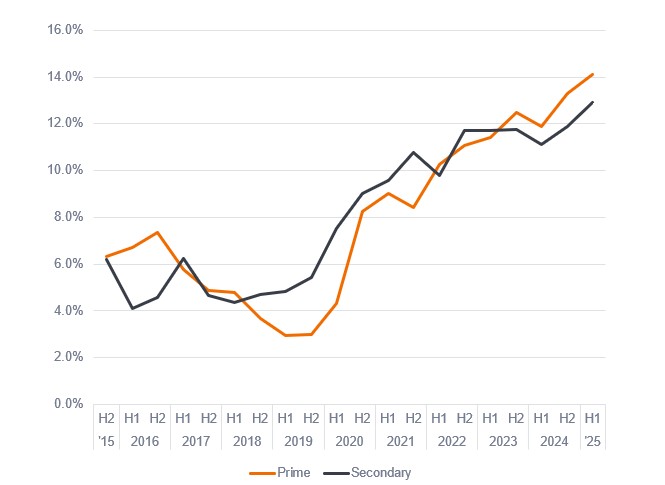
Source: PCA; CBRE Research; Sydney CBD; 3Q 2025.
Incentive levels also look to have peaked having soared during COVID. Currently they average around 31% in the core areas but are up to 44% (!) in the less sought after areas such as the Western Corridor. This means landlords don’t receive any rent, and are in fact cash flow negative due to service charges and other expenses, for almost half the lease!
As for the investment market, 2025 looks set to be one of the worst in terms of volume for a decade. Indeed circa AUD$2 billion of deals will put it on par with the depths of the pandemic in 2020. The big difference over this five-year period is that interest rates have increased, and property valuations have fallen to reflect this. One could argue that perhaps the lack of transactions reflects a lack of sellers rather than a lack of buyers. Indeed, in signs of a potential thawing in the market, in October GPT Group announced it would purchase a 50% interest in Grosvenor Place for $860m at a 7% yield (assuming fully let),1 currently the building is 30% vacant.
However, for older assets and severe laggards on the sustainability front, challenges will persist. Owners must either invest in significant refurbishments or face lingering high vacancy and incentive levels – this is not an enviable decision to have to make.
Conclusion
Sydney’s office market today reflects many of the themes within the office market globally, namely a two-tier market between older, out-of-favour assets, versus newer assets that cater to the needs of today’s tenants. The Chifley development is an example of what aspects tenants desire, namely new modern buildings combining lifestyle and wellness facilities, as well as sustainability credentials.
As the market adapts, the message for property owners is clear – quality is now everything, and the view from the top is as exclusive as ever.
1 Financial Standard; CSC enters partnership with GPT with $860m sale; 24 October 2025.
Cash flow: The net balance of cash that moves in and out of a company. Positive cash flow shows more money is moving in than out, while negative cash flow means more money is moving out than into the company.
Property yield: Annual return on a property investment usually expressed as a percentage of the capital value.
These are the views of the author at the time of publication and may differ from the views of other individuals/teams at Janus Henderson Investors. References made to individual securities do not constitute a recommendation to buy, sell or hold any security, investment strategy or market sector, and should not be assumed to be profitable. Janus Henderson Investors, its affiliated advisor, or its employees, may have a position in the securities mentioned.
Past performance does not predict future returns. The value of an investment and the income from it can fall as well as rise and you may not get back the amount originally invested.
The information in this article does not qualify as an investment recommendation.
There is no guarantee that past trends will continue, or forecasts will be realised.
Marketing Communication.