Interest rates set the music for publicly listed alternatives in 2024
Markets are tied to interest rates and the direction of bond yields as we move into 2024. Portfolio Manager James de Bunsen considers three key questions for investors in publicly listed alternatives.


10 minute read
Key takeaways:
- Just like mainstream assets, alternatives, such as private equity, private debt, property and infrastructure, have been beholden to interest rates and bond yields.
- Inflation pressures seem to be receding, while growth is also decelerating, suggesting interest rate cuts in 2024.
- That could be positive for several areas, including listed private equity funds, listed infrastructure and renewable energy investment companies, where assets seem materially undervalued due to conservative pricing structures, and REITs.
Interest rates and bond yields hold all asset classes in their thrall as we go into 2024. This includes alternatives, such as private equity, private debt, property and infrastructure. For those alternatives in a liquid, listed wrapper – in other words investment companies and REITs – this has been particularly acute in recent years. While private markets mostly generated positive returns in both 2022 and 2023, with their (commonly) quarterly and mark-to-model (marks) valuations seemingly untouched by the spike in rates, listed equivalents have, in technical parlance, taken a bath.
This leads to three key questions for 2024. What is the future direction of interest rates? Are underlying private market valuations credible? And how attractive are listed alternative share prices in light of the previous two answers?
Trends in current data give us reasonably high conviction that interest rates have peaked, probably bond yields too, all along the curve. This is incontrovertibly positive for any business model with leverage (debt), and also for valuations (which tend to be negatively correlated with yields). At the very least, the situation for debt servicing costs or valuations based on discounted cash flows seems unlikely to be worse than expected. How quickly it improves is harder to call, but inflation pressures certainly appear to be diminishing quickly in terms of goods and more slowly in terms of services. Growth is also decelerating, meaning interest rate cuts are highly probable in 2024.
Will this have any impact on those preternaturally robust private market valuations? If they didn’t adjust lower for a 4% (400 basis points, in financial parlance) rise in yields, then why would they benefit from lower rates? That is a fair point, but perhaps misses a key but overlooked feature of private markets – they are often highly conservative. This is particularly evident in listed alternatives where the governance and oversight of valuation methodologies is perhaps most robust.
For listed private equity funds (vehicles that hold investments in assets not listed on a public stock exchange), we can look at how valuations in portfolios compare to listed companies as a guide to what constitutes fair value. But as the adage goes, something is only worth what someone is willing to pay for it. As Figure 1 shows, listed private equity funds have sold assets at a significant premium in 2023 – measured as an average uplift on valuations on sale (during an IPO drought, no less). So, to answer the second question, transactional evidence points to material undervaluation versus the consensus view that marks are simply too high.
Figure 1: Are private equity valuations conservative, rather than excessively optimistic?
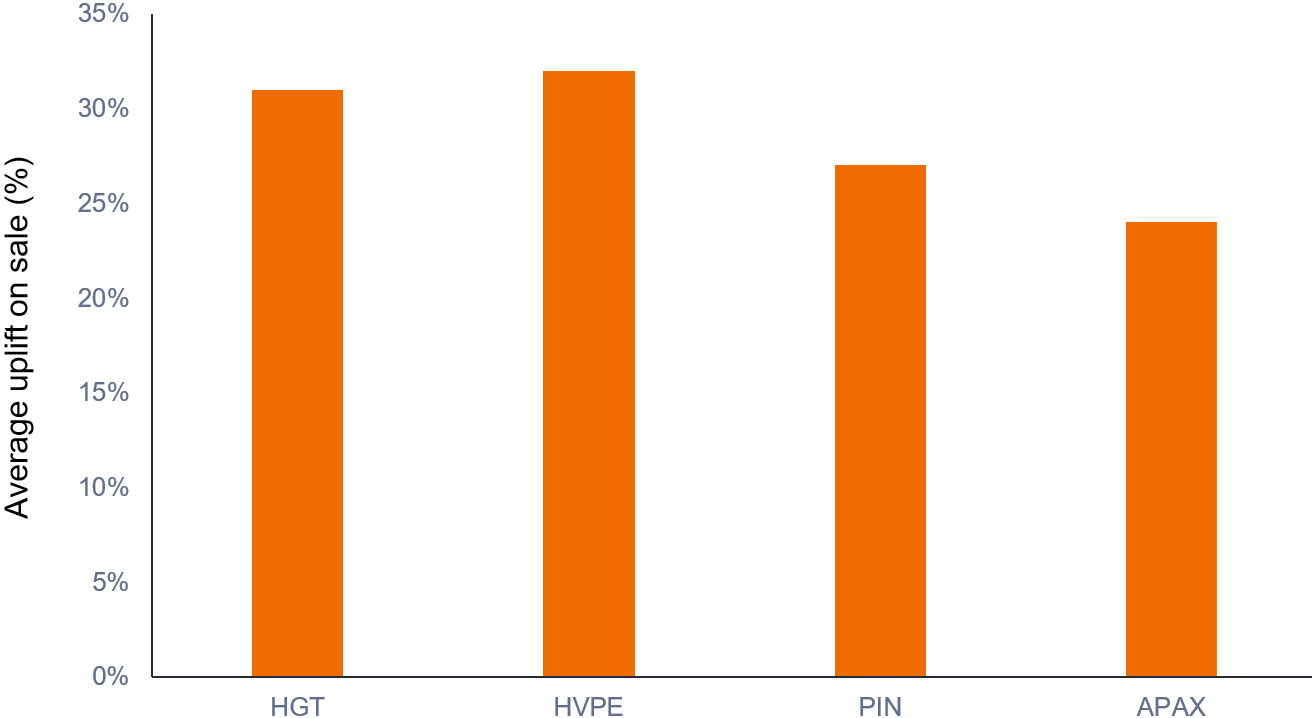
Source: Company results. HGT = Hg Capital (12 months to Sept 2023). HVPE = HarbourVest (6 months to July 2023). PIN = Pantheon International (12 months to May 2023). APAX = Apax Global Alpha (6 months to June 23). Past performance does not predict future returns. Note: References made to individual securities do not constitute a recommendation to buy, sell or hold any security, investment strategy or market sector, and should not be assumed to be profitable. Janus Henderson Investors, its affiliated advisor, or its employees, may have a position in the securities mentioned.
We see a similar trend in listed infrastructure and renewable energy investment companies. These assets are valued on a discounted cashflow basis, where future earnings are discounted back to the present day using an appropriate interest rate. This ‘discount rate’ is derived from the risk-free rate (eg. short-term government bond yields) and a risk premium. Assuming the actual risk of these underlying assets has remained fairly stable (which affects the risk premium), then higher government bond yields would suggest lower valuations, as the discount rate on future cashflows has increased.
However, we have observed over the years that discount rates have remained in a tight range, even though bond yields have fallen consistently for more than a decade. This stability was achieved as valuers increased the risk premium element of the discount rate. This was done, not to reflect a higher level of risk in the underlying assets, but with the same conservatism shown by valuers of private equity companies. And, once again, beyond these mark-to-model valuation practices, we have been able to observe market transactions at levels higher than carrying values (a measure of the value of a company based on what is provided on its balance sheet).
So, as net asset values (NAVs) across these sectors have risen, but share prices have fallen, is the market seeing something else on the horizon to get pessimistic about? Well, infrastructure and renewables earnings are pretty rock solid even in a slowdown. Contracts are long dated, linked to inflation and with very strong counterparties, or backed by government subsidies. For private equity companies there is always the risk of slowing earnings, but this does not seem to be worrying mainstream index investors at the moment, in line with the consensus of a soft landing. Leverage is a concern but, so far, we see some red flags but no systemic issue.
If fundamentals look fine, and interest rates are turning into a tailwind, then what is the problem? Certainly, we think the market underappreciates some of the factors mentioned above, but that does not adequately explain why listed alternatives are trading at levels not seen since the global financial crisis – a radically more challenging time for financial markets.
We believe it is a confluence of other factors, that could loosely be bracketed under the heading of ‘technicals’. These would chiefly be:
- A rotation into other more liquid, low-risk, income generating assets (for example, bonds)
- FTSE 250 Index selling, based on UK economic pessimism
- Outflows driven by new cost disclosure rules concerning investment companies. While it is hard to persuasively argue the case for investors to fall in love with the UK again, there are clear signs that selling pressures are easing. There is also progress on the regulatory front, to end the requirement for funds to aggregate costs for listed investment companies, a longstanding concern in the financial industry.
In our view, buying fundamentally strong companies at a steep discount to what you believe they are worth is typically a rewarding mix, and this is where we find ourselves today.
We also think that this environment should be supportive for REITs to potentially do well in 2024. Here, the story has been one of a material reset of valuations for properties as yields ratcheted higher. Assets have re-priced quicker than at any time in history, and while some over-leveraged players (ie, those with excessive debt) have been forced to hold fire sales, most putative sellers and buyers have not been able to agree on a price. Hence, transaction volumes have cratered and there is still some scepticism about whether we have actually reached the bottom. In the areas we like, such as logistics, build-to-rent and student property, not only are fundamentals very strong, but completed transactions also bear out valuations. Moreover, historic data suggests that REITs often start to rally in advance of interest rate cuts. The conviction that they have peaked is the catalyst.
Alternatives: An investment that is not included among the traditional asset classes of equities, bonds or cash, such as property or infrastructure, hedge funds, commodities, private equity, art, derivatives, or cryptocurrencies.
Balance sheet: A statement of the assets, debts and capital of a business at a particular point in time, which includes details of the amount of income and expenditure over a preceding period.
Basis point (bps): One basis point equals 1/100 of a percentage point. 1 bp = 0.01%, 100 bps = 1%.
Bond yield: The level of income on a security expressed as a percentage rate. For a bond, at its most simple, this is calculated as the coupon payment divided by the current bond price. There is an inverse relationship between bond yields and bond prices. Lower bond yields mean higher bond prices, and vice versa.
Balance sheet: A statement of the assets, debts and capital of a business at a particular point in time, which includes details of the amount of income and expenditure over a preceding period.
Carrying value: A valuation measure, where the value of a business, for example, is based on information provided in the company’s balance sheet.
Counterparty: The other party in a contract agreement, or financial transaction.
Discounted cash flow: A means of valuing a company based on expectations of the money it might be expected to generate in future.
FTSE 250 Index: The 101st to 350th largest companies listed on the London Stock Exchange.
Inflation: The rate at which the prices of goods and services are rising in an economy. The Consumer Price Index (CPI) and Retail Price Index (RPI) are two common measures.
Initial Public Offering (IPO): The process of issuing shares in a private company to the public for the first time.
Leverage: A word with multiple meanings in financial markets:
1. The use of borrowing to increase exposure to an asset/market. This can be done by borrowing cash and using it to buy an asset, or by using financial instruments such as derivatives to simulate the effect of borrowing for further investment in assets.
2. Leverage is also an interchangeable term for ‘gearing’: the ratio of a company’s loan capital (debt) to the value of its ordinary shares (equity); it can also be expressed in other ways such as net debt as a multiple of earnings, typically net debt/EBITDA (earnings before interest, tax, depreciation and amortisation). Higher leverage equates to higher debt levels.
Liquid assets: Liquidity is a measure of how easily an asset can be bought or sold in the market. Assets that can be easily traded in the market in high volumes (without causing a major price move) are referred to as ‘liquid’.
Listed alternatives: Assets listed on a stock exchange, such as investment companies or real-estate investment trust (REIT).
Mark-to-model: A pricing method for an investment or portfolio that does not have a regular market to provide a consistent, regular pricing of assets, or valuations that rely on different variables or timeframes. Pricing for these models can be based on various assumptions, or estimates.
NAV (Net Asset Value): The total value of a fund’s (or company’s) assets, minus its liabilities.
Private markets (private equity/private debt: Investments that are not listed on a stock exchange, commonly priced less regularly than listed assets. These tend to be structured differently and can involve investors committing large amounts of money for long periods of time.
Risk free rate: The rate of return of an investment with, theoretically, zero risk. The benchmark for the risk-free rate varies between countries. In the US, for example, the yield on a three-month US Treasury bill (a short-term money market instrument) is often used.
REIT: An investment vehicle that invests in real estate, through direct ownership of property assets, property shares or mortgages. As they are listed on a stock exchange, REITs are usually highly liquid and trade like shares. Real estate securities, including REITs may be subject to additional risks, including interest rate, management, tax, economic, environmental and concentration risks.
Soft landing: The objective of central bank policy when it increases interest rates to counteract inflation. Too high, and it could have negative implications for the economy. Too low and it could fail to rein in inflation. A soft landing is a slowdown in economic growth that avoids a recession.
(Yield) curve: A graph that plots the yields of similar quality bonds against their maturities, commonly used as an indicator of investors’ expectations about a country’s economic direction. The shape of the yield curve can vary significantly, depending on where investors expect yields to trend in future.
IMPORTANT INFORMATION
The views presented are as of the date published. They are for information purposes only and should not be used or construed as investment, legal or tax advice or as an offer to sell, a solicitation of an offer to buy, or a recommendation to buy, sell or hold any security, investment strategy or market sector. Nothing in this material shall be deemed to be a direct or indirect provision of investment management services specific to any client requirements. Opinions and examples are meant as an illustration of broader themes, are not an indication of trading intent, are subject to change and may not reflect the views of others in the organization. It is not intended to indicate or imply that any illustration/example mentioned is now or was ever held in any portfolio. No forecasts can be guaranteed and there is no guarantee that the information supplied is complete or timely, nor are there any warranties with regard to the results obtained from its use. Janus Henderson Investors is the source of data unless otherwise indicated, and has reasonable belief to rely on information and data sourced from third parties. Past performance does not predict future returns. Investing involves risk, including the possible loss of principal and fluctuation of value.
Not all products or services are available in all jurisdictions. This material or information contained in it may be restricted by law, may not be reproduced or referred to without express written permission or used in any jurisdiction or circumstance in which its use would be unlawful. Janus Henderson is not responsible for any unlawful distribution of this material to any third parties, in whole or in part. The contents of this material have not been approved or endorsed by any regulatory agency.
Janus Henderson Investors is the name under which investment products and services are provided by the entities identified in the following jurisdictions: (a) Europe by Janus Henderson Investors International Limited (reg no. 3594615), Janus Henderson Investors UK Limited (reg. no. 906355), Janus Henderson Fund Management UK Limited (reg. no. 2678531), (each registered in England and Wales at 201 Bishopsgate, London EC2M 3AE and regulated by the Financial Conduct Authority) and Janus Henderson Investors Europe S.A. (reg no. B22848 at 2 Rue de Bitbourg, L-1273, Luxembourg and regulated by the Commission de Surveillance du Secteur Financier); (b) the U.S. by SEC registered investment advisers that are subsidiaries of Janus Henderson Group plc; (c) Canada through Janus Henderson Investors US LLC only to institutional investors in certain jurisdictions; (d) Singapore by Janus Henderson Investors (Singapore) Limited (Co. registration no. 199700782N). This advertisement or publication has not been reviewed by Monetary Authority of Singapore; (e) Hong Kong by Janus Henderson Investors Hong Kong Limited. This material has not been reviewed by the Securities and Futures Commission of Hong Kong; (f) South Korea by Janus Henderson Investors (Singapore) Limited only to Qualified Professional Investors (as defined in the Financial Investment Services and Capital Market Act and its sub-regulations); (g) Japan by Janus Henderson Investors (Japan) Limited, regulated by Financial Services Agency and registered as a Financial Instruments Firm conducting Investment Management Business, Investment Advisory and Agency Business and Type II Financial Instruments Business; (h) Australia and New Zealand by Janus Henderson Investors (Australia) Limited (ABN 47 124 279 518) and its related bodies corporate including Janus Henderson Investors (Australia) Institutional Funds Management Limited (ABN 16 165 119 531, AFSL 444266) and Janus Henderson Investors (Australia) Funds Management Limited (ABN 43 164 177 244, AFSL 444268); (i) the Middle East by Janus Henderson Investors International Limited, regulated by the Dubai Financial Services Authority as a Representative Office. This document relates to a financial product which is not subject to any form of regulation or approval by the Dubai Financial Services Authority (“DFSA”). The DFSA has no responsibility for reviewing or verifying any prospectus or other documents in connection with this financial product. Accordingly, the DFSA has not approved this document or any other associated documents nor taken any steps to verify the information set out in this document, and has no responsibility for it. The financial product to which this document relates may be illiquid and/or subject to restrictions on its resale. Prospective purchasers should conduct their own due diligence on the financial product. If you do not understand the contents of this document you should consult an authorised financial adviser. No transactions will be concluded in the Middle East and any enquiries should be made to Janus Henderson. We may record telephone calls for our mutual protection, to improve customer service and for regulatory record keeping purposes.
For use only by institutional, professional, qualified and sophisticated investors, qualified distributors, wholesale investors and wholesale clients as defined by the applicable jurisdiction. Not for public viewing or distribution. Marketing Communication.
Janus Henderson and Knowledge Shared are trademarks of Janus Henderson Group plc or one of its subsidiaries. © Janus Henderson Group plc.
10 minute read
Key takeaways:
- Just like mainstream assets, alternatives, such as private equity, private debt, property and infrastructure, have been beholden to interest rates and bond yields.
- Inflation pressures seem to be receding, while growth is also decelerating, suggesting interest rate cuts in 2024.
- That could be positive for several areas, including listed private equity funds, listed infrastructure and renewable energy investment companies, where assets seem materially undervalued due to conservative pricing structures, and REITs.
Related insights

