The importance of the macro environment within emerging markets equities
In the first of a two-part series, Portfolio Manager Daniel Graña explores the inputs of the “growth equation” and identifies which emerging market (EM) countries measure up on potentially delivering future economic growth and attractive equity returns.


9 minute read
Key takeaways:
- A combination of capital, labor, productivity, and sound governance helps create the conditions necessary for a thriving private sector led by innovative and entrepreneurial companies.
- While India, Saudi Arabia, and Mexico are endowed with favorable demographics, governments in these countries must ensure that younger populations have ample economic opportunity, lest they become politically restive.
- A select group of countries – among them, India, Vietnam, and Mexico – are positioned to be the main beneficiaries of capital investment as global supply chains decouple from China.
Successful investing in emerging market (EM) equities requires a multifaceted approach. Identifying those innovative, entrepreneur-led companies that are likely to drive economic growth is a key ingredient, but macro factors matter as well.
History tells us that there is a strong relationship between a country’s macroeconomic operating environment and equity returns. Countries with favorable macro environments put their private sector in a position to thrive and, in turn, increase national wealth. Companies operating under such conditions are likely to sustain growth rates for longer durations, enabling investors to value future cash flows at lower discount rates thanks to benign monetary policy.
But what makes a favorable macro operating environment? In this note – the first of a two-part series – we lay out what we believe to be the necessary conditions that put countries on the right path to having a thriving private sector capable of generating attractive equity returns. We also score several EM countries with respect to these drivers. In the next installment, we will explore how these countries stack up on policy direction.
Of course, this analysis cannot be too rigid, and while countries with pro-growth and pro-business policies are more fertile hunting grounds for identifying those companies capable of generating consistent earnings growth, they do not hold a monopoly. In some cases, countries that fall short in delivering on many components of the growth equation can still produce successful companies. Mexico and South Korea are clear examples. On the other hand, countries that have historically scored well on some key macro fundamentals may still contain sectors best avoided, as is the case with China’s bloated property sector.
The growth equation
Emerging economies do not proceed along the path toward middle-income (or higher) status by chance. It is the result of a combination of essential inputs that we call “the growth equation.” This formula provides us a with a clear framework as we seek to identify those countries that may be expected to grow sustainably.
Potential GDP growth = f (L, K, A, G)
L= Labor: A function of working-age population, labor participation rate, dependency ratio, etc.
K = Capital: A function of infrastructure, private-sector investment, housing, etc.
A= Productivity: Driven by the quality of labor and capital, and an economy’s ability to create and absorb innovation.
G= Governance: The ease of doing business, rule of law, fair and predictable regulatory regimes, government accountability, sound macro management, etc.
In short, a government that creates an environment where an increasing amount of labor and capital are applied in increasingly productive ways can stimulate higher levels of economic growth. Below are more granular descriptions of each of these critical ingredients, along with examples of some EM countries that are getting it right – and others that are not.
Labor
As is often stated, demographics is destiny. A shrinking working-age population saps an economy of dynamism, partially due to the need to care for and spend on a growing cohort of retirees. Most countries are facing slowing population growth, but for some EMs, the problem is acute as they risk growing old before becoming rich. China and Thailand fall into this category. In the case of rich countries, like Japan, redeploying wealth into capital investments to improve productivity can offset the drag on negative growth due to the labor dimension. Many EMs do not have that luxury.
Labor metrics sorted by expected median age in 2050
|
Median age both genders |
% Population above 65 years old | Birth rate/1,000 | Female labor force participation rate | |||
| 2203E | 2050E | 2023E | 2050E | 2023E | 2022A | |
| Korea | 44.7 | 55.1 | 18.4% | 37.3% | 7 | 52.7% |
| Taiwan | 43.8 | 54.5 | 17.9% | NA | 7.3 | NA |
| China | 39.9 | 48.9 | 14.1% | 29.0% | 9.7 | 61.1% |
| Thailand | 39.6 | 46.6 | 13.4% | NA | NA | 58.7% |
| Vietnam | 33.3 | 43.3 | 8.0% | NA | NA | 69.1% |
| Indonesia | 32.1 | 40.3 | 7.7% | 17.9% | 15.1 | 52.7% |
| Brazil | 33.1 | 40.1 | 10.5% | 22.3% | 13.4 | 53.6% |
| Argentina | 33.3 | 39.7 | 12.7% | 19.5% | 15.4 | 50.8% |
| Turkey | NA | NA | 9.2% | NA | 14 | 31.8% |
| Mexico | 31.4 | 39.6 | 8.0% | 17.4% | 14 | 45.7% |
| India | 29.6 | 37.2 | 6.8% | 14.8% | 16.5 | 24.0% |
| Saudi Arabia | 29.6 | 36.5 | NA | NA | NA | 27.8% |
| South Africa | 27.9 | 33.4 | 6.5% | NA | 18.2 | 50.6% |
| Philippines | 25.6 | 32.6 | 5.3% | NA | 22.2 | 46.0% |
Source: U.S. Census Bureau and World Bank (female labor participation). Note: Female labor force participation based on aged 15 years and older.
Mexico, India, Saudi, South Africa, and the Philippines score well on labor metrics, provided their economies can continue absorbing a rising labor force, in which case unrest from the economically disenfranchised could become a political issue. The Philippines and Mexico have successfully used emigration as a pressure release. Overseas remittances in these cases have aided domestic consumption and benefited these countries’ external accounts. A key motivation of the Saudi government’s Vision 2030 initiative is to mitigate the political and social risk posed by a large unemployed young population. South Africa – with its high and growing youth unemployment – is unfortunately ripe for a radical policy turn. A fast-growing population can be a poisoned chalice if mismanaged.
Capital
Developing countries require substantial infrastructure upgrades – including transportation, housing, factories, and utilities – to reach their economic potential. These projects require both domestic and foreign sources of capital, incentivized by attractive returns or subsidies. As history reminds us, such initiatives cannot be exclusively driven by state-owned enterprises given these entities’ lower levels of efficiency relative to private-sector peers.
Increasing the absolute level of capital stock is not sufficient. Return on investment matters as well, not only to maintain a continuous source of funding but also to lessen the risk of collateral damage to the domestic banking system, which is often mobilized for financing fixed asset investment.
Over the past decade, Indonesia, Vietnam, and Turkey have invested heavily in infrastructure. Latin America largely lags more successful EM peers. And while Turkey – and China – have invested heavily in fixed assets, one may rightly wonder about their ultimate effectiveness given the degree to which the state has guided investment.
A key driver of future capital formation is likely to be the re-architecting of global supply chains away from China toward other regions. We expect this to provide a secular tailwind in capital investment for Mexico, Indonesia, India, and Vietnam.
EM capital investment to GDP
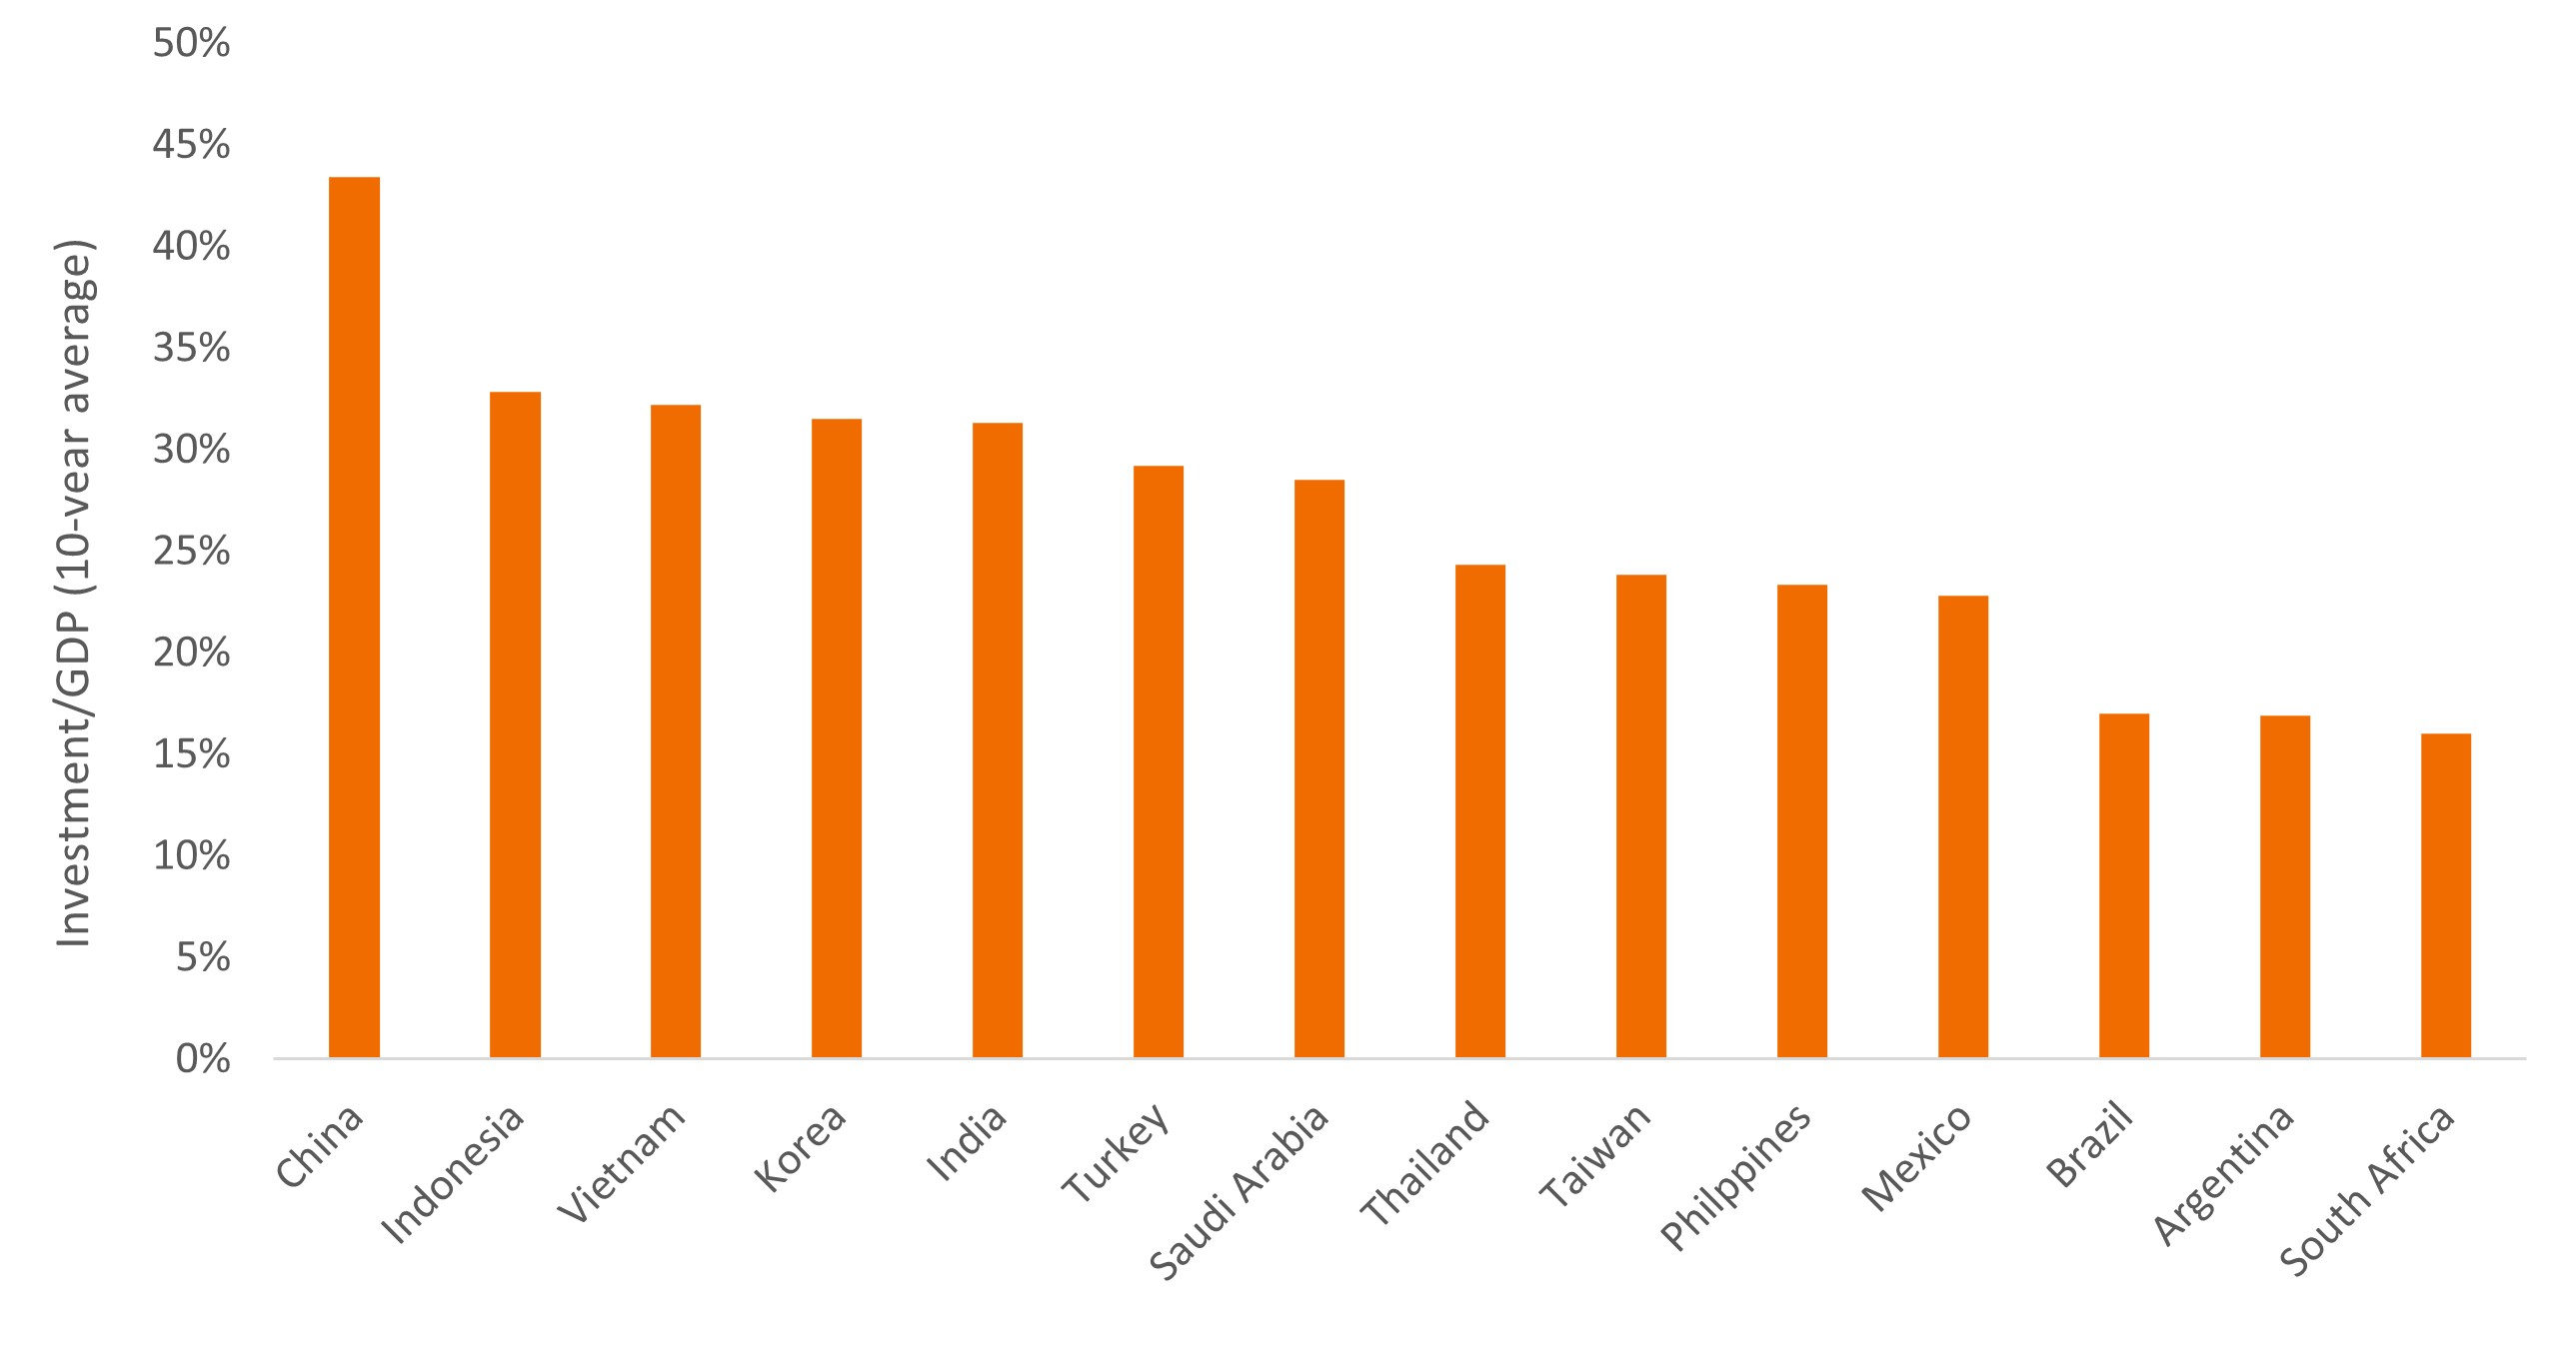 Source: International Monetary Fund, through 2023, with last year an estimate.
Productivity
Productivity is where labor and capital meet. It also increasingly relies upon the innovation revolution occurring throughout the world. It is our view that an overlooked ingredient in sufficiently unleashing productivity is the quality of a country’s capital stock and labor pool. For example, digitally enabled business models, such as streaming, could not occur in EMs until the telecommunications infrastructure improved.
With respect to the labor force, while education is often touted as a differentiator, the quality and type of education plays a key role. Well cited is the importance of STEM (science, technology, engineering, and math) curricula. Taiwan, South Korea, China, and Vietnam all score well in this category.
Labor quality sorted by % of 25-34 year olds who have completed a tertiary education
| Tertiary Education | PISA Scores | ||||
| % of 25-34-year-olds | % of 55-64-year-olds | Math | Science | Literacy rate | |
| Korea | 69.60% | 27.30% | 527 | 528 | 98.00% |
| Turkey | 41.20% | 10.80% | 453 | 476 | 95.70% |
| China | 35.80% | NA | 552 | 543 | 96.40% |
| Mexico | 27.30% | 15.70% | 395 | 410 | 94.60% |
| Saudi Arabia | 26.00% | NA | 389 | 390 | 94.80% |
| Philippines | 24.40% | NA | 355 | 356 | 96.60% |
| Brazil | 23.20% | 15.30% | 379 | 403 | 92.60% |
| India | 20.50% | 6.50% | NA | NA | 72.20% |
| Argentina | 19.00% | 24.80% | 378 | 403 | 98.10% |
| Indonesia | 17.90% | 8.80% | 366 | 383 | 95.40% |
| Thailand | 15.60% | NA | 394 | 409 | 94.00% |
| South Africa | 13.10% | 12.50% | NA | NA | 94.60% |
| Vietnam | 10.20% | NA | 469 | 472 | 94.50% |
| Taiwan | NA | NA | 547 | 537 | 96.10% |
| OECD average | 47.40% | 30.30% | 472 | 485 | NA |
| U.S. | 51.30% | 44.70% | 465 | 499 | 99.00% |
Source: Organization for Economic Co-operation and Development.
The level of business competitiveness within a country also helps determine productivity. Dominant players in highly concentrated sectors typically face less pressure to innovate. The same holds true for regulated industries (e.g., banking and utilities) and well-entrenched domestic consumer brands.
Manufacturers that export to global markets tend to face a higher degree of competitive intensity. This should spur productivity by honing the focus of management teams. Vietnam, China, Korea, Taiwan, Turkey, and Mexico fall into this category. Similarly, companies in earlier stages of industry consolidation like those in India and Vietnam also face more competition. On the other hand, commodities exporters typically do not benefit from broad-based productivity gains since employment in commodity sectors is usually modest relative to the size of the economy.
Innovation capability rankings
| Taiwan | 4 |
| Korea | 6 |
| China | 24 |
| India | 35 |
| Saudi Arabia | 36 |
| Brazil | 40 |
| South Africa | 46 |
| Turkey | 49 |
| Thailand | 50 |
| Mexico | 52 |
| Argentina | 56 |
| Philippines | 72 |
| Indonesia | 74 |
| Vietnam | 76 |
| USA | 2 |
Source: 2019 Global Competitiveness Report from the World Economic Forum, the latest year available.
Governance
In our view, an underappreciated element of the growth equation is the relative attractiveness and predictability of the operating environment companies face. Ill-defined regulatory regimes, policy disruption, and well-intentioned but poorly executed initiatives can translate to missed opportunities. In contrast, countries that provide policy predictability across economic and political cycles give company managers and investors the confidence to allocate capital over the long term.
On governance, Taiwan is the model student. India has good – with flashes of great – governance but has yet to fully disassociate itself from its statist past. Indonesia wins the most improved award with its responsible macro management. Saudi Arabia earns an incomplete grade for its ambitious Vision 2030 initiative to diversify the economy and prepare the country for a future less reliant on hydrocarbons. Turkey, Argentina, and South Africa are poor role models in the governance category.
The takeaway
While the level of contribution varies on a case-by-case basis, each of the inputs to the growth equation plays an important role in national economic development. We strongly believe that the largest driver of equity returns will be the companies themselves, but the right conditions are necessary for a private sector to thrive. Nurturing the macro environment and sustaining sound policy are equally essential.
It is also worth noting that requirements for competent policy and an attractive business environment are modest for low-income countries, as expectations rise in tandem with country income levels.
In terms of success stories, only Taiwan, South Korea, Israel, Hong Kong, and Singapore have successfully navigated from low-income to high-income status. Of these, only Taiwan and South Korea remain in the EM benchmark. Many countries tend to stall out in poorer tiers (e.g., smaller Latin American countries and sub-Saharan Africa) or fail to escape the middle-income trap (namely, Thailand, Malaysia, Turkey, Mexico, Brazil, and South Africa).
China has been the most impressive story in EM in the last few decades as hundreds of millions were lifted out of abject poverty after decades of policy mismanagement. However, there are reasons to doubt China can make the transition to high income. India’s expected long duration of growth is partially explained by the country’s low starting point.
In the next installment of this series, we’ll explore the role macro policy direction plays in creating a fertile environment for the private sector and, thus, equity returns.
Duration measures a bond price’s sensitivity to changes in interest rates. The longer a bond’s duration, the higher its sensitivity to changes in interest rates and vice versa.
Monetary Policy refers to the policies of a central bank, aimed at influencing the level of inflation and growth in an economy. It includes controlling interest rates and the supply of money.
IMPORTANT INFORMATION
Emerging market investments have historically been subject to significant gains and/or losses. As such, returns may be subject to volatility.
9 minute read
Key takeaways:
- A combination of capital, labor, productivity, and sound governance helps create the conditions necessary for a thriving private sector led by innovative and entrepreneurial companies.
- While India, Saudi Arabia, and Mexico are endowed with favorable demographics, governments in these countries must ensure that younger populations have ample economic opportunity, lest they become politically restive.
- A select group of countries – among them, India, Vietnam, and Mexico – are positioned to be the main beneficiaries of capital investment as global supply chains decouple from China.