Key takeaways:
- Amid tariff concerns and economic uncertainty, investors have gravitated to defensive sectors in 2025, driving outperformance over cyclical stocks.
- However, cyclical stocks still project stronger earnings growth through 2027, with estimates holding steady relative to defensive sectors so far this year.
- The recent market rotation has created opportunities in growth-oriented sectors where companies benefitting from strong secular trends now trade at more attractive valuations.
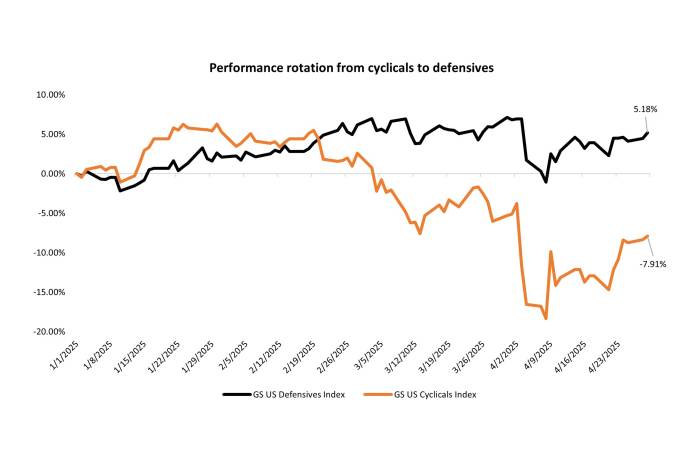
Source: Bloomberg, as of 29 April 2025. Cumulative total return from 1 January 2025 to 29 April 2025.
There is no guarantee that past trends will continue, or forecasts will be realized.
Defensive stocks (up 5.2%) have sharply outperformed cyclical stocks (down 7.9%) year to date in 2025 as investors seek shelter from economic uncertainty surrounding tariff policy and the resulting market volatility. Yet, earnings expectations tell a different story: Cyclicals are projected to outpace defensives through 2027.
| 2025 | 2026 | 2027 | ||||
| EPS | YoY EPS Growth | EPS | YoY EPS Growth | EPS | YoY EPS Growth | |
| GS US Cyclicals Index | $7.71 | 6.71% | $8.76 | 13.63% | $9.69 | 10.59% |
| GS US Defensives Index | $6.25 | 5.79% | $6.70 | 7.29% | $7.25 | 8.21% |
Source: Bloomberg, estimate headline earnings per share (EPS), as of 29 April 2025. YoY = year over year. There is no guarantee that past trends will continue, or forecasts will be realized.
With the earnings season underway, investors are watching for guidance updates and revisions, particularly as most S&P 500® Index estimates still exclude tariff impacts. First-quarter earnings trends showed resilience in cyclical sectors like technology (including semiconductors) and communication services, while estimates in defensive areas of the market like utilities and food producers saw flat to lower forecasts.
The severe rotation into defensives has created compelling opportunities in secular growth companies. Over the long term, we believe secular trends are far more powerful in driving stock returns than short-term macro fluctuations. We’re finding opportunities in secular growth companies that now trade at prices we haven’t seen in years, some of which we believe are positioned to extend their competitive advantages during a potentially challenging operating environment.
Beta measures the volatility of a security or portfolio relative to an index. Less than one means lower volatility than the index; more than one means greater volatility.
GS US Defensives Index consists of S&P 500 equities with a beta to US Gross Domestic Product (GDP) growth (via the GS US MAP score of economic data surprises) lower than the S&P 500’s beta excluding commodity input cost and other equities impacted by macro environment.
GS US Cyclicals Index consists of S&P 500 equities with a beta to US GDP growth (via the GS US MAP score of economic data surprises) higher than the S&P 500’s beta excluding energy and materials.
S&P 500® Index reflects U.S. large-cap equity performance and represents broad U.S. equity market performance.
Volatility measures risk using the dispersion of returns for a given investment.
Queste sono le opinioni dell'autore al momento della pubblicazione e possono differire da quelle di altri individui/team di Janus Henderson Investors. I riferimenti a singoli titoli non costituiscono una raccomandazione all'acquisto, alla vendita o alla detenzione di un titolo, di una strategia d'investimento o di un settore di mercato e non devono essere considerati redditizi. Janus Henderson Investors, le sue affiliate o i suoi dipendenti possono avere un’esposizione nei titoli citati.
Le performance passate non sono indicative dei rendimenti futuri. Tutti i dati dei rendimenti includono sia il reddito che le plusvalenze o le eventuali perdite ma sono al lordo dei costi delle commissioni dovuti al momento dell'emissione.
Le informazioni contenute in questo articolo non devono essere intese come una guida all'investimento.
Non vi è alcuna garanzia che le tendenze passate continuino o che le previsioni si realizzino.
Comunicazione di Marketing.
Important information
Please read the following important information regarding funds related to this article.
- Le Azioni/Quote possono perdere valore rapidamente e di norma implicano rischi più elevati rispetto alle obbligazioni o agli strumenti del mercato monetario. Di conseguenza il valore del proprio investimento potrebbe diminuire.
- Gli emittenti di obbligazioni (o di strumenti del mercato monetario) potrebbero non essere più in grado di pagare gli interessi o rimborsare il capitale, ovvero potrebbero non intendere più farlo. In tal caso, o qualora il mercato ritenga che ciò sia possibile, il valore dell'obbligazione scenderebbe.
- L’aumento (o la diminuzione) dei tassi d’interesse può influire in modo diverso su titoli diversi. Nello specifico, i valori delle obbligazioni si riducono di norma con l'aumentare dei tassi d'interesse. Questo rischio risulta di norma più significativo quando la scadenza di un investimento obbligazionario è a più lungo termine.
- Il Fondo investe in obbligazioni ad alto rendimento (non investment grade) che, sebbene offrano di norma un interesse superiore a quelle investment grade, sono più speculative e più sensibili a variazioni sfavorevoli delle condizioni di mercato.
- Un Fondo che presenta un’esposizione elevata a un determinato paese o regione geografica comporta un livello maggiore di rischio rispetto a un Fondo più diversificato.
- Il Fondo potrebbe usare derivati al fine di conseguire il suo obiettivo d'investimento. Ciò potrebbe determinare una "leva", che potrebbe amplificare i risultati dell'investimento, e le perdite o i guadagni per il Fondo potrebbero superare il costo del derivato. I derivati comportano rischi aggiuntivi, in particolare il rischio che la controparte del derivato non adempia ai suoi obblighi contrattuali.
- Se il Fondo, o una sua classe di azioni con copertura, intende attenuare le fluttuazioni del tasso di cambio tra una valuta e la valuta di base, la stessa strategia di copertura potrebbe generare un effetto positivo o negativo sul valore del Fondo, a causa delle differenze di tasso d’interesse a breve termine tra le due valute.
- I titoli del Fondo potrebbero diventare difficili da valutare o da vendere al prezzo e con le tempistiche desiderati, specie in condizioni di mercato estreme con il prezzo delle attività in calo, aumentando il rischio di perdite sull'investimento.
- Le spese correnti possono essere prelevate, in tutto o in parte, dal capitale, il che potrebbe erodere il capitale o ridurne il potenziale di crescita.
- Il Fondo potrebbe perdere denaro se una controparte con la quale il Fondo effettua scambi non fosse più intenzionata ad adempiere ai propri obblighi, o a causa di un errore o di un ritardo nei processi operativi o di una negligenza di un fornitore terzo.
- Oltre al reddito, questa classe di azioni può distribuire plusvalenze di capitale realizzate e non realizzate e il capitale inizialmente investito. Sono dedotti dal capitale anche commissioni, oneri e spese. Entrambi i fattori possono comportare l’erosione del capitale e un potenziale ridotto di crescita del medesimo. Si richiama l’attenzione degli investitori anche sul fatto che le distribuzioni di tale natura possono essere trattate (e quindi imponibili) come reddito, secondo la legislazione fiscale locale.