Chart to Watch: Insatiable demand for compute power rationalises massive capex
Rising AI use cases, token volumes and compute efficiency gains married with falling compute costs are underpinning robust AI demand, driving tech giants to invest at an unprecedented scale. This is reshaping the competitive landscape for AI infrastructure and monetisation, says Portfolio Manager Richard Clode.
We are moving to a world where progress and productivity will be measured in tokens. – Richard Clode
Key takeaways
- AI token demand is growing exponentially, driven by increasingly complex and agentic use cases, even as models become more efficient per task.
- Falling compute costs are increasing overall demand, justifying unprecedented levels of tech giants AI capex.
- Monetising tokens at scale is central to AI return-on-investment, making the ability to price, distribute, and capture usage a key competitive differentiator.
The scale of investment flowing into artificial intelligence reflects a simple reality: demand for compute is accelerating faster than efficiency gains can match. AI usage is growing exponentially even as the cost of computation per task falls – a classic case of Jevons’ Paradox, where falling costs make a resource more attractive, leading to higher demand.
Google’s token growth highlights the scale of AI demand
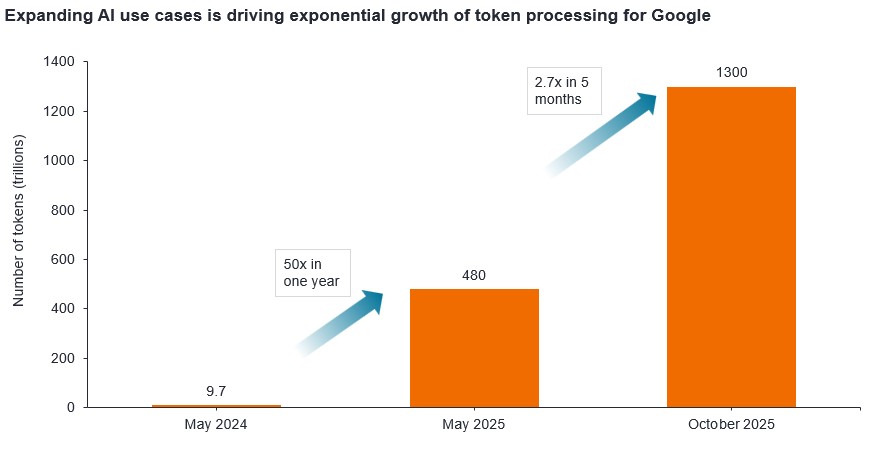
Tokens are the basic units AI models process when reading, generating, or reasoning with information. More complex and agentic AI use cases, such as autonomous research assistants, coding agents, and multimodal enterprise workflows, dramatically increase token volumes. Google has been the leader in tokens processing; monthly tokens processed jumped from 9.7 trillion in May 2024 to 480 trillion 12 months later. By October 2025 this surged dramatically to 1,300 trillion tokens (most recent data).1
Efficiency improvements remain rapid. Models such as Gemini 3 Flash use fewer tokens per task and significantly less compute, yet total demand continues to rise as AI becomes embedded across productivity, search, and decision‑making workflows.
Token monetisation can assuage AI capex concerns
Meeting insatiable AI demand requires unprecedented capital expenditure (capex). Google has signalled 2026 capex of up to US$185 billion, double that of last 2025,2 Amazon is projecting capex of US$200 billion,3 while Meta is estimating up to US$135 billion.4 NVIDIA suggests that tiered token monetisation can ultimately translate this surge in usage into durable returns, helping to justify the scale of investment.
We believe that the magnitude and duration of AI spend is still underappreciated. Coupled with a rapidly-expanding addressable market for AI, with tech sector valuations now at a five-year low to broader equities,5 active stock pickers like us have ample opportunities to identify future leaders with earnings power that is not yet fully appreciated.
1 Google blog; Q3 earnings call: Remarks from our CEO; 29 October 2025.
2 Alphabet 4Q and fiscal year 2025 results; 4 February 2026.
3 Amazon Q4 2025 results; 5 February 2026.
4 Meta Q4 2025 earnings call; 28 January 2026.
5 Bernstein data as at end February 2026. Tech sector price-to forward earnings (P/E ratio) of circa 22% versus broader equities 5-year average of 36%. Based on MSCI ACWI Information Technology Sector, price-to-forward earnings relative to MSCI ACWI Index from December 1999 to November 2018 pre GICS sector changes in MSCI Global indices, and MSCI ACWI Information Technology + ACWI Communication Services relative to MSCI ACWI Index to current post GICS sector changes in MSCI Global indices. Past performance does not predict future returns.
Agentic AI: Refers to autonomous, goal-driven AI systems that can plan, reason, and take actions to achieve complex objectives with limited human oversight, rather than just generating text or responding to prompts.
Capital expenditure: Money invested to acquire or upgrade fixed assets such as buildings, machinery, equipment, or vehicles in order to maintain or improve operations and foster future growth.
Jevon’s Paradox: A theory suggesting that greater efficiency in the use of any given resource can result in increased demand for that resource. Applying this to technology/AI chips, as technological and efficiency improvements in technology/chips increases, the overall demand for chips actually increases rather than decreases.
Price-to-earnings ratio (P/E): A popular valuation metric that measures share price compared to earnings per share for a stock or stocks in a portfolio.
Queste sono le opinioni dell'autore al momento della pubblicazione e possono differire da quelle di altri individui/team di Janus Henderson Investors. I riferimenti a singoli titoli non costituiscono una raccomandazione all'acquisto, alla vendita o alla detenzione di un titolo, di una strategia d'investimento o di un settore di mercato e non devono essere considerati redditizi. Janus Henderson Investors, le sue affiliate o i suoi dipendenti possono avere un’esposizione nei titoli citati.
Le performance passate non sono indicative dei rendimenti futuri. Tutti i dati dei rendimenti includono sia il reddito che le plusvalenze o le eventuali perdite ma sono al lordo dei costi delle commissioni dovuti al momento dell'emissione.
Le informazioni contenute in questo articolo non devono essere intese come una guida all'investimento.
Non vi è alcuna garanzia che le tendenze passate continuino o che le previsioni si realizzino.
Comunicazione di Marketing.
Important information
Please read the following important information regarding funds related to this article.
- Le Azioni/Quote possono perdere valore rapidamente e di norma implicano rischi più elevati rispetto alle obbligazioni o agli strumenti del mercato monetario. Di conseguenza il valore del proprio investimento potrebbe diminuire.
- Un Fondo che presenta un’esposizione elevata a un determinato paese o regione geografica comporta un livello maggiore di rischio rispetto a un Fondo più diversificato.
- Il Fondo si concentra su determinati settori o temi d’investimento e potrebbe risentire pesantemente di fattori quali eventuali variazioni ai regolamenti governativi, una maggiore competizione nei prezzi, progressi tecnologici ed altri eventi negativi.
- Questo Fondo può avere un portafoglio particolarmente concentrato rispetto al suo universo d’investimento o altri fondi del settore. Un evento sfavorevole riguardante anche un numero ridotto di partecipazioni potrebbe creare una notevole volatilità o perdite per il Fondo.
- Il Fondo potrebbe usare derivati al fine di ridurre il rischio o gestire il portafoglio in modo più efficiente. Ciò, tuttavia, comporta rischi aggiuntivi, in particolare il rischio che la controparte del derivato non adempia ai suoi obblighi contrattuali.
- Qualora il Fondo detenga attività in valute diverse da quella di base del Fondo o l'investitore detenga azioni o quote in un'altra valuta (a meno che non siano "coperte"), il valore dell'investimento potrebbe subire le oscillazioni del tasso di cambio.
- Se il Fondo, o una sua classe di azioni con copertura, intende attenuare le fluttuazioni del tasso di cambio tra una valuta e la valuta di base, la stessa strategia di copertura potrebbe generare un effetto positivo o negativo sul valore del Fondo, a causa delle differenze di tasso d’interesse a breve termine tra le due valute.
- I titoli del Fondo potrebbero diventare difficili da valutare o da vendere al prezzo e con le tempistiche desiderati, specie in condizioni di mercato estreme con il prezzo delle attività in calo, aumentando il rischio di perdite sull'investimento.
- Il Fondo potrebbe perdere denaro se una controparte con la quale il Fondo effettua scambi non fosse più intenzionata ad adempiere ai propri obblighi, o a causa di un errore o di un ritardo nei processi operativi o di una negligenza di un fornitore terzo.