Chart to Watch: Will stronger global small cap earnings forecasts be the catalyst for a valuation reset?
Nick Sheridan and Richard Brown examine whether improving earnings forecasts could help global small caps regain their historical growth premium over large caps.
Source: Bloomberg, Janus Henderson Investors analysis, as at 22 June 2026. There is no guarantee that past trends will continue, or forecasts will be realised. Past performance does not predict future returns.
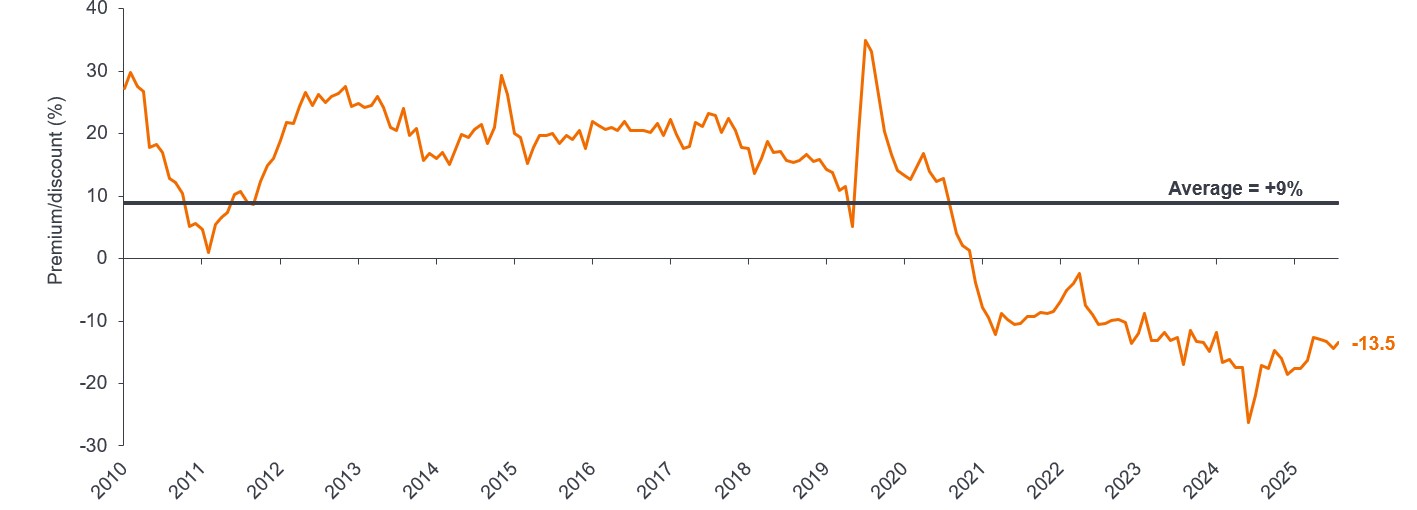
Small caps have outperformed large caps year-to-date despite the geopolitical backdrop and the shift in rate expectations. The drivers appear to be improving macro expectations and the lower valuations on offer in small caps. Should stronger earnings growth materialise as the market expects, it is reasonable to expect the current valuation discount to large caps may narrow.
Key takeaways
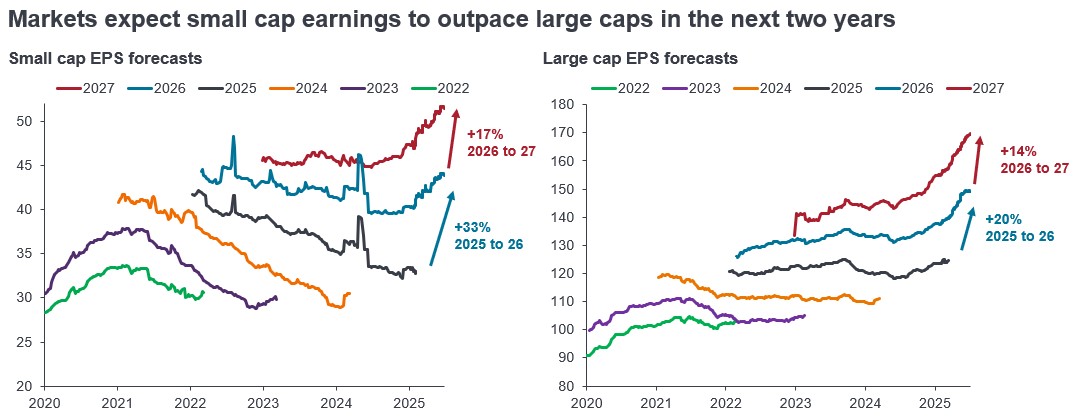
- Small-cap earnings are forecast to rebound strongly, rising by 33% from 2025 to 2026 and a further 17% from 2026 to 2027, suggesting a possible meaningful earnings inflection after several years of limited post-COVID recovery.
- While large cap earnings growth forecasts are reasonable, small caps are expected to deliver stronger growth over the next two years, helped by lower funding costs, lower taxation, AI demand, nearshoring, and base effects.
- Global small caps currently trade at a notable discount to large caps. Should earnings growth strengthen, investors may question if that valuation discount remains justified.
The consensus earnings forecast for global small caps and large caps from 2022 to 2027 show that the contrast in earnings progression over recent years is stark. Small caps have seen only a limited post‑COVID earnings recovery, held back by higher funding costs given their bias toward floating rate debt, a greater reliance on what has been a slower economy, political uncertainty deferring purchasing decisions, and a longer inventory destocking cycle following the pandemic.
But that picture is now forecast to change quite dramatically for small caps, with earnings growth of 33% and 17% expected over the next two years. Supporting factors include lower funding costs, the “One Big Beautiful Bill,” which allows US companies larger tax deductions, AI demand and nearshoring lifting amongst others the Industrials and Materials sectors (both large parts of small cap indices), and simple base effects (i.e. year‑on‑year comparisons against a period of little growth). Earnings growth for large caps is also expected to be reasonable (20% and 14% over the same period), but we believe if small caps can once again deliver superior growth to large caps (as has been the case over the long-term historically)1, it is reasonable to expect a return of the small cap premium versus large caps.
Global small cap valuation premium/discount versus global large caps (forward P/E)
Source: Bloomberg, Janus Henderson Investors analysis, MSCI World Small Cap, MSCI World as at 22 June 2026. There is no guarantee that past trends will continue, or forecasts will be realised. Past performance does not predict future returns.
1 Refinitiv Datastream, Janus Henderson Investors analysis, MSCI World Small Cap and MSCI World Large Cap, indices rebased to 100, January 1997 to March 2026. Past performance does not predict future returns.
The MSCI World Small Cap Index captures small cap representation across Developed Markets countries. The index covers approximately 14% of the free float-adjusted market capitalization in each country.
The MSCI World Large Cap Index captures large cap representation across 23 Developed Markets (DM) countries*. With 543 constituents, the index covers approximately 70% of the free float-adjusted market capitalization in each country.
Earnings per share: EPS is the bottom-line measure of a company’s profitability, defined as net income (profit after tax) divided by the number of outstanding shares.
Floating-rate debt: A debt security where the interest payments are not fixed over the life of the instrument but vary in response to a reference rate, such as the overnight lending rate or the rate of inflation.
Forward price-to-earnings ratio: An estimate of the future earnings of a business in the next 12 months.
Large caps: Well-established companies with a valuation (market capitalisation) at the larger end of the market scale.
Market capitalisation: The total market value of a company’s issued shares. It is calculated by multiplying the number of shares in issue by the current price of the shares. The figure is used to determine a company’s size and is often abbreviated to ‘market cap’.
Nearshoring: The practice of moving production or supply chains closer to end markets. This can benefit companies exposed to domestic manufacturing, logistics, and infrastructure investment.
Small caps: Companies with a valuation (market capitalisation) at the smaller end of the market scale.
Valuation discount/premium: When a security or asset class is trading lower/higher than its fundamental or intrinsic value.
Queste sono le opinioni dell'autore al momento della pubblicazione e possono differire da quelle di altri individui/team di Janus Henderson Investors. I riferimenti a singoli titoli non costituiscono una raccomandazione all'acquisto, alla vendita o alla detenzione di un titolo, di una strategia d'investimento o di un settore di mercato e non devono essere considerati redditizi. Janus Henderson Investors, le sue affiliate o i suoi dipendenti possono avere un’esposizione nei titoli citati.
Le performance passate non sono indicative dei rendimenti futuri. Tutti i dati dei rendimenti includono sia il reddito che le plusvalenze o le eventuali perdite ma sono al lordo dei costi delle commissioni dovuti al momento dell'emissione.
Le informazioni contenute in questo articolo non devono essere intese come una guida all'investimento.
Non vi è alcuna garanzia che le tendenze passate continuino o che le previsioni si realizzino.
Comunicazione di Marketing.
Important information
Please read the following important information regarding funds related to this article.
- Le Azioni/Quote possono perdere valore rapidamente e di norma implicano rischi più elevati rispetto alle obbligazioni o agli strumenti del mercato monetario. Di conseguenza il valore del proprio investimento potrebbe diminuire.
- Le azioni di società a piccola e media capitalizzazione possono presentare una maggiore volatilità rispetto a quelle di società più ampie e talvolta può essere difficile valutare o vendere tali azioni al momento e al prezzo desiderati, il che aumenta il rischio di perdite.
- Il Fondo potrebbe usare derivati al fine di ridurre il rischio o gestire il portafoglio in modo più efficiente. Ciò, tuttavia, comporta rischi aggiuntivi, in particolare il rischio che la controparte del derivato non adempia ai suoi obblighi contrattuali.
- Qualora il Fondo detenga attività in valute diverse da quella di base del Fondo o l'investitore detenga azioni o quote in un'altra valuta (a meno che non siano "coperte"), il valore dell'investimento potrebbe subire le oscillazioni del tasso di cambio.
- I titoli del Fondo potrebbero diventare difficili da valutare o da vendere al prezzo e con le tempistiche desiderati, specie in condizioni di mercato estreme con il prezzo delle attività in calo, aumentando il rischio di perdite sull'investimento.
- Il Fondo potrebbe perdere denaro se una controparte con la quale il Fondo effettua scambi non fosse più intenzionata ad adempiere ai propri obblighi, o a causa di un errore o di un ritardo nei processi operativi o di una negligenza di un fornitore terzo.