
Key takeaways:
- After declining roughly -20% in the first quarter, the biotech sector appears to be on track for a remarkable rebound to end 2025.
- The rebound reflects relief from policy uncertainty in the first half of the year, as well as ongoing drug innovation and pent-up demand for mergers and acquisitions (M&A).
- In our view, the momentum could have further to go given looming patent expirations for big pharma, successful drug launches for biotechs, and improved funding for drug innovation. But in a more competitive market, the key to maximizing returns will be knowing where to look.
At the time of this writing, biotech appears to be on track to deliver one of its best years of annual returns since the sector’s heady days of the Covid pandemic. The S&P Biotechnology Select Industry Index, a benchmark of small-, mid- and large-cap biotech stocks, is up 25% for the year through October.1 Should the gains hold, it would be the first year of double-digit returns for the index since 2020 – a feat made all the more remarkable given that by early April, the benchmark was down by more than -20%.2
Several events help explain the turnaround, from improved clarity about tariffs and drug pricing policy in the U.S. to a rise in merger and acquisition (M&A) activity. But we continue to see an undercurrent of developments that could deliver more positive returns. To make the most of the potential opportunity, here’s what we think investors should consider.
The growing need for M&A
Historically, biotech stocks have benefited in periods when M&A activity accelerates, as deals – particularly large, multibillion-dollar acquisitions – unlock value, free up capital, and draw investor interest to the sector. Since 2021, rising interest rates and regulatory uncertainty have led to a downswing in total deal value. But there are signs these headwinds may be abating.
After rising to near 5% in 2023, 10-year Treasury yields now sit closer to 4% and could decline further if the Federal Reserve, which began easing monetary policy this year, continues to cut its benchmark rate.3 At the same time, the Food and Drug Administration (FDA) has overcome worries about recent funding and staff changes to meet review deadlines and even advance drug innovation through the rollout of an expedited approval pathway for important new medicines.
And in August, Pfizer reached a landmark deal with the White House, agreeing to an additional $70 billion in U.S. capital spending and selling select drugs to consumers at a discount. With the agreement seemingly satisfying administration priorities but avoiding the most draconian policy proposals (e.g., broad, most favored nation drug pricing), the biopharma industry has seen a pathway for preserving drug revenues. As such, M&A deal volume nearly doubled to $31 billion in the third quarter of 2025, up from just over $17 billion the prior quarter (Figure 1).
Figure 1: Policy relief and a patent cliff drive M&A
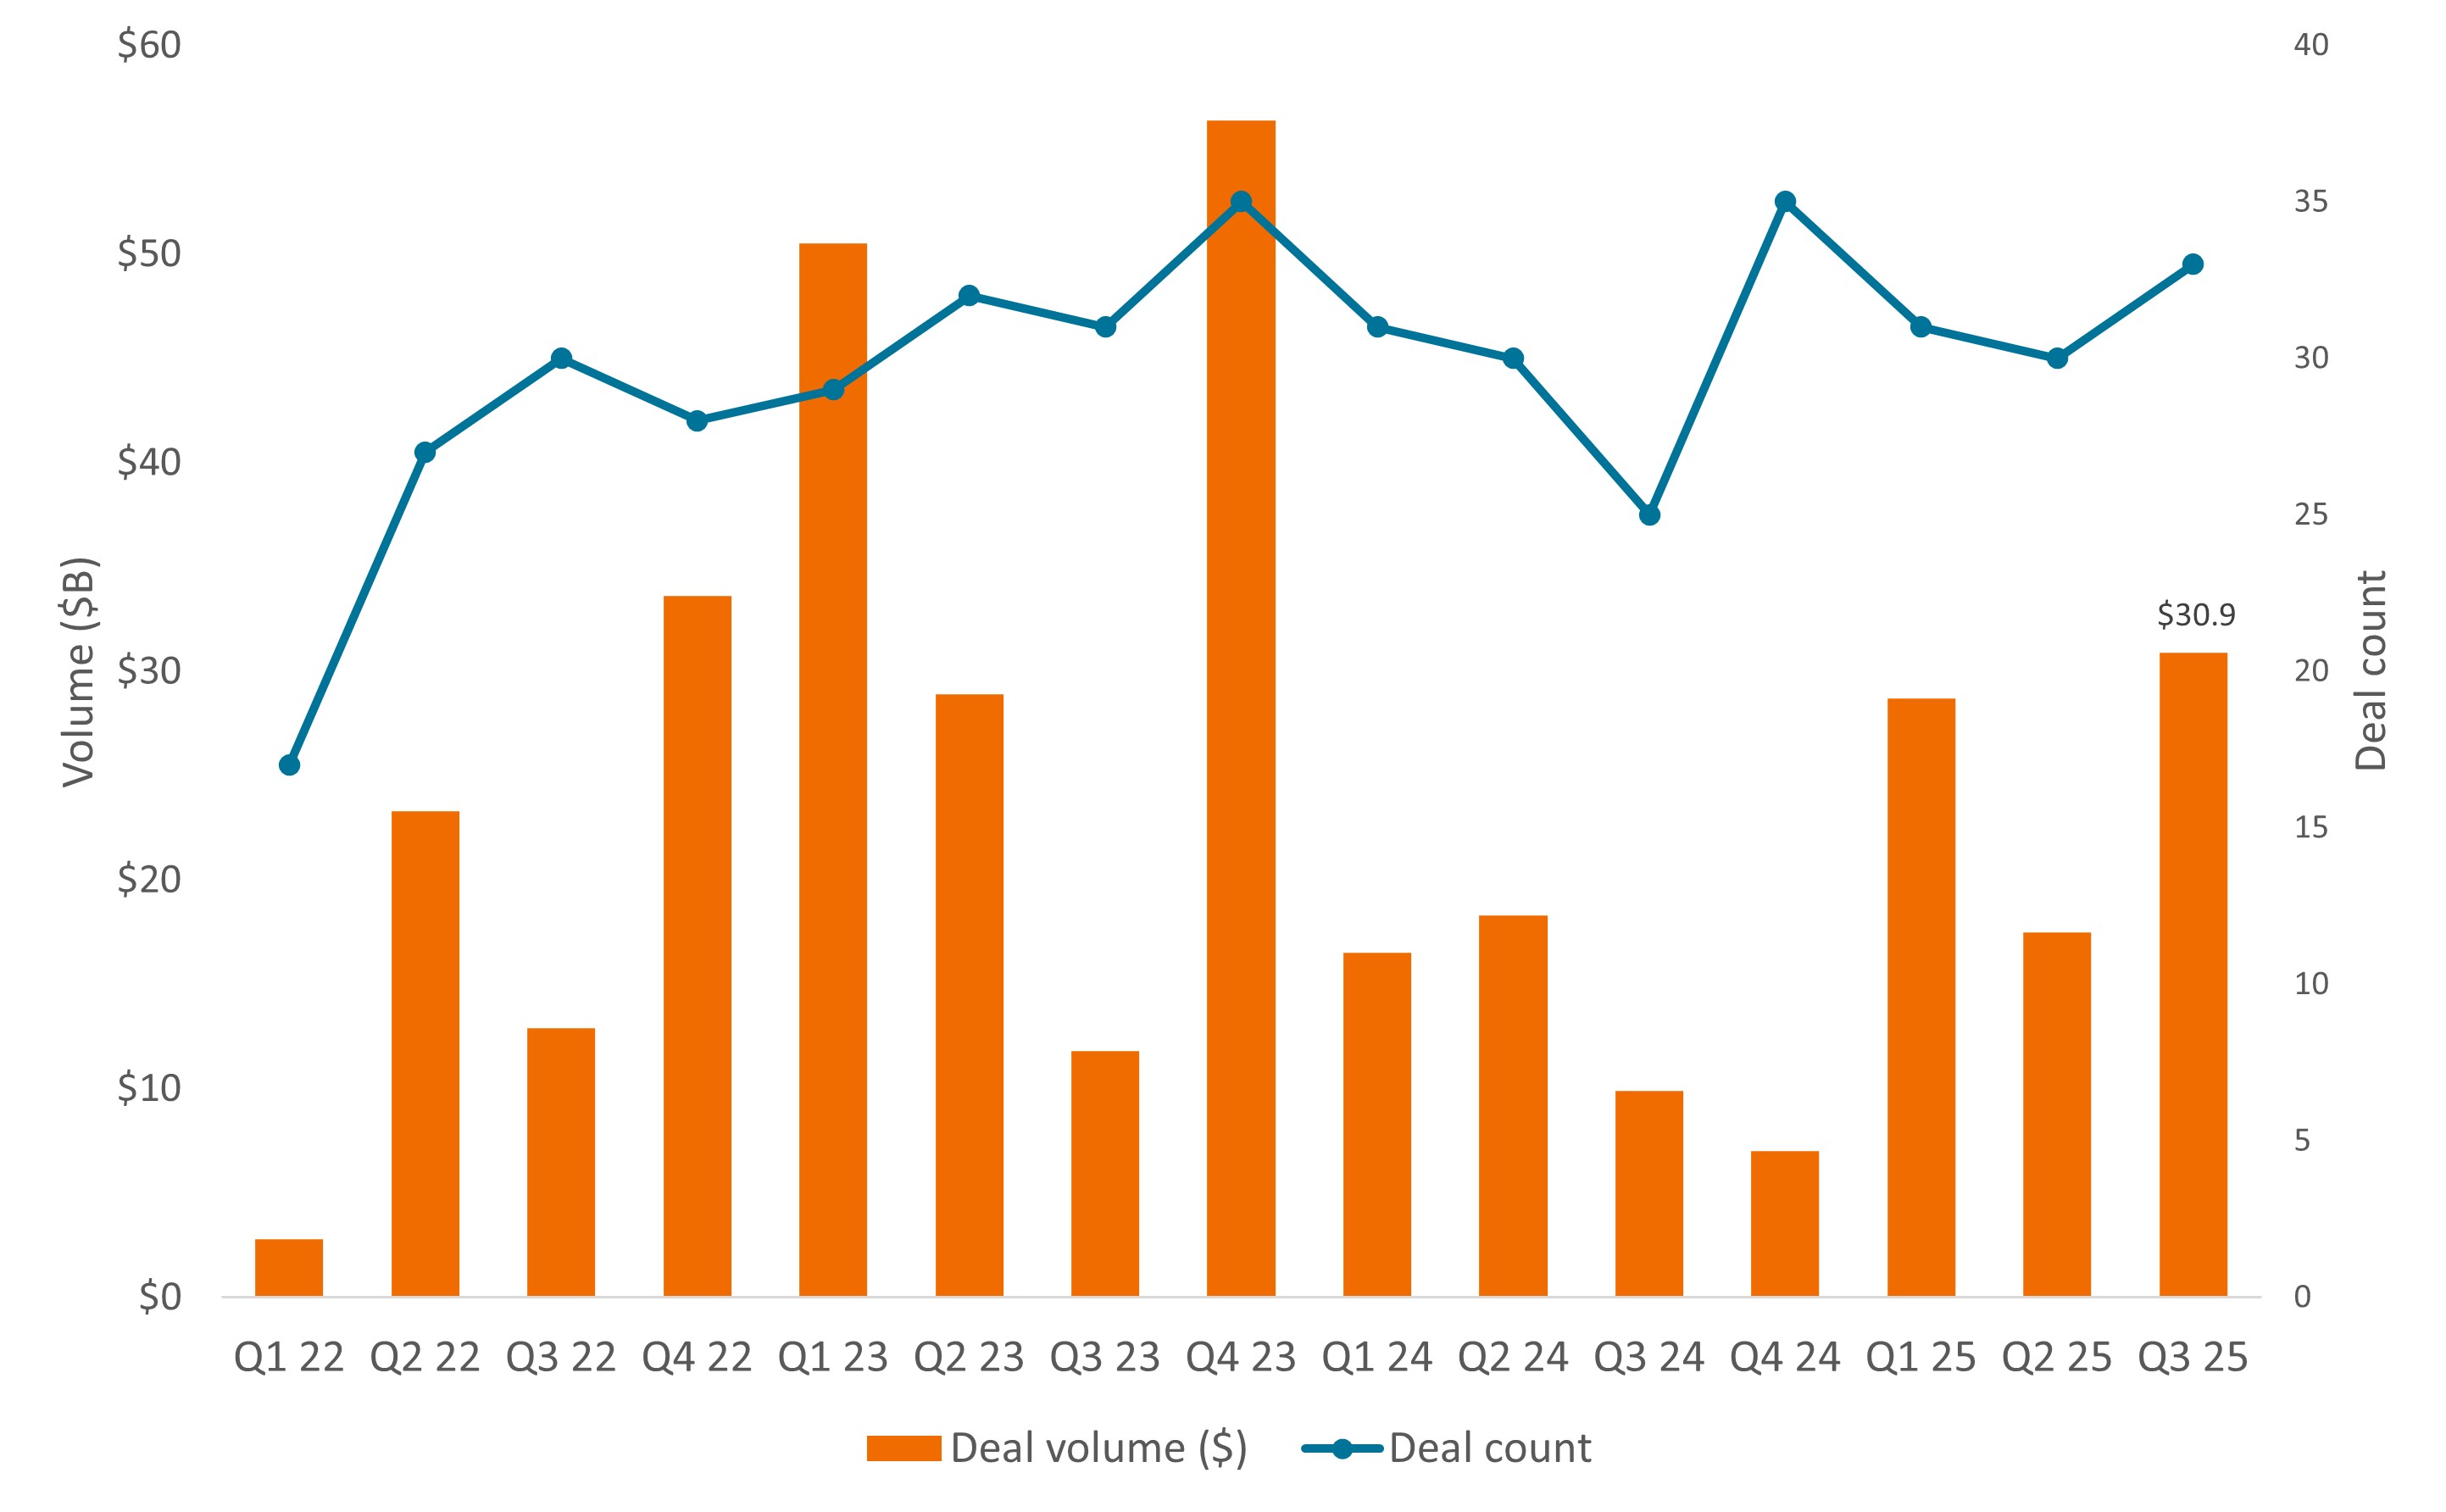
Source: J.P.Morgan, DealForma.com, as of 30 September 2025.
More M&A could follow. Roughly $300 billion in drug revenue is at risk of losing market exclusivity between now and 2030, one of the industry’s biggest “patent cliffs” in nearly two decades.4 With deadlines looming, drug companies are under increasing pressure to replenish pipelines quickly and have, by one estimate, as much as $1.2 trillion in balance sheet capacity to make acquisitions.5
An uptick in M&A can boost the biotech sector’s performance broadly, but investing in the individual companies being acquired often yields the biggest payoff. In 2025, M&A deals have typically been done at double-digit premiums to the preannouncement stock price, with a handful of purchases exceeding 100%.6
It is impossible to know in advance which companies will be acquired, but there are some commonalities to look for. Through the third quarter, mid- and small-cap biopharma firms accounted for 57% of the deal count in 2025, as these companies now drive the bulk of drug innovation. Firms developing drugs for large and growing market opportunities such as obesity, oncology, and fatty liver disease have been favored targets. And most M&A has been announced after clinical trials deliver positive data or a recently approved drug shows signs of a successful commercial launch.7
Capital markets that favor proven drug innovation
Even so, the outlook for biotech does not depend on M&A alone. Drug development is another key component, and here again we think trends are positive. Amid elevated interest rates, biotech initial public offerings slowed to a trickle. But funding from other public and private sources (such as follow-on equity offerings and venture capital) has lately started to climb, reaching $102 billion in 2024, up from $71 billion the year before.8
Capital investments are the lifeblood of drug development, and a groundswell of breakthrough therapies is helping attract investor interest. This includes the first new mechanism of action to be approved in decades for schizophrenia, the first-ever treatments for MASH (fatty liver disease) and Prader-Willi syndrome (a rare genetic disease that impairs children’s development), novel drugs for cardiomyopathy caused by TTR amyloidosis, and the first approved treatment for the lung disease bronchiectasis.
By transforming the standard of care, such therapies are seeing strong uptake at commercial launch and offering the potential for attractive earnings growth. According to one industry analysis, only about 20% of companies in the S&P Biotech Index were profitable between the years 2017 and 2024. By 2027, that figure could nearly double to 38% on the strength of ongoing drug research and development.9 In a sector known for volatility – in part because of the scarcity of earnings – this trend could be a catalyst for attracting a wider investor audience.
Market discipline could also play in biotech’s favor. Investors may be starting to warm to the sector, but they continue to favor “de-risked assets” – biotechs whose pipelines offer a strong pathway to development and/or near-term catalysts (such as regulatory approval). In a risk-off market, rewards are more likely to be dominated by companies with innovative pipelines that have shown clear evidence of clinical success.
The market’s recent volatility underscores the point. At the end of 2024, biopharma companies with a phase 3 drug had an average enterprise value of $701 million. That value was cut almost in half ($379 million) by April 2025, at the height of policy uncertainty, but then rebounded to $730 million by mid-September. For preclinical companies, the story was much different (Figure 2).
Figure 2: Capital markets continue to favor late-stage biotech companies
Average enterprise value* of public U.S. biotech companies by stage of drug development
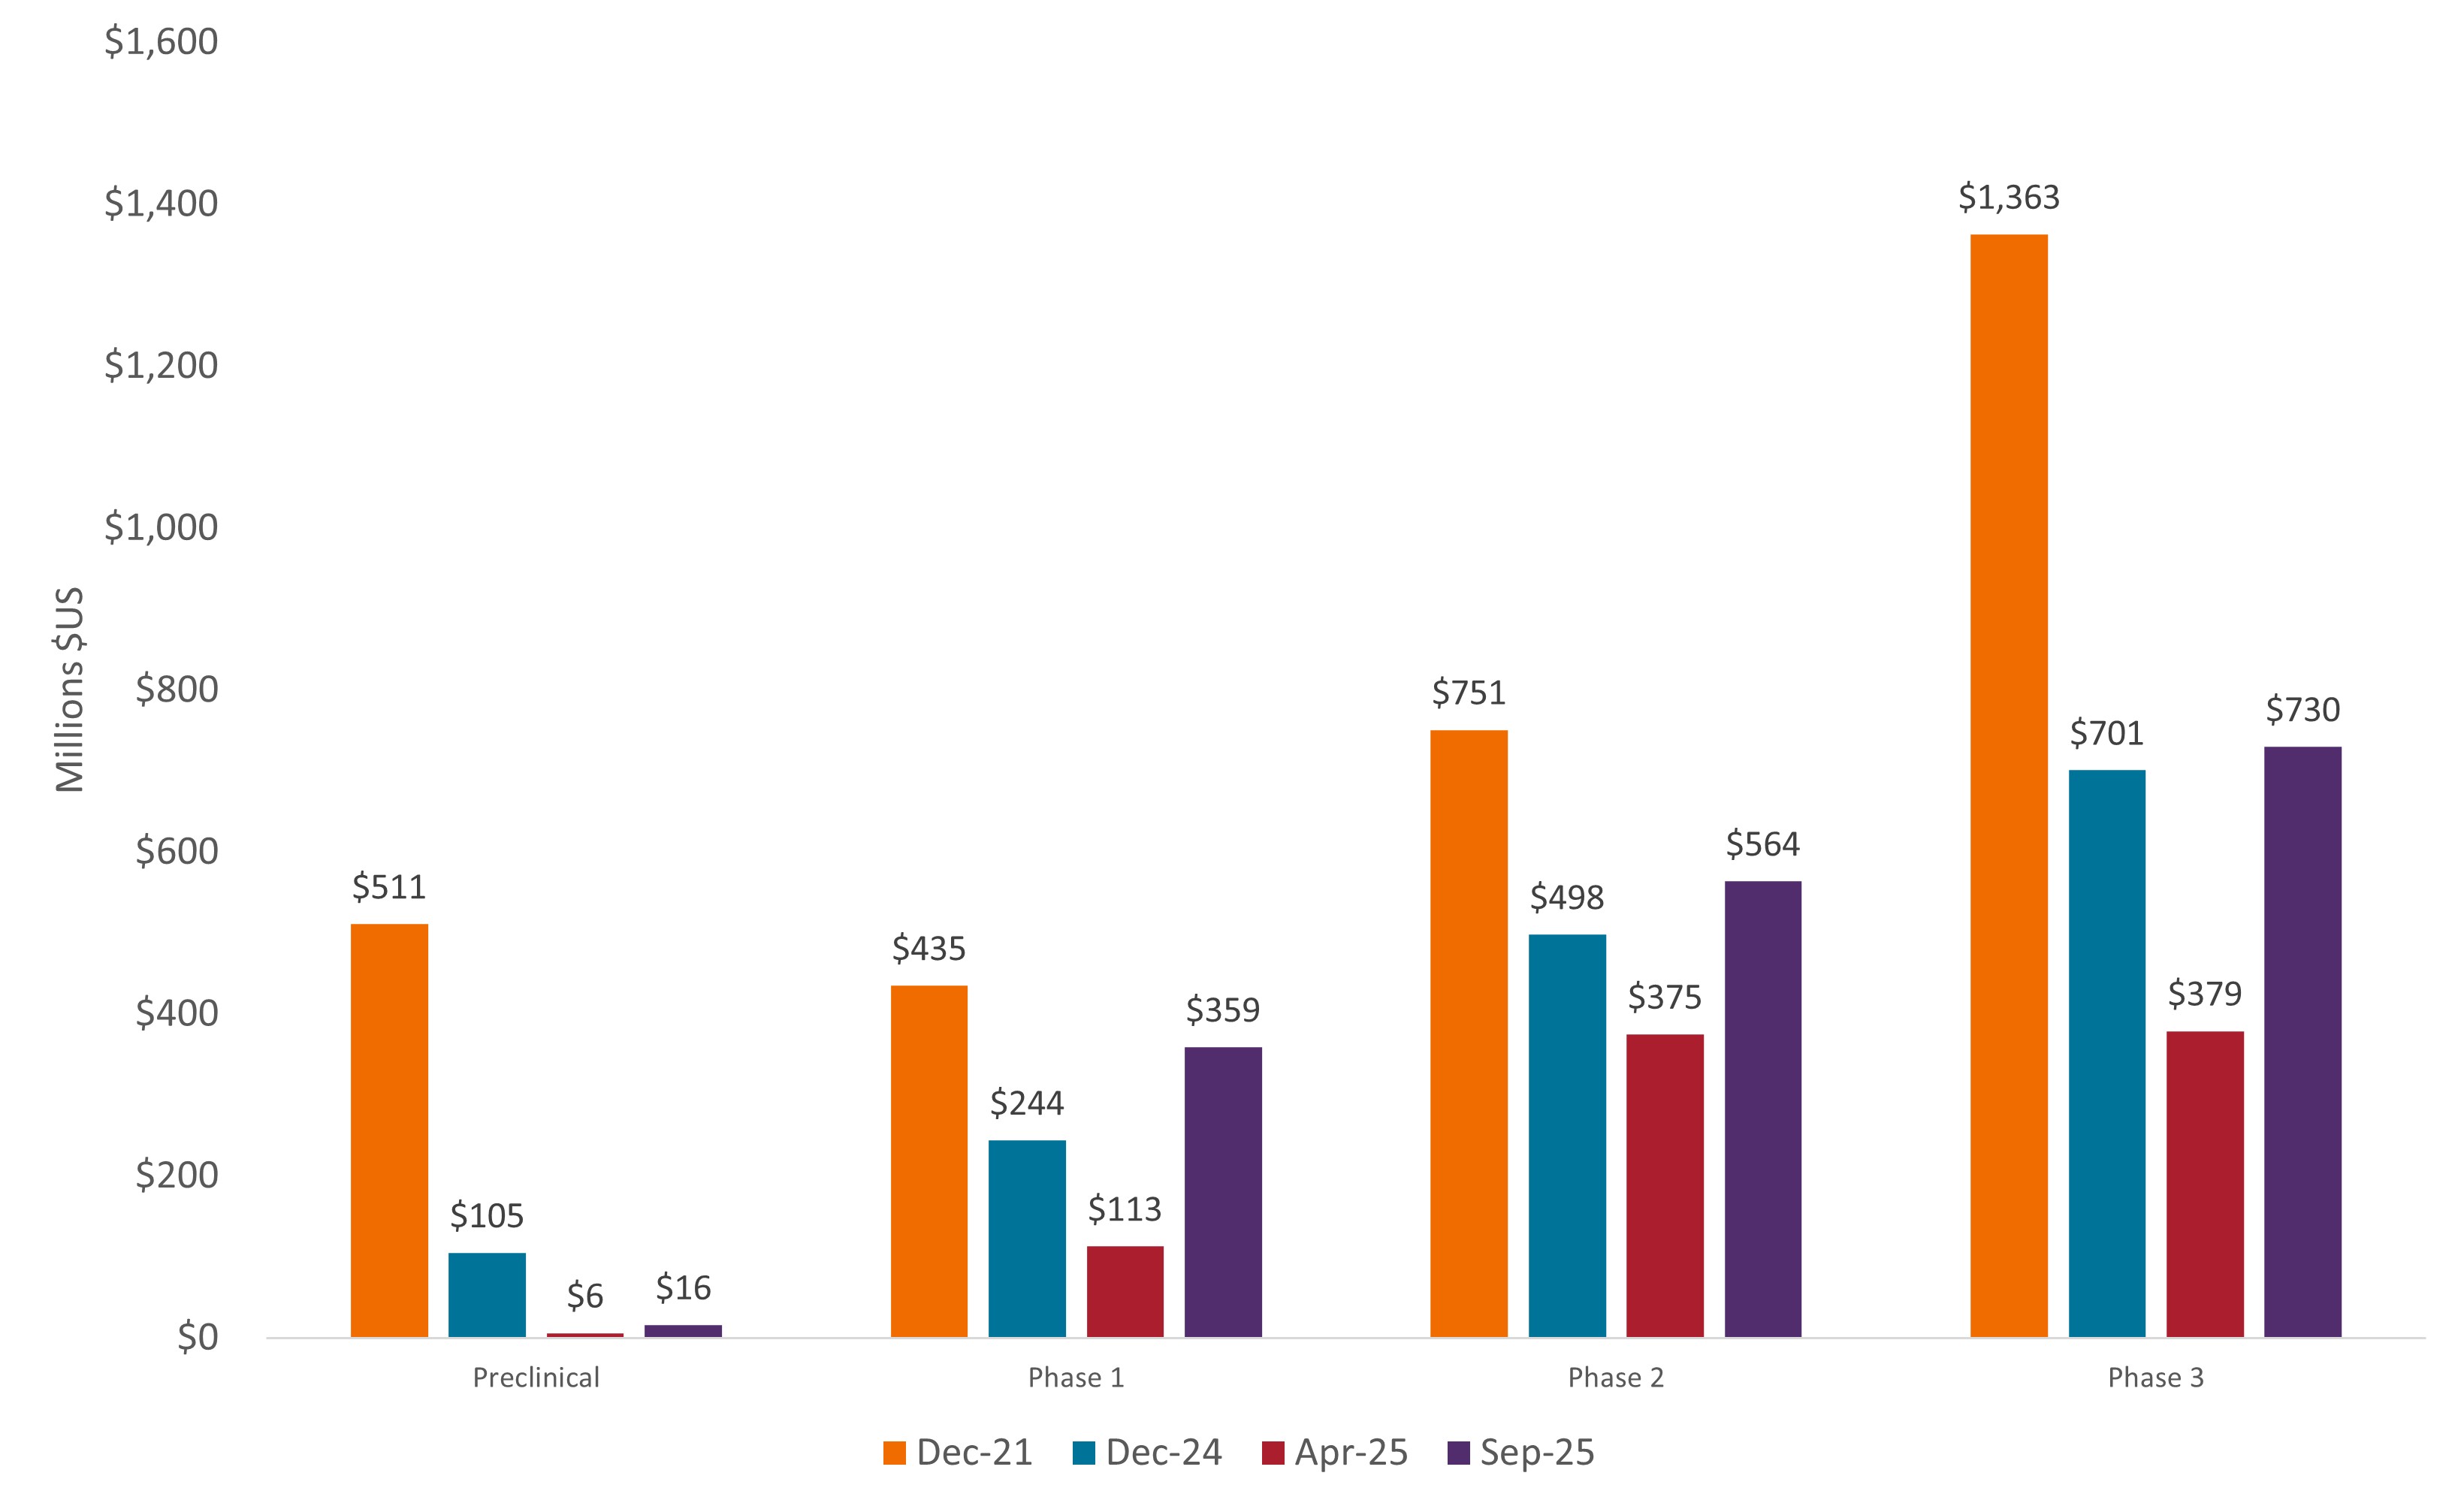
Source: CapitalIQ, Stifel. As of 31 December 2021, 31 December 2024, 11 April 2025, and 12 September 2025. *Enterprise value is a company’s market capitalization plus total debt, preferred shares, and minority interest, minus cash and cash equivalents. It represents the theoretical takeover price of a company, accounting for both equity and debt.
Long term, this discipline could have broader benefits. Biotech is now a leaner and more competitive sector than it was coming out of its 2021 market peak. Today, the number of public biotech firms that can boast “very good” datasets – pipeline drugs with a high probability of meaningfully improving the standard of care for a disease – is estimated to be more than 80%. In 2022, the figure was only 47%. Furthermore, since then, the number of publicly traded biotechs has declined by over 20%.10
In other words, the sector is setting a higher bar for companies to get going, but of those that survive, the opportunity for value creation may be better than ever.
10-Year Treasury Yield is the interest rate on U.S. Treasury bonds that will mature 10 years from the date of purchase.
Volatility measures risk using the dispersion of returns for a given investment.
1 Bloomberg, from 31 December 2024 to 31 October 2025.
2 Bloomberg, from 31 December to 9 April 2025.
3 Federal Reserve Bank of St. Louis, as of 31 October 2025.
4 Evaluate, Portfolio tactics to scale the $300bn patent cliff, as of 13 October 2025.
5 Stifel, as of 16 September 2025. Based on 18 large-cap biopharma companies and assumes a ratio of net debt / earnings before interest, taxes, depreciation, and amortization (EBITDA) of five times.
6 BiopharmaDive, as of 26 October 2025.
7 JPMorgan, as of 30 September 2025.
8 IQVIA Institute, Global Trends in R&D 2025, as of March 2025.
9 Cantor, The XBI may FINALLY be poised to Deliver—Here’s why, as of 27 August 2025.
10 Stifel, as of 11 September 2025.
Health care industries are subject to government regulation and reimbursement rates, as well as government approval of products and services, which could have a significant effect on price and availability, and can be significantly affected by rapid obsolescence and patent expirations.
Queste sono le opinioni dell'autore al momento della pubblicazione e possono differire da quelle di altri individui/team di Janus Henderson Investors. I riferimenti a singoli titoli non costituiscono una raccomandazione all'acquisto, alla vendita o alla detenzione di un titolo, di una strategia d'investimento o di un settore di mercato e non devono essere considerati redditizi. Janus Henderson Investors, le sue affiliate o i suoi dipendenti possono avere un’esposizione nei titoli citati.
Le performance passate non sono indicative dei rendimenti futuri. Tutti i dati dei rendimenti includono sia il reddito che le plusvalenze o le eventuali perdite ma sono al lordo dei costi delle commissioni dovuti al momento dell'emissione.
Le informazioni contenute in questo articolo non devono essere intese come una guida all'investimento.
Non vi è alcuna garanzia che le tendenze passate continuino o che le previsioni si realizzino.
Comunicazione di Marketing.
Important information
Please read the following important information regarding funds related to this article.
- Le Azioni/Quote possono perdere valore rapidamente e di norma implicano rischi più elevati rispetto alle obbligazioni o agli strumenti del mercato monetario. Di conseguenza il valore del proprio investimento potrebbe diminuire.
- Le azioni di società a piccola e media capitalizzazione possono presentare una maggiore volatilità rispetto a quelle di società più ampie e talvolta può essere difficile valutare o vendere tali azioni al momento e al prezzo desiderati, il che aumenta il rischio di perdite.
- Un Fondo che presenta un’esposizione elevata a un determinato paese o regione geografica comporta un livello maggiore di rischio rispetto a un Fondo più diversificato.
- Il Fondo si concentra su determinati settori o temi d’investimento e potrebbe risentire pesantemente di fattori quali eventuali variazioni ai regolamenti governativi, una maggiore competizione nei prezzi, progressi tecnologici ed altri eventi negativi.
- Il Fondo potrebbe usare derivati al fine di conseguire il suo obiettivo d'investimento. Ciò potrebbe determinare una "leva", che potrebbe amplificare i risultati dell'investimento, e le perdite o i guadagni per il Fondo potrebbero superare il costo del derivato. I derivati comportano rischi aggiuntivi, in particolare il rischio che la controparte del derivato non adempia ai suoi obblighi contrattuali.
- Qualora il Fondo detenga attività in valute diverse da quella di base del Fondo o l'investitore detenga azioni o quote in un'altra valuta (a meno che non siano "coperte"), il valore dell'investimento potrebbe subire le oscillazioni del tasso di cambio.
- Se il Fondo, o una sua classe di azioni con copertura, intende attenuare le fluttuazioni del tasso di cambio tra una valuta e la valuta di base, la stessa strategia di copertura potrebbe generare un effetto positivo o negativo sul valore del Fondo, a causa delle differenze di tasso d’interesse a breve termine tra le due valute.
- I titoli del Fondo potrebbero diventare difficili da valutare o da vendere al prezzo e con le tempistiche desiderati, specie in condizioni di mercato estreme con il prezzo delle attività in calo, aumentando il rischio di perdite sull'investimento.
- Il Fondo potrebbe perdere denaro se una controparte con la quale il Fondo effettua scambi non fosse più intenzionata ad adempiere ai propri obblighi, o a causa di un errore o di un ritardo nei processi operativi o di una negligenza di un fornitore terzo.
Specific risks
- Le Azioni/Quote possono perdere valore rapidamente e di norma implicano rischi più elevati rispetto alle obbligazioni o agli strumenti del mercato monetario. Di conseguenza il valore del proprio investimento potrebbe diminuire.
- Le azioni di società a piccola e media capitalizzazione possono presentare una maggiore volatilità rispetto a quelle di società più ampie e talvolta può essere difficile valutare o vendere tali azioni al momento e al prezzo desiderati, il che aumenta il rischio di perdite.
- Un Fondo che presenta un’esposizione elevata a un determinato paese o regione geografica comporta un livello maggiore di rischio rispetto a un Fondo più diversificato.
- Il Fondo si concentra su determinati settori o temi d’investimento e potrebbe risentire pesantemente di fattori quali eventuali variazioni ai regolamenti governativi, una maggiore competizione nei prezzi, progressi tecnologici ed altri eventi negativi.
- Il Fondo potrebbe usare derivati al fine di conseguire il suo obiettivo d'investimento. Ciò potrebbe determinare una "leva", che potrebbe amplificare i risultati dell'investimento, e le perdite o i guadagni per il Fondo potrebbero superare il costo del derivato. I derivati comportano rischi aggiuntivi, in particolare il rischio che la controparte del derivato non adempia ai suoi obblighi contrattuali.
- Qualora il Fondo detenga attività in valute diverse da quella di base del Fondo o l'investitore detenga azioni o quote in un'altra valuta (a meno che non siano "coperte"), il valore dell'investimento potrebbe subire le oscillazioni del tasso di cambio.
- Se il Fondo, o una sua classe di azioni con copertura, intende attenuare le fluttuazioni del tasso di cambio tra una valuta e la valuta di base, la stessa strategia di copertura potrebbe generare un effetto positivo o negativo sul valore del Fondo, a causa delle differenze di tasso d’interesse a breve termine tra le due valute.
- I titoli del Fondo potrebbero diventare difficili da valutare o da vendere al prezzo e con le tempistiche desiderati, specie in condizioni di mercato estreme con il prezzo delle attività in calo, aumentando il rischio di perdite sull'investimento.
- Il Fondo può sostenere un livello di costi di operazione più elevato per effetto dell’investimento su mercati caratterizzati da una minore attività di contrattazione o meno sviluppati rispetto a un fondo che investa su mercati più attivi/sviluppati.
- Il Fondo potrebbe perdere denaro se una controparte con la quale il Fondo effettua scambi non fosse più intenzionata ad adempiere ai propri obblighi, o a causa di un errore o di un ritardo nei processi operativi o di una negligenza di un fornitore terzo.