Key takeaways:
- IG credit spreads have tightened due to strong supply-demand dynamics, better-than-expected economic data, and tariff relief.
- A slowing supply of IG credit in H2 and corporate fundamentals, supported by AI-driven capital expenditures (capex), are key to watch as potential supportive factors for spreads going forward.
- Dispersion in individual credits could rise from here as the impact of tariffs is priced in, so careful security selection alongside a shift to higher quality could aid portfolio resilience amid uncertainty.
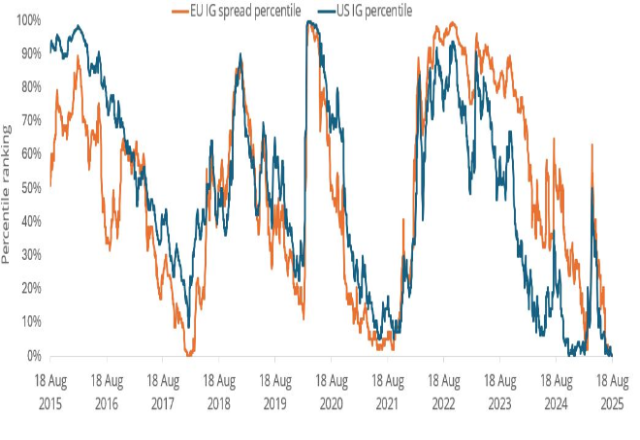
Source: Janus Henderson Investors, Bloomberg, EU IG: ICE BofA Euro Corporate Index; US IG: ICE BofA US Corporate Index, as at 18 August 2025. Past performance does not predict future returns.
Behind the tightening of IG credit spreads, strong technicals (supply/demand dynamics), better-than-expected economic data, and tariff relief have been drivers. There has been a record quarter of inflows into European IG credit[1], driven by attractive yields. The initial yield is crucial as it largely determines the total returns in fixed income.
The supply of European IG credit is expected to slow in the second half of the year, which means technicals should continue to remain supportive for spreads. This is similar in the US, where the net supply is anticipated to be negative for 2025[2]. Another tailwind for the asset class is corporate fundamentals accelerating in 2026, driven by higher deficit spending increase from the ‘One Big Beautiful Bill’ (OBBB)[3] and a beneficial tax environment, supported by easing monetary policy in the US, while Europe gains from German-led fiscal stimulus.
Corporate fundamentals are under scrutiny, especially as companies increase spending driven by Artificial Intelligence (AI).
“While previous tech capex cycles have culminated in boom and bust, AI-driven capex cycles are unprecedented and could lead to productivity gains and a multiplier effect to the broader economy.”
– Brad Smith, Fixed Income Portfolio Manager.
Despite tariffs being enacted, landing at 15% for Europe, markets have remained resilient, and the worst-case scenario has been priced out by trade deals and investor optimism. But we expect tariffs and tight spreads to undoubtedly lead to intra-sector dispersion in corporate credit as investors begin to price in the impact across supply chains and sector dynamics. Our investment focus is shifting to higher quality while taking advantage of single name opportunities and maximising carry, a key determinant of total returns in fixed income.
Footnotes
[1] Source: Morgan Stanley based on EFPR data, between May and July 2025.
[2] Source: JP Morgan, as at July 2025. There is no guarantee that past trends will continue, or forecasts will be realised.
[3] The OBBB, or One Big Beautiful Bill, is a U.S. federal statute enacted by the 119th Congress, primarily focused on tax and spending policies as part of President Donald Trump’s second-term agenda
ICE BofA Euro Corporate Index: The ICE BofA Euro Corporate Index is an index that tracks the performance of investment-grade corporate bonds denominated in Euros.
ICE BofA US Corporate Index: The ICE BofA US Corporate Index value, which tracks the performance of US dollar denominated investment grade rated corporate debt publicly issued in the US domestic market.
Fixed income securities are subject to interest rate, inflation, credit and default risk. The bond market is volatile. As interest rates rise, bond prices usually fall, and vice versa. The return of principal is not guaranteed, and prices may decline if an issuer fails to make timely payments or its credit strength weakens.
Credit spread: The difference in yield between securities with similar maturity but different credit quality, often used to describe the difference in yield between corporate bonds and government bonds. Widening spreads generally indicate a deteriorating creditworthiness of corporate borrowers, while narrowing indicates improving.
Corporate bond: A bond issued by a company. Bonds offer a return to investors in the form of periodic payments and the eventual return of the original money invested at issue on the maturity date.
Interest rates: The amount charged for borrowing money, shown as a percentage of the amount owed. Base interest rates (the Bank Rate) are generally set by central banks, such as the Federal Reserve in the US or Bank of England in the UK, and influence the interest rates that lenders charge to access their own lending or saving.
Yield: The level of income on a security over a set period, typically expressed as a percentage rate. For equities, a common measure is the dividend yield, which divides recent dividend payments for each share by the share price. For a bond, this is calculated as the coupon payment divided by the current bond price.
Investment grade: A bond typically issued by governments or companies perceived to have a relatively low risk of defaulting on their payments, which is reflected in the higher rating given by credit ratings agencies.
Spread compression: Spread compression refers to the narrowing of the yield spread between different types of financial securities. The yield spread is the difference in the yield between two securities, typically between a risk-free or benchmark security (like US Treasury bonds) and another security that carries a higher risk (like corporate bonds or specific asset-backed securities).
Technicals: In the context of financial markets, “technicals” refers to the analysis of price movements and trading volumes of financial instruments, such as stocks, bonds, or commodities, to forecast future price behaviour.
Corporate fundamentals: These refer to the essential and quantifiable factors that indicate the overall financial health and operational efficiency of a corporation. These fundamentals are critical for creditors and investors as they assess the creditworthiness and investment potential of a company.
Dispersion: This refers to the variations or differences in returns among various securities within a specific asset class or across different asset classes. Intra sector dispersion refers to this phenomenon between sectors within one asset class.
Capital expenditure: Money invested to acquire or upgrade assets such as buildings, machinery, equipment, or vehicles in order to maintain or improve operations and foster future growth.
Net supply: In the context of fixed income, “net supply” refers to the total amount of new bond issues coming to the market, minus the volume of maturing debt that is being repaid and coupon payments, within a specific time period, typically within a year.
Deficit spending: Deficit spending occurs when a government’s expenditures exceed its revenues during a specific period, typically a fiscal year. This situation requires the government to borrow money to cover the shortfall, leading to an increase in public debt.
Monetary policy: The policies of a central bank aimed at influencing the level of inflation and growth in an economy. Monetary policy tools include setting interest rates and controlling the supply of money. Monetary stimulus refers to a central bank increasing the supply of money and lowering borrowing costs. Monetary tightening refers to central bank activity aimed at curbing inflation and slowing down growth in the economy by raising interest rates and reducing the supply of money.
Fiscal stimulus: Fiscal measures are those related to government policy regarding setting tax rates and spending levels. Fiscal austerity refers to raising taxes and/or cutting spending in an attempt to reduce government debt. Fiscal expansion (or ‘stimulus’) refers to an increase in government spending and/or a reduction in taxes.
Multiplier effect: The multiplier effect refers to the economic concept where an initial injection of spending leads to increased income and consumption, thereby generating more economic activity than the original amount spent.
Carry: Return earned from a security assuming its price remains unchanged. For a bond, carry is essentially the income generated by the bond less the cost of financing.
These are the views of the author at the time of publication and may differ from the views of other individuals/teams at Janus Henderson Investors. References made to individual securities do not constitute a recommendation to buy, sell or hold any security, investment strategy or market sector, and should not be assumed to be profitable. Janus Henderson Investors, its affiliated advisor, or its employees, may have a position in the securities mentioned.
Past performance does not predict future returns. The value of an investment and the income from it can fall as well as rise and you may not get back the amount originally invested.
The information in this article does not qualify as an investment recommendation.
There is no guarantee that past trends will continue, or forecasts will be realised.
Marketing Communication.