
Key takeaways:
- The impact of deglobalization and rising inflation has changed the backdrop for the incoming Fed Chair. We see five key aspects that could shape policy going forward – and could become key considerations for investors.
- There is an argument that the Fed should be hiking rather than cutting rates with the “productivity miracle” of AI far from certain. This is coupled with a labor market that is far healthier than many recognize.
- Against this backdrop, the incoming Chair may choose to move the antiquated 2% target inflation rate higher, and investors may find strong opportunities in shorter-duration, pro-inflation assets.
There will eventually be a new Chair of the Federal Reserve, and that person’s confirmation hearings have generally focused on the politics of the appointment rather than on the state of the economy – and in this case a potentially new paradigm for US inflation.
The US experienced an extended period of disinflation that we feel was largely fueled by globalization and the resulting downward pressure on prices from increasing global trade fostering competition. However, deglobalization seems to be well underway and is reversing some of the benefits of globalization. Inflation, as one example, has already been creeping upward as competition has been subsiding and supply chain disruptions become more frequent.
Here are five aspects to the deglobalization/inflation backdrop that a new Fed Chair should be familiar with, but may not be:
1. Parallels to the 1960s “Guns & Butter”
Economists have largely focused on the shorter-term impacts of oil shocks related to the Iran War and have drawn parallels to the 1970s oil shocks. Gasoline prices have so far not risen enough to cause demand destruction.
Chart 1 shows gasoline prices as a percent of wages, and today’s gasoline prices remain very low based on this relative measure, especially when compared to the late-1970s’ readings. Higher gasoline prices might annoy consumers (i.e., the recent contraction in many consumer sentiment measures), but this chart suggests gasoline prices aren’t yet high enough to change their behavior.
This analysis does not preclude the possibility that economic growth could still slow. However, it does argue that if an energy-induced economic slowdown or recession occurred, then it would more likely be the result of energy supply shortages hindering activity rather than because of higher energy prices constraining consumption. For example, there are reports that supply shortages are already reducing activity in some transportation sectors and in countries with insufficient emergency energy reserves.
Chart 1: Price of a gallon of gasoline as a % of US wages
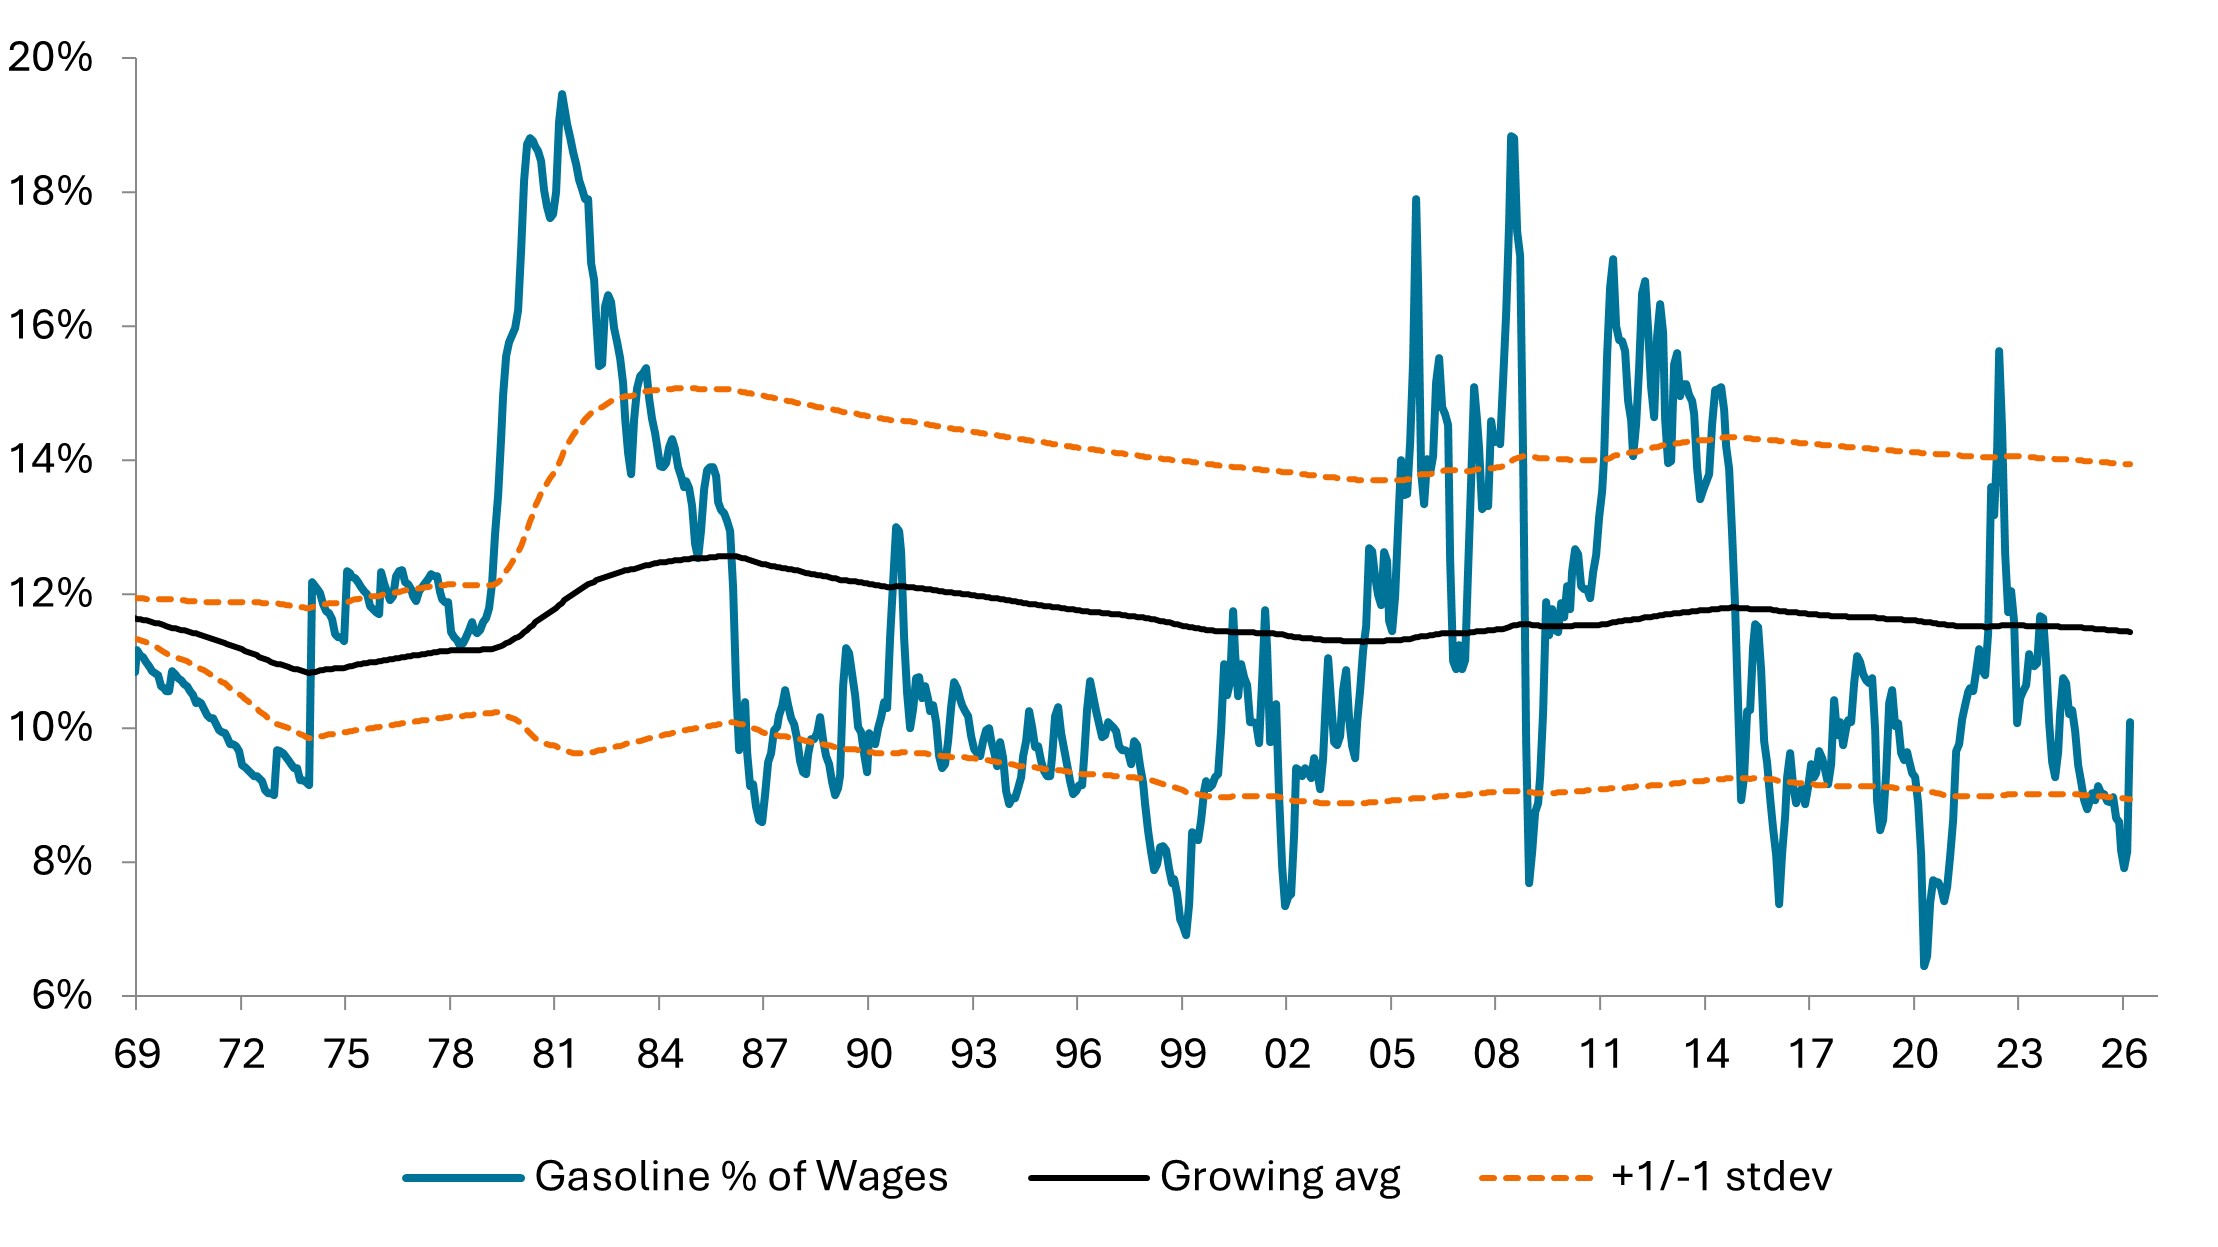
Source: RBA/JHI, US EIA, BLS, as at April 2026. Nominal data, U.S. All Grades All Formulations Retail Gasoline Prices (Dollars per Gallon), US Avg Hourly Earnings Production and Nonsupervisory Nonfarm Payrolls Total NSA. stdev= standard deviation.
We think today more resembles the 1960s so-called Guns & Butter period. Guns & Butter referred to fiscal policies during the 1960s that increased defense spending for the buildup to the Vietnam War (guns) while simultaneously expanding the Great Society social spending programs (butter). The Federal Reserve was also accommodative despite the increase in fiscal spending.
The consensus at the time was that this combination would have little impact on the budget deficit or on inflation. In retrospect, that was clearly a misguided assumption.
The Guns & Butter analogy seems appropriate when describing today’s fiscal situation as well, as we explored in our recent Reviving “Guns and Butter”? article. The buildup in defense spending has been large and rapid in response to the Iran War. In fact, the initial 2027 budget contains US$1.5 trillion in defense spending, up 42% from 2026 and the nation’s first trillion-dollar defense allocation.
Some of the 1960s social programs are being cut back today, but the recent One Big Beautiful Bill (OBBB) is, based on analyses from the Congressional Budget Office and the Tax Foundation, the sixth largest tax cut in US history. Tax cuts have replaced social spending, but the effect will likely still be to increase the budget deficit.
Also, like the 1960s, the new Fed Chair might impart more accommodative monetary policies despite this apparent second coming of Guns & Butter.
Chart 2 shows the secular trend in the Core Consumer Prices Index (CPI). The inflation trend of the last five years does appear to be mimicking that of the Guns & Butter period.
Chart 2: Core CPI secular trend
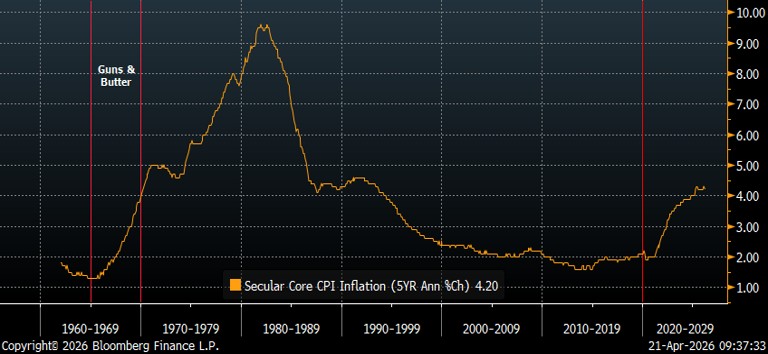
Source: RBA/JHI, Bloomberg Finance LLP, as at April 2026.
2. The Taylor Rule says HIKE rates
The Taylor Rule, based on 1990s research by Professor John Taylor of Stanford University, has long been a guiding light for conservative monetary economists. Taylor is well known for focusing on the need for rules-based monetary policy dependent on real output and inflation relative to the Fed Funds rate.
One could argue the merits or problems associated with rules-based monetary policies, but the clear goal of the Taylor Rule has been to remove politics and emotion from monetary policy, and to make policy moves more transparent and predictable.
The Fed’s independence has become a meaningful political issue and, with that in mind, it seemed worthwhile to us to revisit the Taylor Rule.
There are many derivations of the Taylor Rule, so the Atlanta Fed publishes 30 different versions to appease a broad range of economists’ model assumptions. Table 1 shows a grid highlighting the outputs of those different models, with green suggesting the Fed Funds rate should be increased, red suggesting the rate should be decreased, and white suggesting the rate is currently within an acceptable range.
Currently, all 30 versions of the Taylor Rule suggest the Fed should be hiking rates. If it were not for politics, it seems unlikely that conservative monetary economists would be arguing for a rate cut.
Table 1: The Taylor Rule
Taylor rule fed funds prescription heatmap for 2026: Q1
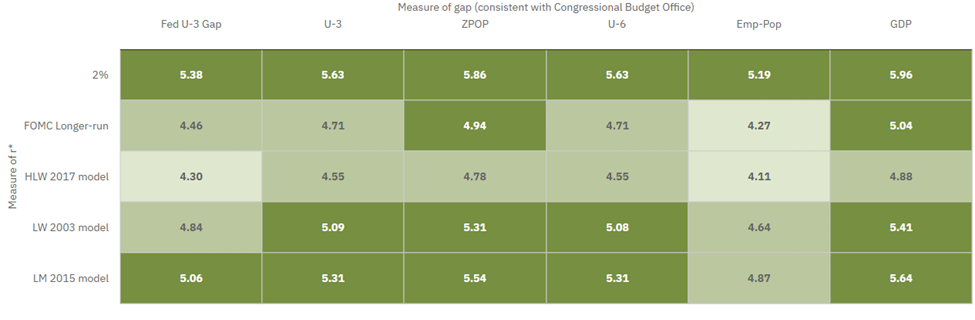
Source: Federal Reserve Bank of Atlanta. Inflation target 2.0 percent. Inflation measure: Core PCE inflation, 4-quarter. Fed funds rate: Predicted effective fed funds rate, rate assuming no change in target range. Weight on gap: 0.5. Interest rate smoothing: 0. Source: Atlanta Fed.
3. The US is importing inflation
One of the clearest signs that globalization was exposing the US economy to disinflationary or even deflationary pressures was that Core Import Prices (CIP) (i.e., prices when excluding food and energy) were rising more slowly than the Core CPI. In other words, the prices of imported goods were undercutting existing prices.
Globalization led some economists to opine that the US was “importing deflation,” but it now appears that the US has begun to import inflation. Chart 3 shows the year-to-year percent change in CIP. Import prices are now rising at 3.5%/year, which is the highest in the history of the data when excluding the pandemic-related period.
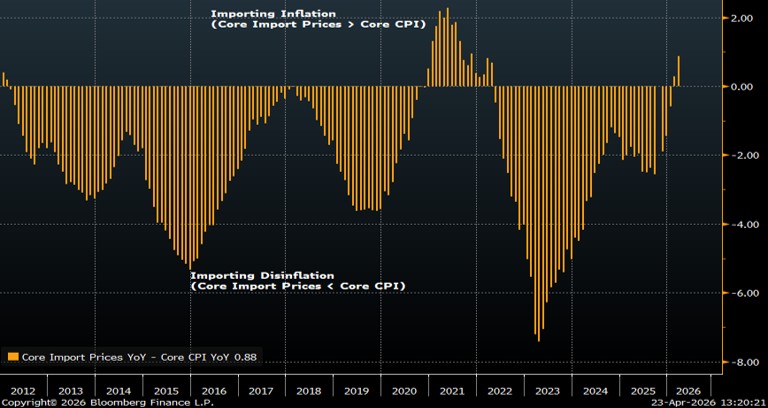
Chart 4 demonstrates that CIP inflation is not only high, but it is now higher than the Core CPI supporting the contention that the US is now importing inflation.
Chart 3: Core Import Price YoY % Change
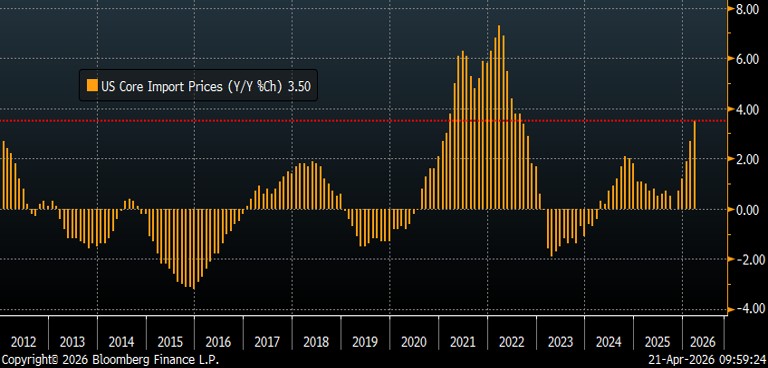
Source: RBA/JHI, Bloomberg Finance LLP, as at April 2026.
Chart 4: Inflation: Core Import Prices Relative to Core CPI
Source: RBA/JHI, Bloomberg Finance LLP, as at April 2026.
4. Productivity improvement from AI might be a leap of faith
Some economists and investors suggest inflation concerns like ours are unfounded because artificial intelligence (AI) will produce massive improvements in productivity that will negate deglobalization’s inflationary pressures. That could be true but, believe it or not, there is scant historical evidence that technological innovation structurally improves US productivity.
AI seems to undoubtedly be an economy-changing technology, but AI will not be the first technology to change the economy. In fact, technology is always changing the economy. The internet, the automobile, the light bulb, the telephone, the computer, and a litany of historical technologies all altered the path of economic growth.
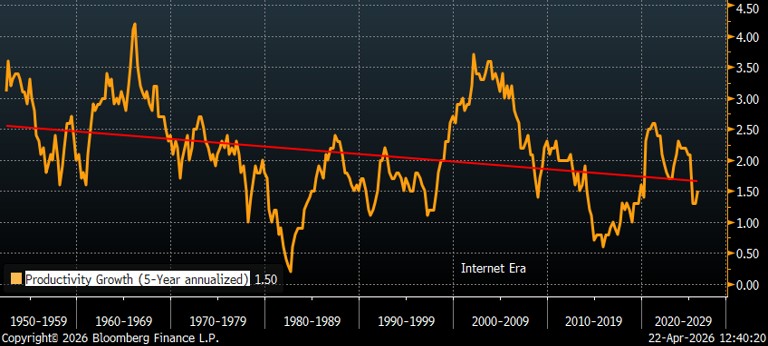
US trend productivity, however, has actually deteriorated over the past 75 years despite many new technologies. Chart 5 shows the trend in US productivity using 5-year annualized rates of change since 1950. Productivity is cyclical, but the 75-year regression line is downward sloping, which suggests that structural US productivity has slowed despite technological innovation.
If AI is going to cause a “productivity miracle,” it will be the first such miracle in the last 75 years. Of course, that could happen, but it seems somewhat imprudent to base US monetary policy on potentially undue optimism regarding AI’s influence on productivity.
A recent study by the National Bureau of Economic Research (NBER) seems to confirm our suspicions regarding AI not meaningfully enhancing productivity. They surveyed over 5,800 companies in four countries and found that roughly 80-90% of the companies in each country said that AI was not improving productivity (measured as sales per employee).1
Chart 5: US Productivity Growth
Source: RBA/JHI, Bloomberg Finance LLP, as at April 2026.
5. The labor market may be healthier than people think and, by the way, it looks like the 1960s
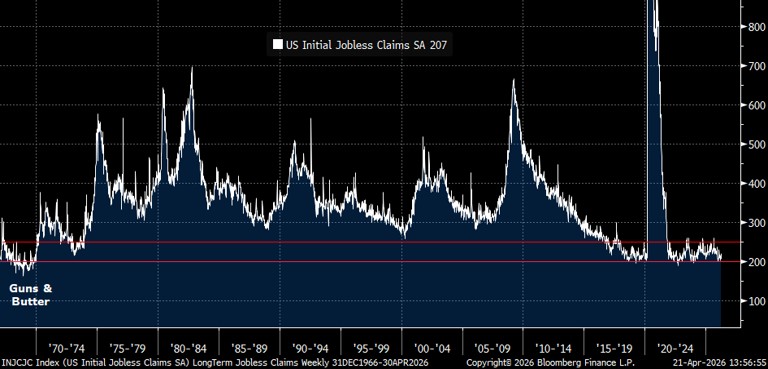
The US labor market has been mired in uncertainty but remains generally very healthy. Some economists have suggested the labor markets are weak because of tepid hiring, but true labor market weakness begins with layoffs and weekly initial jobless claims (a leading indicator of the economy) remain extremely strong.
In fact, the last time jobless claims were this strong was during the Guns & Butter period of the 1960s. Today’s labor market is much larger than that of 60 years ago, so it’s even more extraordinary that jobless claims resemble those of the 1960s (see Chart 6).
Chart 6: The Labor Market: US Initial Jobless Claims
Source: RBA/JHI, Bloomberg Finance LLP, as at April 2026.
Investing for the 2% inflation target seems antiquated
Will the next Fed Chair realize the Fed’s current 2% inflation target might be obsolete? The combination of deglobalization, the second coming of Guns & Butter, and an ongoing healthy labor market seem to argue 3-3.5% might be a more realistic target. Centering accommodative monetary policy on the assumption that AI will counteract these inflationary influences means imprudently basing policy on a structural improvement in productivity never seen before.
Consensus portfolios seem to be largely geared to disinflationary investment themes like longer-duration equities and fixed-income, suggesting investors have yet to realize that either the Fed’s 2% inflation target is obsolete or the Fed has considerably more inflation-fighting to do.
If future secular inflation is indeed higher than investors currently forecast, then shorter-duration, pro-inflation assets might present compelling investment opportunities.
1 Ivan Yotzov, Jose Maria Barrero, Nicholas Bloom, Philip Bunn, Steven J. Davis, Kevin M. Foster, Aaron Jalca, Brent H. Meyer, Paul Mizen, Michael A. Navarrete, Pawel Smietanka, Gregory Thwaites, and Ben Zhe Wang, “Firm Data on AI,” NBER Working Paper 34836 (2026), https://doi.org/10.3386/w34836.
Consumer price index (CPI): A measure that examines the price change of a basket of consumer goods and services over time. It is used to estimate inflation. ‘Headline’ CPI inflation is a calculation of total inflation in an economy, and includes items such as food and energy where prices tend to be more volatile. ‘Core’ CPI inflation is a measure of inflation that excludes transitory or volatile items such as food and energy. CPI
Deglobalization is the decline in international integration, interdependence, and trade, characterized by a shift from global supply chains toward regionalization, protectionism, and nation-state autonomy.
Disinflation is a temporary slowing in the rate of price inflation, where goods and services still become more expensive, but at a slower pace.
Inflation: The rate at which the prices of goods and services are rising in an economy. The consumer price index (CPI) and retail price index (RPI) are two common measures; the opposite of deflation.
The “One Big Beautiful Bill” Act (OBBBA) is a 940-page, 2025 Republican-backed legislative package designed to make 2017 tax cuts permanent, introduce new tax exemptions, fund border security, and restrict Medicaid/SNAP.
Standard deviation (stdev) measures the dispersion or spread of data points relative to their mean.
These are the views of the author at the time of publication and may differ from the views of other individuals/teams at Janus Henderson Investors. References made to individual securities do not constitute a recommendation to buy, sell or hold any security, investment strategy or market sector, and should not be assumed to be profitable. Janus Henderson Investors, its affiliated advisor, or its employees, may have a position in the securities mentioned.
Past performance does not predict future returns. The value of an investment and the income from it can fall as well as rise and you may not get back the amount originally invested.
The information in this article does not qualify as an investment recommendation.
There is no guarantee that past trends will continue, or forecasts will be realised.
Marketing Communication.