
Key takeaways:
- Global equities rebounded in April, with the U.S. and tech-heavy Asian markets leading the gains. Several major benchmarks recouped March losses and reached new record highs as risk appetite improved.
- Global sovereign bonds delivered mixed performance as yields remained elevated – and in some cases moved higher – across major markets. Global corporate bonds and securitized assets posted positive returns as spreads narrowed alongside improved risk sentiment.
- Despite an unresolved Middle East conflict and elevated oil prices, investor sentiment shifted decisively risk‑on as equities largely decoupled from energy markets. A strong start to earnings season and renewed AI enthusiasm underpinned the rally, even as central banks maintained a cautious stance and markets continued to price in a higher interest‑rate backdrop through 2026.
Global equities rebounded sharply in April as risk appetite improved and markets looked past ongoing geopolitical uncertainty. The MSCI World Index rallied 9.6% in U.S. dollar terms, marking its strongest monthly gain since late 2020 and setting a fresh record high. Technology-heavy benchmarks led the gains, with U.S. and Asian markets outperforming. Global government bonds delivered mixed returns, with yields ending the month higher in several major markets as inflation concerns persisted. Global corporate bonds also posted monthly gains, supported by tighter credit spreads and improved risk sentiment.
Oil prices were volatile throughout the month, falling sharply early in April amid Middle East ceasefire optimism before rebounding later as negotiations stalled. Brent crude futures briefly topped $125 a barrel, ending the month closer to $115, while WTI ended above $105 for its fourth consecutive monthly gain. The U.S. Dollar Index weakened by nearly 2% against global currencies amid reduced safe-haven demand. Gold posted a modest monthly decline.
Global equities rebounded in April, led by tech-heavy benchmarks
The MSCI World Index had its best month since November 2020, closing at a new all-time high.
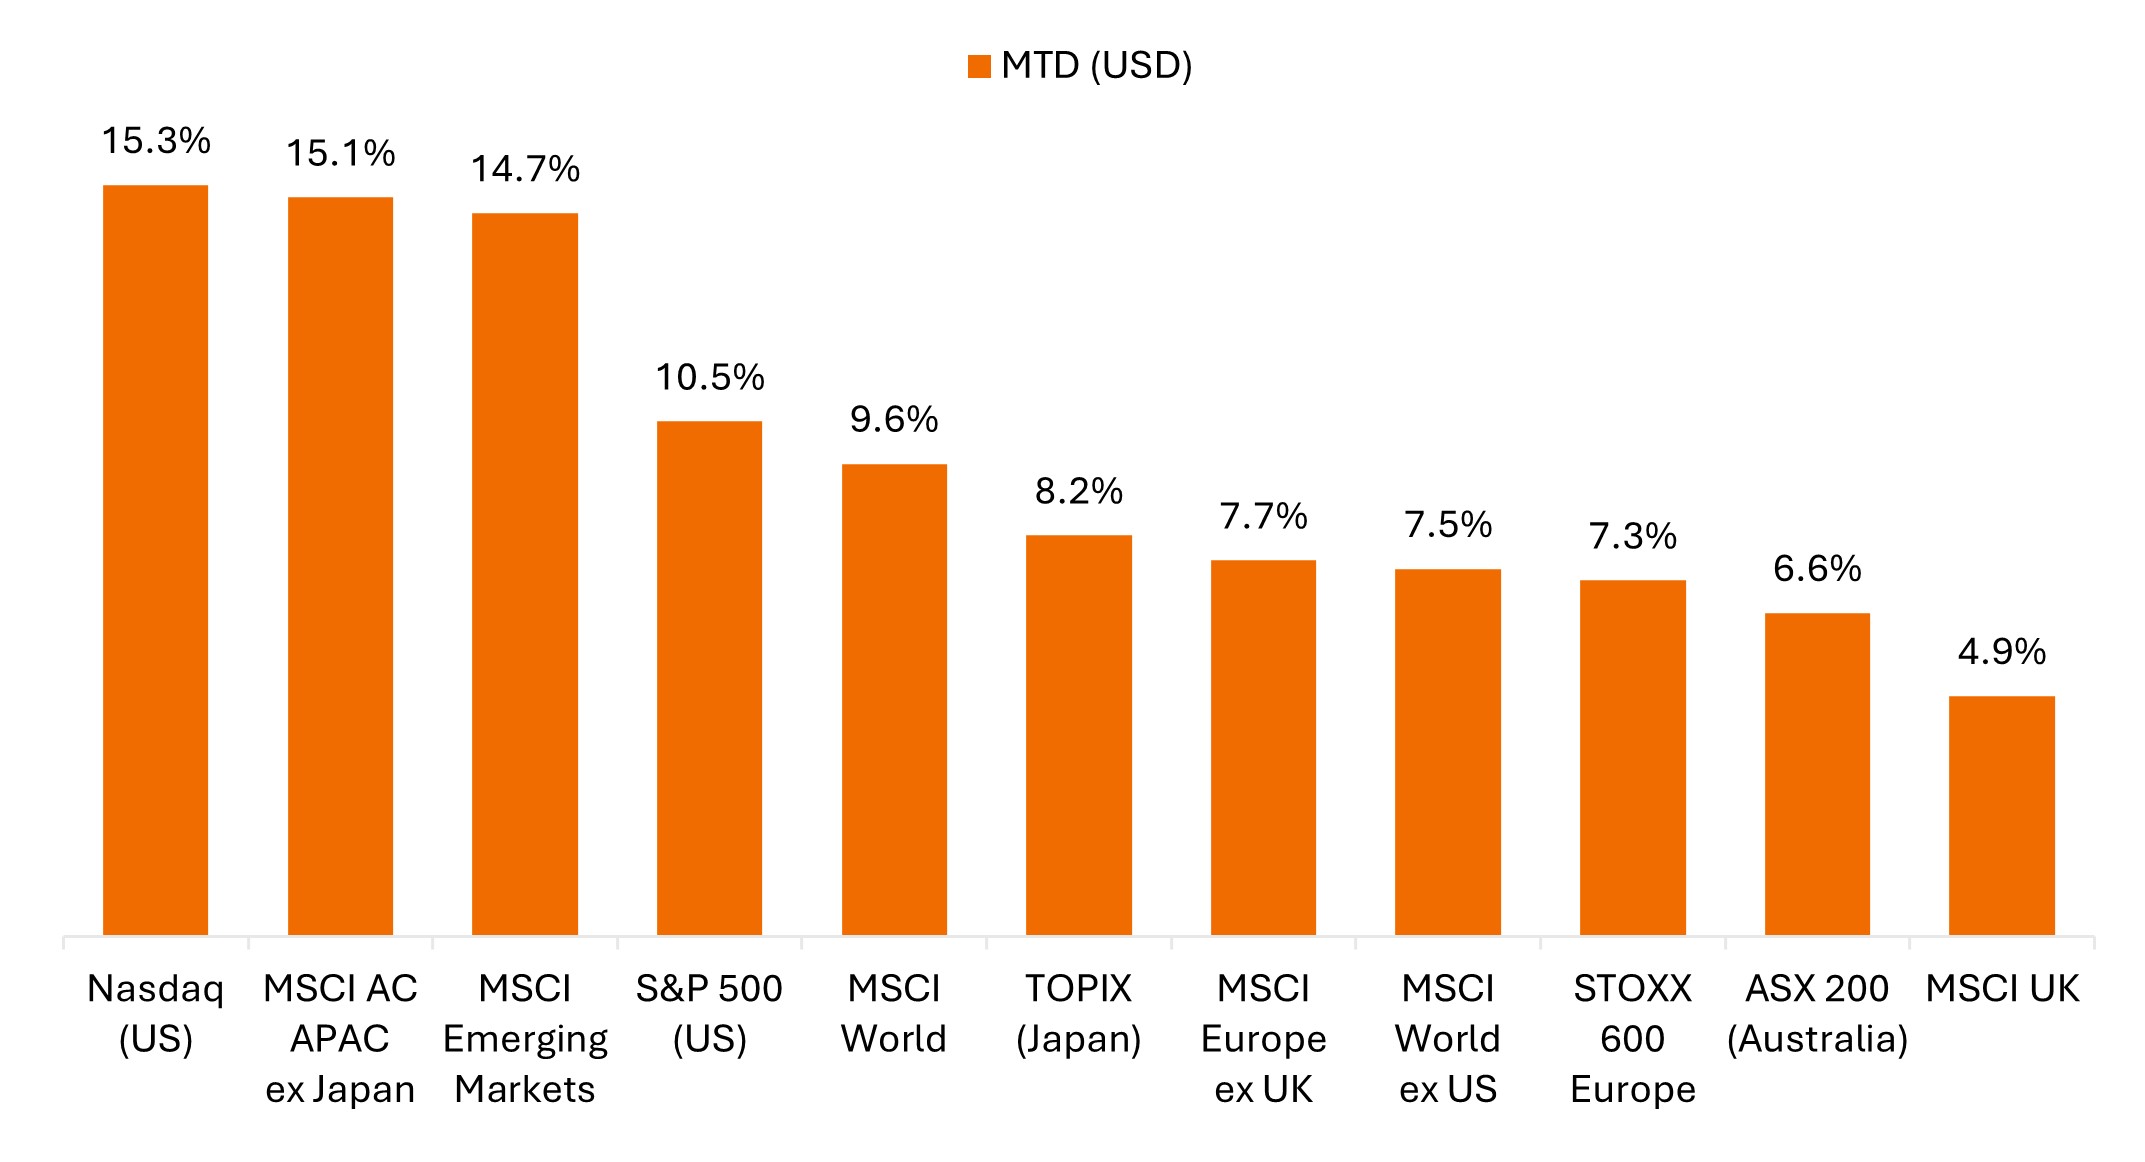
Source: Bloomberg, data from 31 March 2026 to 30 April 2026. Represents index total returns in U.S. dollar terms. Past performance is no guarantee of future results.
Key themes that mattered for markets
- Risk appetite rebounded as investors refocused on earnings: Global equities staged a strong recovery in April, reminiscent of last year’s snap-back following President Trump’s tariff reversal. While the announcement of a Middle East ceasefire drove early optimism, the rally proved resilient even as U.S.-Iran negotiations stalled, the Strait of Hormuz remained closed, and oil prices stayed elevated. A strong start to earnings season in the U.S. provided further support, alongside continued signs of robust AI-related capital spending and strong demand for compute.
- AI leadership reasserted itself: With the March selloff drawing attention to a months-long reset in Big Tech valuations, investors rotated back into AI-related stocks, particularly hyperscalers and AI infrastructure names. The PHLX Semiconductor Index (SOX) recorded a stretch of 18 consecutive daily gains, rallying more than 45% over that span, while the Nasdaq Composite had its best month in six years. Tech‑heavy Asian markets also delivered outsized gains.
- Middle East tensions and high oil prices continued to dominate headlines: Stocks largely decoupled from oil, with equities rebounding even as crude prices climbed amid a breakdown in talks between the U.S. and Iran. Brent crude briefly topped $125 per barrel before ending the month closer to $115, the highest level since 2022. By month end, the two countries remained far apart on key issues, with the Strait of Hormuz remaining effectively closed. Against this backdrop, some commentators warned of complacency, with investors not fully appreciating the risks to the global economy from a prolonged disruption in the key trade corridor.
- Hawkish central bank expectations persisted in April, keeping bond yields elevated: While major central banks remained largely on hold, biding time to assess the economic impact from the Middle East conflict, markets continued to price in the higher rate backdrop that took hold in March. Global bond yields remained elevated, and moved higher in some regions, with UK 10-year yields hitting an 18-year high as investors weighed inflation pressures from higher energy prices against potential demand destruction and economic slowdown.
United States
U.S. equities surged in April, driven by a sharp rally in technology-related stocks, while energy fell for the first time in six months. The rally was broad based across market capitalizations, with meaningful participation from small- and mid-cap stocks, while Bloomberg’s measure of “Magnificent 7” stock performance also posted its largest monthly gain in nearly three years. Investor sentiment improved as markets focused on resilient U.S. economic data, a strong start to earnings season, and continued enthusiasm around the AI theme.
- The S&P 500® Index rose 10.5% in April, closing the month at a fresh all-time high and posting its best monthly performance since November 2020.
- The S&P 500 Equal Weight Index gained 6.0%, underperforming the cap-weighted index as mega-cap stocks led the advance.
- The Nasdaq Composite surged 15.3%, its strongest monthly performance since April 2020, closing at a new record high.
- The small-cap Russell 2000 Index rose 12.3%, its largest monthly gain since late 2020, reaching a new all-time high.
- While growth and value both delivered strong gains, the Russell 2500 Growth Index outperformed its value counterpart, rising 12.9%, compared with a 10.4% gain for the Russell 2500 Value Index.
Sector performance reflected a rotation back into big tech
S&P 500 sector performance (April and year to date)
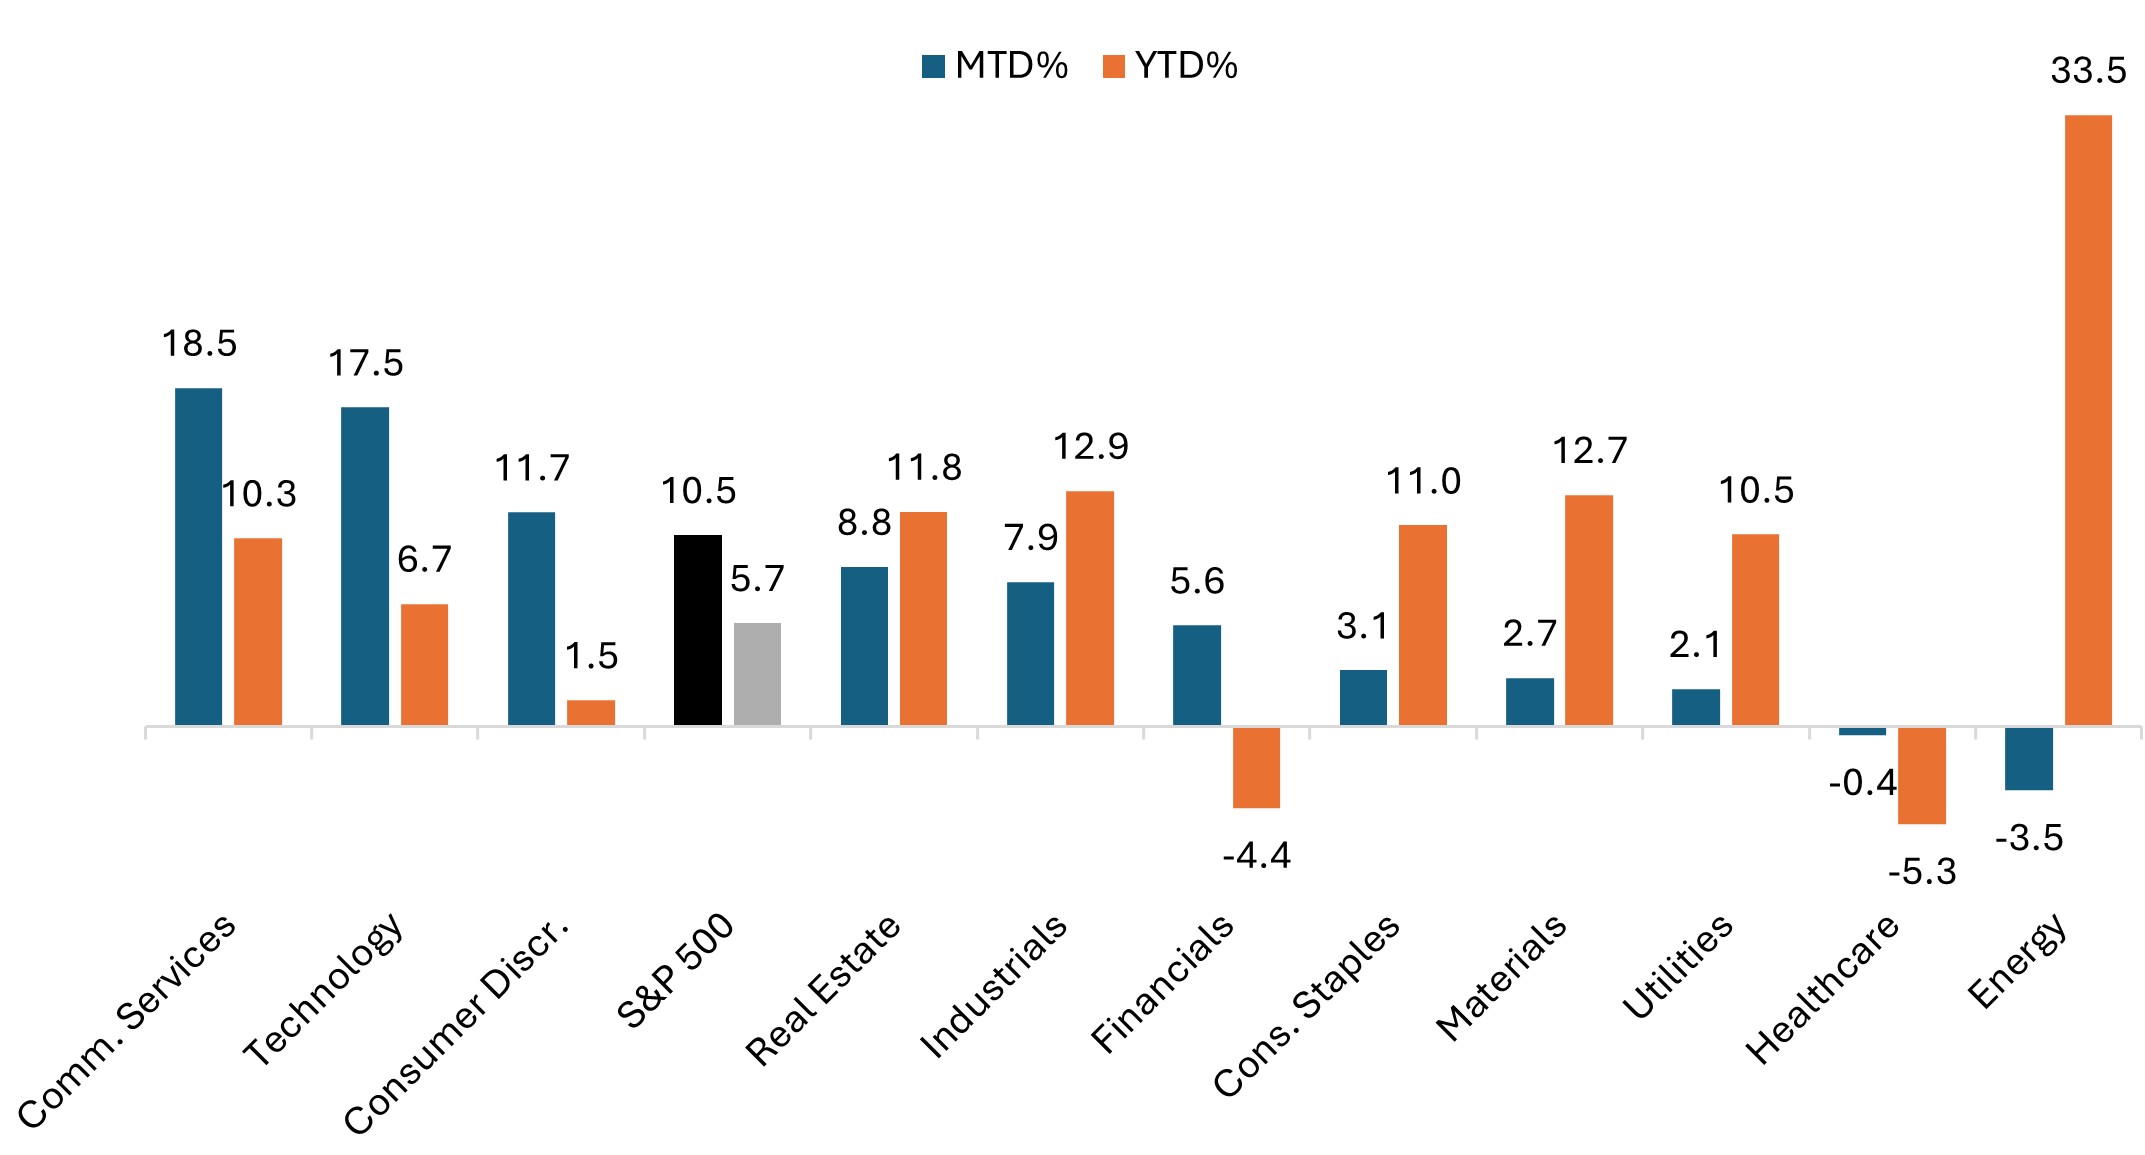
Source: Bloomberg, as of 30 April 2026. Past performance is no guarantee of future results.
U.S. economic data reflected labor market resilience, alongside mixed growth and inflation signals:
- The Federal Reserve (Fed) left policy unchanged, as expected. However, four voting members dissented, the most since 1992. Fed Chair Jerome Powell announced he will remain on the Board of Governors past the end of his term on May 15, citing concerns about recent legal attacks on the Fed.
- Labor market data surprised to the upside, with March nonfarm payrolls rising by 178,000 and rebounding from the prior month’s 133,000 decline (revised down from -92,000), while the unemployment rate edged down to 4.3% from 4.4%.
- Inflation data was mixed. The March Consumer Price Index (CPI) jumped 0.9% month over month and 3.3% year over year, driven by a surge in gasoline prices, while core CPI eased to 2.6%, below consensus expectations. Meanwhile, the Producer Price Index (PPI) rose less than expected in March, up 0.5% month over month and 4.0% year over year, compared with expectations for increases of 1.1% and 4.7%, respectively.
- U.S. Gross Domestic Product (GDP) growth for the fourth quarter was revised down for a second time to 0.5% (from the prior +0.7% estimate). The first estimate of Q1 GDP pointed to a rebound, with the economy growing at an annualized rate of 2.0% in the first three months of 2026.
- S&P Global Purchasing Managers’ Index (PMI) data painted a mixed picture, as the March final composite PMI was revised down to 50.3 from a preliminary 51.4 (and 51.9 in February), marking the lowest reading since September 2023, before the flash April PMI rebounded to 52.0, led by a pickup in manufacturing.
Europe
Eurozone equities rallied in April, benefiting from a global risk-on environment despite ongoing concerns about growth and inflation. The MSCI Europe ex United Kingdom Index gained 6.0% in euro terms and 7.7% in U.S. dollars, recording its best month since January 2025, though not fully recouping losses from March. Germany’s DAX rose nearly 9% in euro terms, though remained slightly lower on the year.
- The European Central Bank (ECB) left policy unchanged, as expected. President Lagarde noted officials debated a rate increase at this month’s meeting and signaled that a June hike is likely if energy prices remain elevated.
- Final Eurozone CPI for March was revised higher to 2.6% year over year, from a 2.5% flash estimate, amid energy‑driven price pressures. Eurostat’s flash estimate for April, released at the end of the month, pointed to CPI rising 3.0% year over year.
- Economic growth indicators softened. Eurozone GDP grew 0.8% year over year in the first quarter, down from 1.3% in the prior quarter, while German business sentiment fell to its lowest level since 2020 in April. Consumer confidence across the Eurozone also deteriorated, with the European Commission’s flash index dropping to its lowest level since late 2022, as the Iran conflict and higher energy costs weighed on household expectations.
- PMI data reinforced the weakening growth backdrop, as the March final Eurozone composite PMI slipped to 50.7, a nine‑month low, reflecting slowing activity amid surging input costs. The April flash composite PMI fell to 48.6, putting it in contraction territory for the first time since December 2024, driven by a sharp drop in services sector activity.
UK equities also advanced in April, though gains lagged those of continental Europe. The MSCI United Kingdom Index rose 2.1% in sterling terms and 4.9% in U.S. dollar terms, as Sterling strength magnified gains for dollar-based investors. The FTSE All-Share Index increased 2.8% in local currency terms, rising 5.6% in U.S. dollars. The bounce came despite persistent concerns around inflation, fiscal pressures, and elevated bond yields. The yield on the UK 10-year gilt ended above 5.0%, the highest since 2008.
- The Bank of England (BoE) held policy rates steady, though officials cautioned that inflation is likely to climb in coming months. Policymakers reiterated a data-dependent stance, noting the central bank stands ready to act if needed.
- The UK unemployment rate fell to 4.9% in the three months to February, below both consensus and the prior 5.2%, while wage growth slowed modestly to 3.8% year over year (from 4.1% prior), albeit slightly above the 3.6% expected pace.
- Growth data surprised modestly to the upside early in the quarter, with UK GDP rising 0.5% month over month in February, beating expectations for 0.1% growth. However, policymakers and forecasters warned that momentum could fade as the economic impact of the Iran conflict intensifies.
- Inflation pressures re‑accelerated amid higher fuel prices, with headline CPI rising to 3.3% year over year in March (from 3.0% in February), in line with expectations.
- UK PMI data sent mixed signals, as the April flash composite PMI rebounded to 52.0 from 50.3 in March, beating expectations, driven by gains in both services and manufacturing. However, firms reported a record surge in input costs and weaker business confidence, reinforcing concerns that the pickup reflected short‑term stockpiling ahead of feared price increases.
- Political uncertainty increased, as Prime Minister Starmer faced mounting pressure within his party and from opposition lawmakers amid controversy over the appointment of Peter Mandelson as the UK’s ambassador to the U.S.
European equities rallied in April – STOXX 600 had its best month since January 2025
Euro and Sterling strength magnified gains in U.S. dollar terms, particularly for the UK.
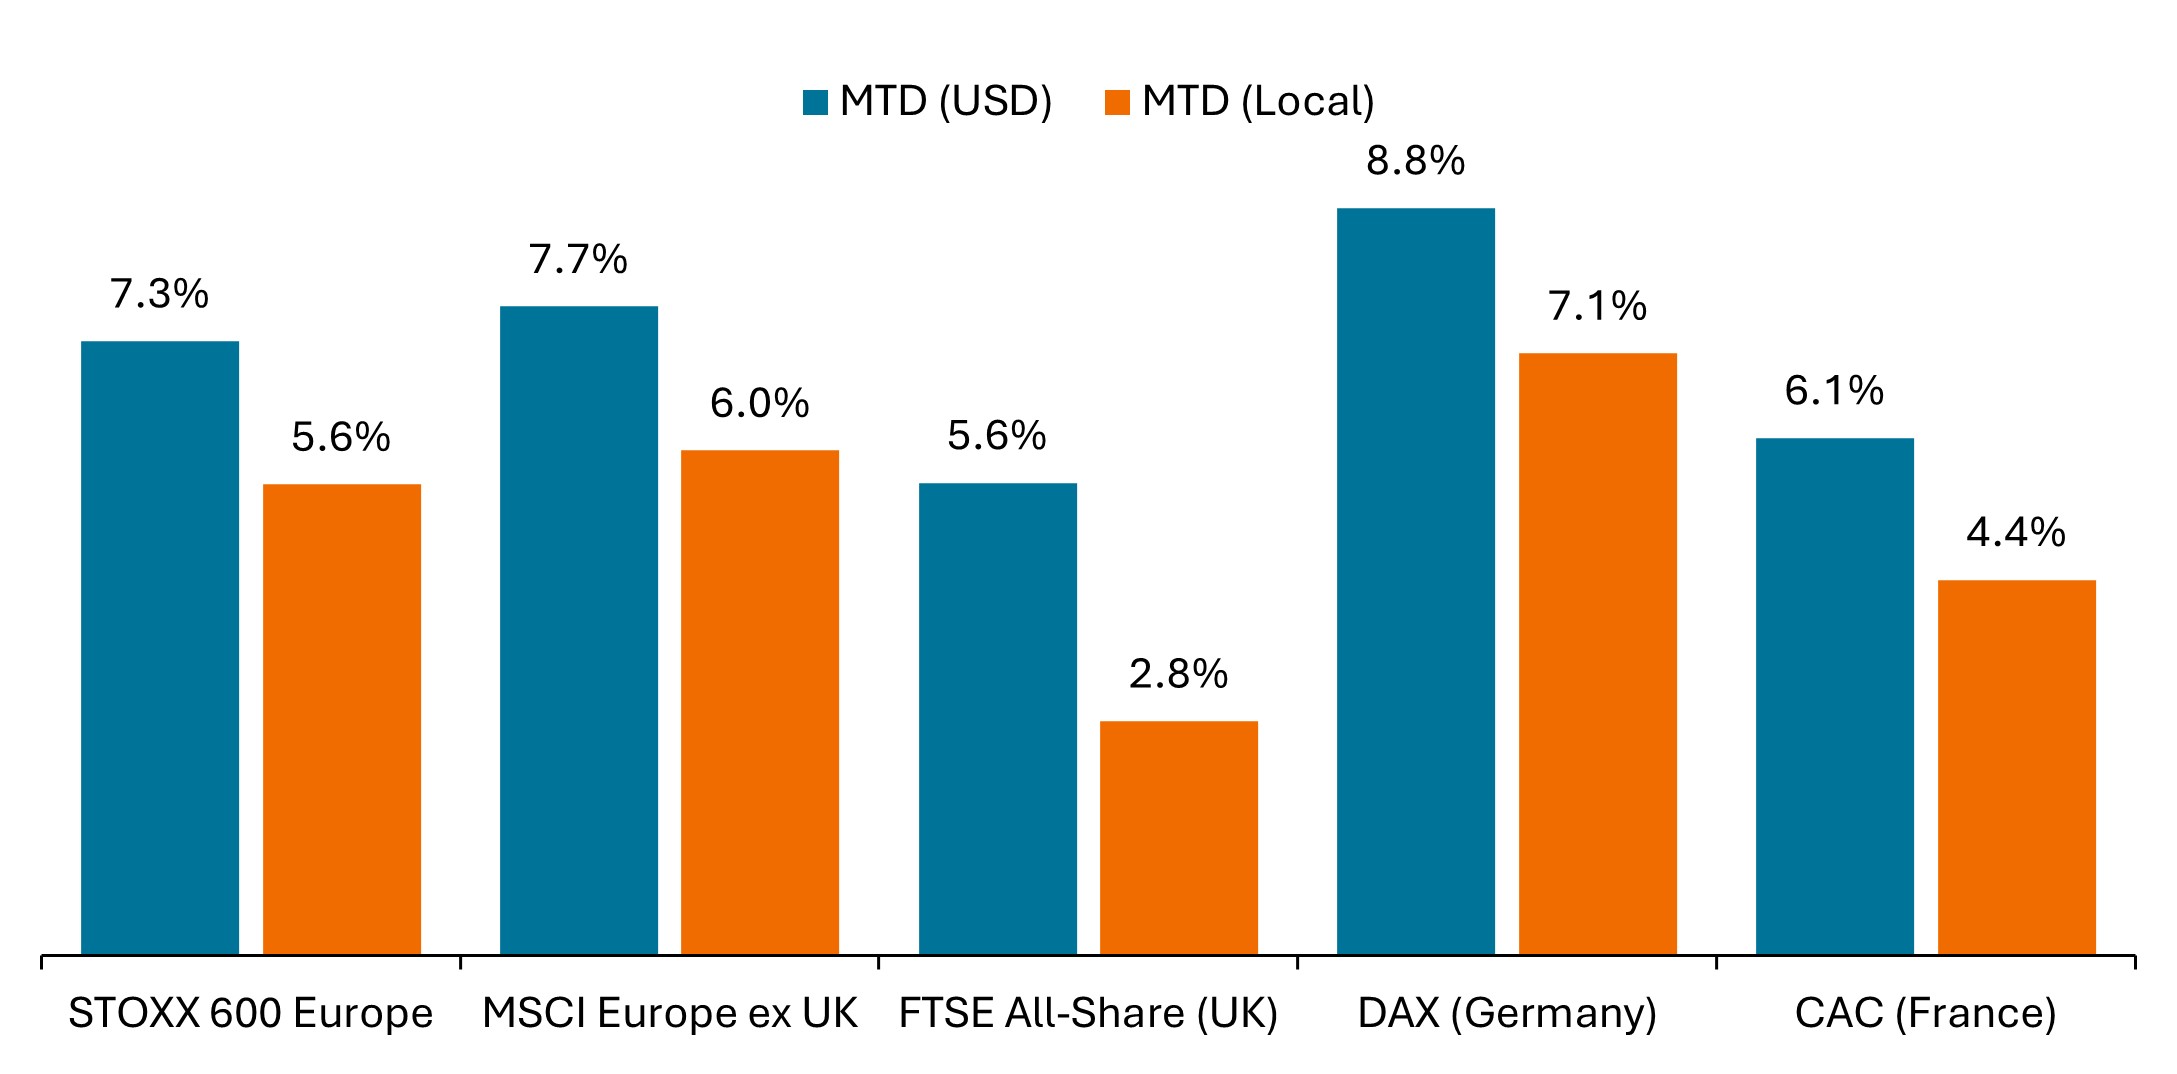
Source: Bloomberg, data from 31 March 2026 to 30 April 2026. Past performance is no guarantee of future results.
Across the STOXX 600 Index – comprising companies from 17 countries across developed Europe including the UK – sector performance was broadly positive.
- Technology (+13.9% in euro terms) led the advance, supported by renewed enthusiasm around AI‑related investment, while Banks (+10.1%) and Financial Services (+8.9%) benefited from well-received corporate results and a recovery in risk sentiment. Media (+9.8%) also outperformed.
- Industrials (+8.7%) delivered strong returns, supported by defense and data-center demand. Construction & Materials (+8.0%) and Basic Resources (+6.7%) also gained amid supply disruption dynamics and resilient commodity prices. In addition, Real Estate (+5.7%) and Insurance (+5.1%) posted solid gains.
- Utilities (+4.3%) and Telecom (+3.8%) lagged the broader market. Consumer (+3.6%) delivered mid‑single‑digit returns, while Food, Beverage & Tobacco (+2.6%), Auto & Parts (+2.4%), Retail (+2.3%), and Travel & Leisure (+2.1%) rose but trailed the index amid ongoing cost pressures and mixed demand signals.
- Energy (+0.9%) lagged after rallying nearly 15% last month amid continued oil price volatility, while Healthcare (-0.9%) was the sole decliner, weighed down by stock‑specific and earnings‑related factors.
Asia Pacific
Japanese equities rallied sharply in April as global risk appetite improved and tech outperformed. The TOPIX rose 6.6% in local currency terms and 8.2% in U.S. dollars, as the yen strengthened against the greenback. The Nikkei 225 surged 16.1% in yen terms and 17.9% in dollars, reaching a new record high, with the price-weighted benchmark notably outperforming the market cap-weighted TOPIX due to larger representation from AI-related technology stocks.
- The Bank of Japan (BoJ) held policy steady at its April meeting. However, the decision came in a split 6-3 vote, with three members in favor of a rate hike, compared with March when only one dissented.
- Data showed real wages jumped 1.9% year over year in February, the fastest pace in five years, beating estimates and boosting BoJ rate-hike expectations.
- Japan’s March industrial production declined 0.5% month over month on a seasonally adjusted basis, missing expectations of a 1.1% monthly gain. However, S&P Global’s flash PMI report for April showed factory activity expanded at the strongest pace in over four years, with manufacturing PMI jumping to 54.9 (from 51.6), partly attributed to frontloading amid Middle East war-related supply concerns.
Equity markets across Asia Pacific ex Japan recovered from March’s steep decline, with semiconductors and memory names driving the gains. The MSCI AC Asia Pacific ex Japan Index rose 15.1% in U.S. dollar terms. South Korea and Taiwan drove the gains, with outsized contribution from chipmakers. The MSCI China Index advanced more modestly, up 3.6% in U.S. dollar terms, with stronger first-quarter GDP growth partially offset by mixed activity data and ongoing concerns around trade and the durability of external demand. Australia’s ASX gained 6.6% in U.S. dollar terms but rose a more modest 2.2% in AUD. The Aussie strengthened meaningfully against the greenback amid expectations for further Reserve Bank of Australia (RBA) tightening; by month end, markets were pricing a 75% chance of a 25 basis-point rate hike at the May 5 meeting.
Emerging Markets
Emerging market equities rebounded in April, led by tech-heavy Asian markets and pockets of strength in EMEA, while returns across Latin America were mixed. The MSCI Emerging Markets Index gained 14.7% in U.S. dollar terms, its best monthly performance since November 2022, fully recouping March’s drawdown. Performance figures below reference MSCI country indices reported in U.S. dollar terms.
- South Korea (+37.4%) and Taiwan (26.6%) led gains, benefiting from renewed enthusiasm around global technology and semiconductor demand. Indonesia (-7.4%) and the Philippines (-2.3%) fell amid concerns about inflation and energy supply disruption.
- Latin America equities saw mixed results, with the MSCI EM Latin America Index rising 3.2% in U.S. dollar terms. MSCI benchmarks for Brazil (+4.1%) and Mexico (+2.8%) posted gains, while Colombia (-6.4%) and Argentina (-4.7%) fell.
- In EMEA, Hungary (+22.8%) rallied, with sentiment boosted by Peter Magyar’s landslide victory on April 12, which ended Viktor Orban’s 16-year rule. Investors appeared to welcome prospects of a more constructive relationship with the European Union. Turkey (11.3%) also posted strong gains. South Africa (+2.4%) managed a small gain following a steep drop in March.
- India (+8.6%) rebounded as strong corporate earnings helped temper concerns about the Iran war and elevated oil prices.
Fixed Income
Global government bonds delivered mixed results as yields remained elevated – and rose in some regions – amid energy-driven inflation pressures. While equity sentiment shifted to risk-on mode in April, fixed income markets continued to reflect concerns around higher energy prices, the prospect of tighter monetary policy to combat inflation, and fiscal pressures.
- The Bloomberg Global Treasury Index edged up 0.2% in U.S. dollar terms.
- The U.S. Treasury curve shifted slightly higher in April, building on the sharp bear flattening in March. The spread between 10-year and 2-year yields narrowed slightly from 52 bps at the start of the month to 50 bps at the end of April.
- The U.S. 10-year Treasury yield rose 5 bps, ending the month at 4.37%.
U.S. Treasury yield curve (month-on-month change)
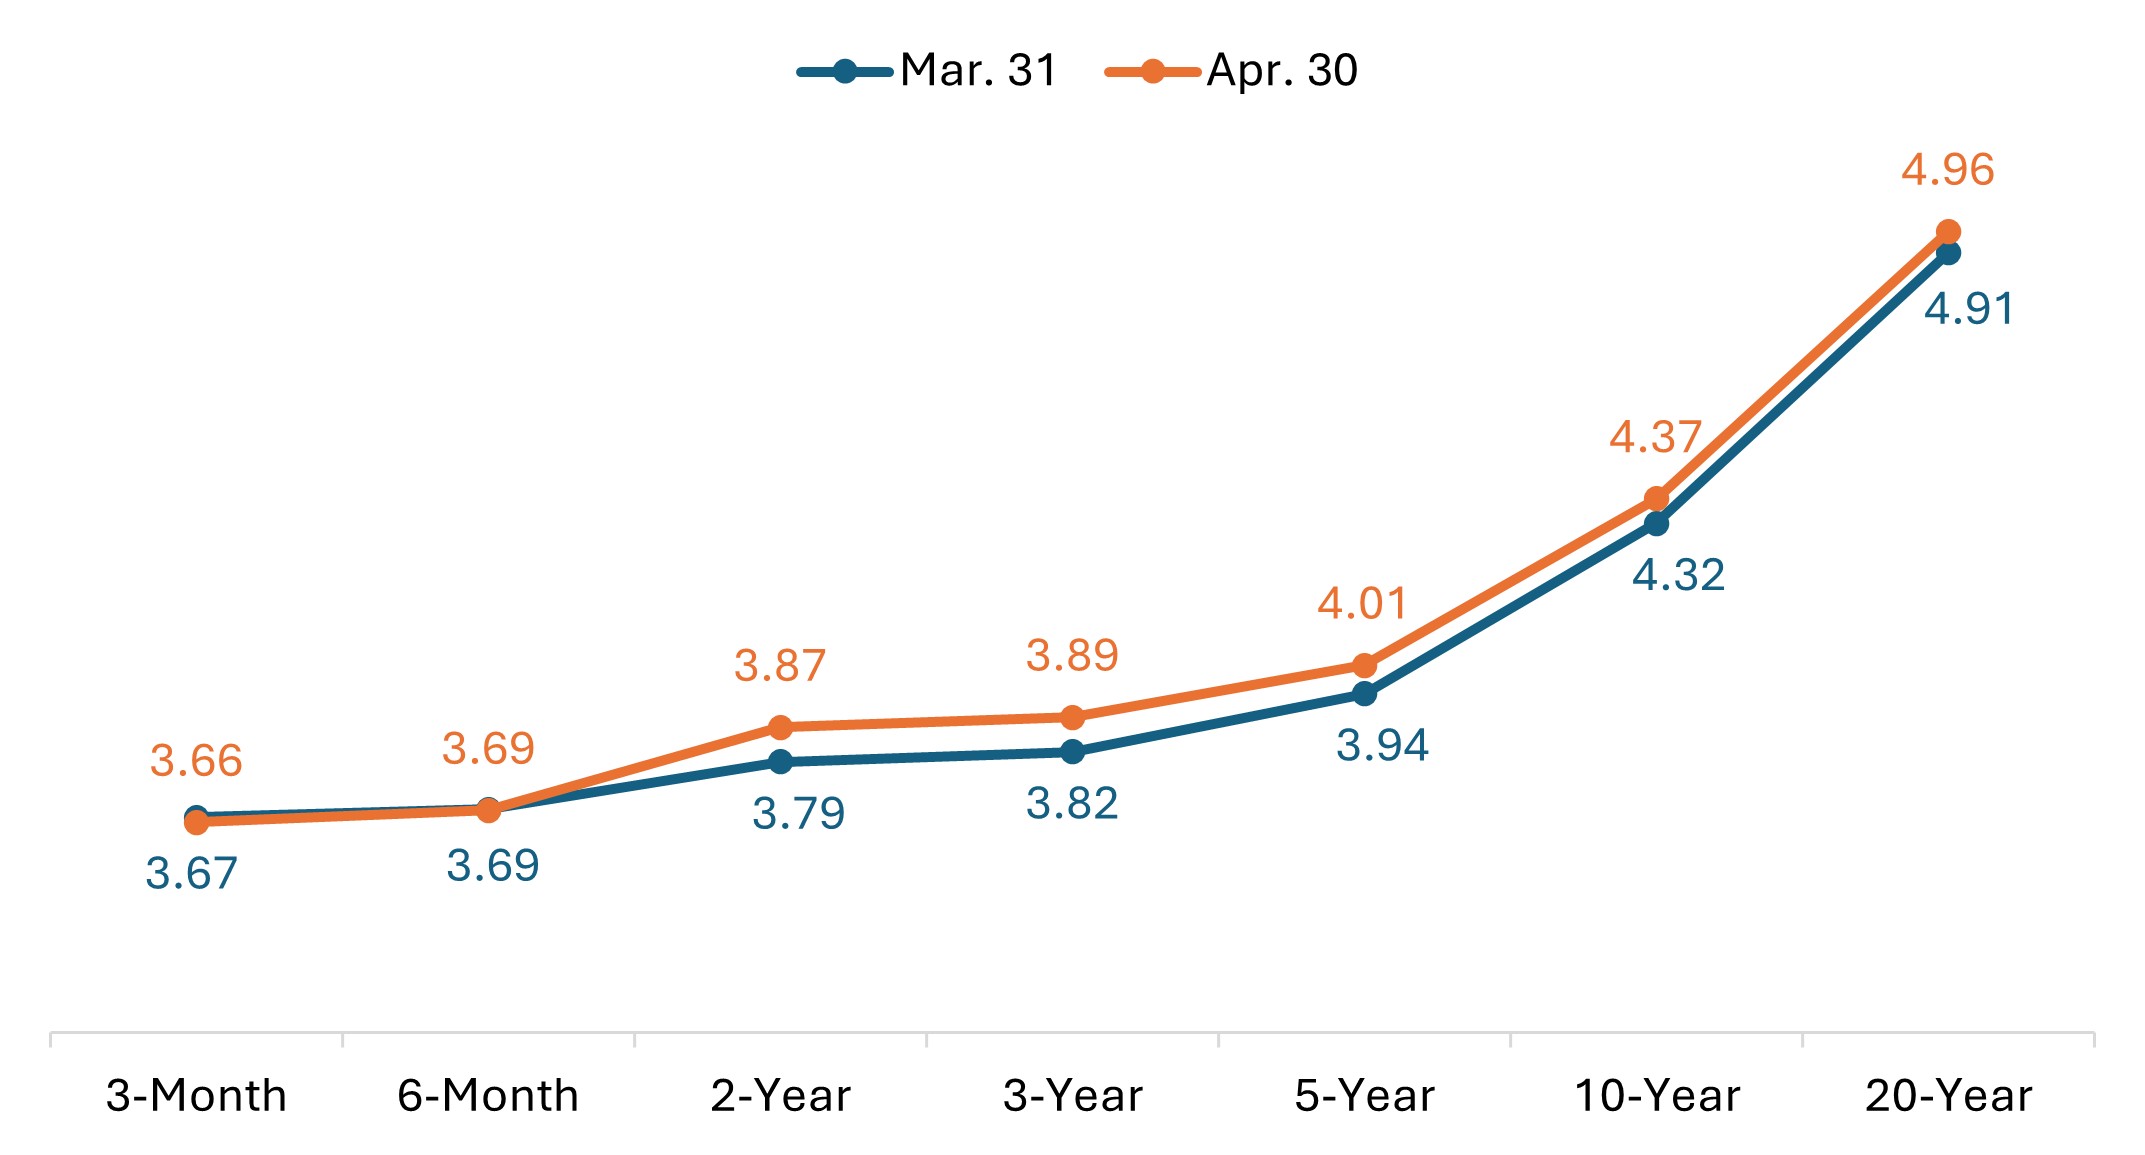
Source: Bloomberg, as of 30 April 2026. Past performance is no guarantee of future results.
- In Europe, UK government bonds underperformed. The 10-year gilt yield rose by 10 bps, ending the month above 5.0% for the first time in 18 years.
- German sovereign bonds were little changed in euro terms. The yield on the 10-year bund edged up 3 bps in April after rising roughly 36 bps in March.
- Japanese government bonds (JGB) declined in April. The yield on the 10-year JGB rose 15 bps, ending the month above 2.5% for the first time in more than 25 years.
Spread sectors delivered positive returns, with option-adjusted spreads (OAS) narrowing amid improved global risk sentiment. Among corporates, high-yield bonds outperformed investment-grades in both U.S. and overseas markets.
- The Bloomberg Global Aggregate Corporate Index rose 1.3% in U.S. dollar terms, while the Bloomberg Global High Yield Index returned a more robust 2.6%.
- Global investment-grade spreads narrowed by approximately 12 bps, while high-yield spreads narrowed by roughly 54 bps.
- U.S. investment-grade corporate spreads narrowed by approximately 11 bps in April. U.S. high-yield spreads narrowed by roughly 49 bps.
- In securitized markets, asset-backed securities (ABS) and mortgage-backed securities (MBS) spreads narrowed by approximately 4 bps, reversing the widening seen in March.
Central Bank Watch
Major central banks remained largely on hold in April as they await more clarity on the impact from the Middle East conflict. Policymakers broadly maintained their cautious stance from the prior month, acknowledging that higher energy prices could pose upside risks to inflation and downside risks to economic growth. After a hawkish shift in rate expectations in March, markets continued to price in two to three rate hikes this year from the ECB and BoE, with the Fed expected to stay on hold through year end.
- Bank of Japan (Apr. 28): The BoJ left its policy rate unchanged at 0.75%, albeit with a split 6-3 vote (compared to 8-1 in March). Three board members voted in favor of raising rates to 1.0%, the highest number of dissenters since 2016. The divided decision was widely interpreted as a hawkish hold, supporting expectations for a rate hike as early as the June meeting. The BoJ also sharply raised its 2026 inflation forecast and marked down its growth outlook, citing impacts from the Middle East conflict and closure of the Strait of Hormuz.
- Bank of Canada (Apr. 29): The BoC held its policy rate at 2.25%, as widely expected. Governor Macklem said the current rate “looks appropriate” but signaled the central bank stands ready to hike rates if the Middle East conflict keeps oil prices elevated or cut if the U.S. imposes new tariffs or trade restrictions on Canada that would weigh on the growth outlook.
- U.S. Federal Reserve (Apr. 29): The FOMC held its benchmark rate in the 3.5%-3.75% range in an unusually divided 8-4 decision, the most dissents in 34 years. Three officials opposed the inclusion of an easing bias in the statement, while Governor Miran again dissented in favor of a quarter-point cut. In his final press conference as chair, Jerome Powell said he will remain on the Board of Governors beyond the end of his term on May 15, citing recent legal attacks on the central bank. The split vote offered mixed signals for Fed chair nominee Kevin Warsh: While dissents against the easing bias suggested resistance to near-term rate cuts, some viewed the pushback as a form of deference, leaving room for the incoming chair to set his own policy direction.
- Bank of England (Apr. 30): The BoE held its policy rate at 3.75% in an 8-1 vote, with Chief Economist Pill dissenting in favor of a 25-bp hike, as expected. The Monetary Policy Committee anticipates near-term inflation will climb and is watching for second-round effects but expects weaker growth and tighter financial conditions to dampen the impact. Officials stressed that policy remains data-dependent and the central bank stands ready to act if needed.
- European Central Bank (Apr. 30): The ECB held its deposit rate at 2.0%, as expected. President Lagarde noted policymakers discussed “in depth” a possible rate hike but made “an informed decision on the basis of yet insufficient information.” Lagarde signaled the ECB will consider a June hike, while analysts continued to view an increase as likely unless there are positive developments on energy prices.
- Other central banks: Policymakers largely maintained a wait-and-see posture, noting the Middle East conflict could add to inflation pressures while clouding the outlook for economic growth. The Reserve Bank of India held its policy rate at 5.25% for a second consecutive meeting, following 125 basis points (bps) of easing in 2025. The People’s Bank of China left its one‑year and five‑year loan prime rates unchanged for an eleventh straight month, while the Bank of Korea and Bank of Indonesia both held rates steady for a seventh consecutive meeting. Hungary and Turkey also left policy rates unchanged, as expected. A notable outlier, the Philippines’ central bank raised its target rate by 25 bps to 4.5%, its first hike in more than two years, and signaled that further increases are likely as the Iran conflict has pushed inflation well above its target range. In contrast, the Bank of Russia cut its key rate by 50 bps to 14.5%, extending its easing cycle, despite officials cautioning that inflation risks remain elevated. Brazil also cut by 25 bps to 14.5% but signaled its easing cycle may pause due to mounting inflation pressures.
Key events on tap in May
- May 1, 4 – Global Manufacturing PMIs (April, final)
- May 5 – Reserve Bank of Australia (RBA) rate decision
- May 5, 6 – Global Services and Composite PMIs (April, final)
- May 7 – UK local government elections
- May 8 – U.S. Nonfarm Payrolls, Unemployment Rate (April)
- May 12 – U.S. Consumer Price Index (April)
- May 13 – Eurozone Gross Domestic Product (Q1, second estimate)
- May 14 – UK Gross Domestic Product (Q1, preliminary)
- May 14,15 – China-U.S. trade summit (rescheduled from March)
- May 19 – People’s Bank of China (PBOC) rate decision
- May 20 – Eurozone Consumer Price Index (April, final)
- May 20 – Australia employment, unemployment rate (April)
- May 20 – UK Consumer Price Index (April)
- May 21 – Global PMIs (May, flash estimate)
- May 28 – U.S. Gross Domestic Product (Q1, second estimate)
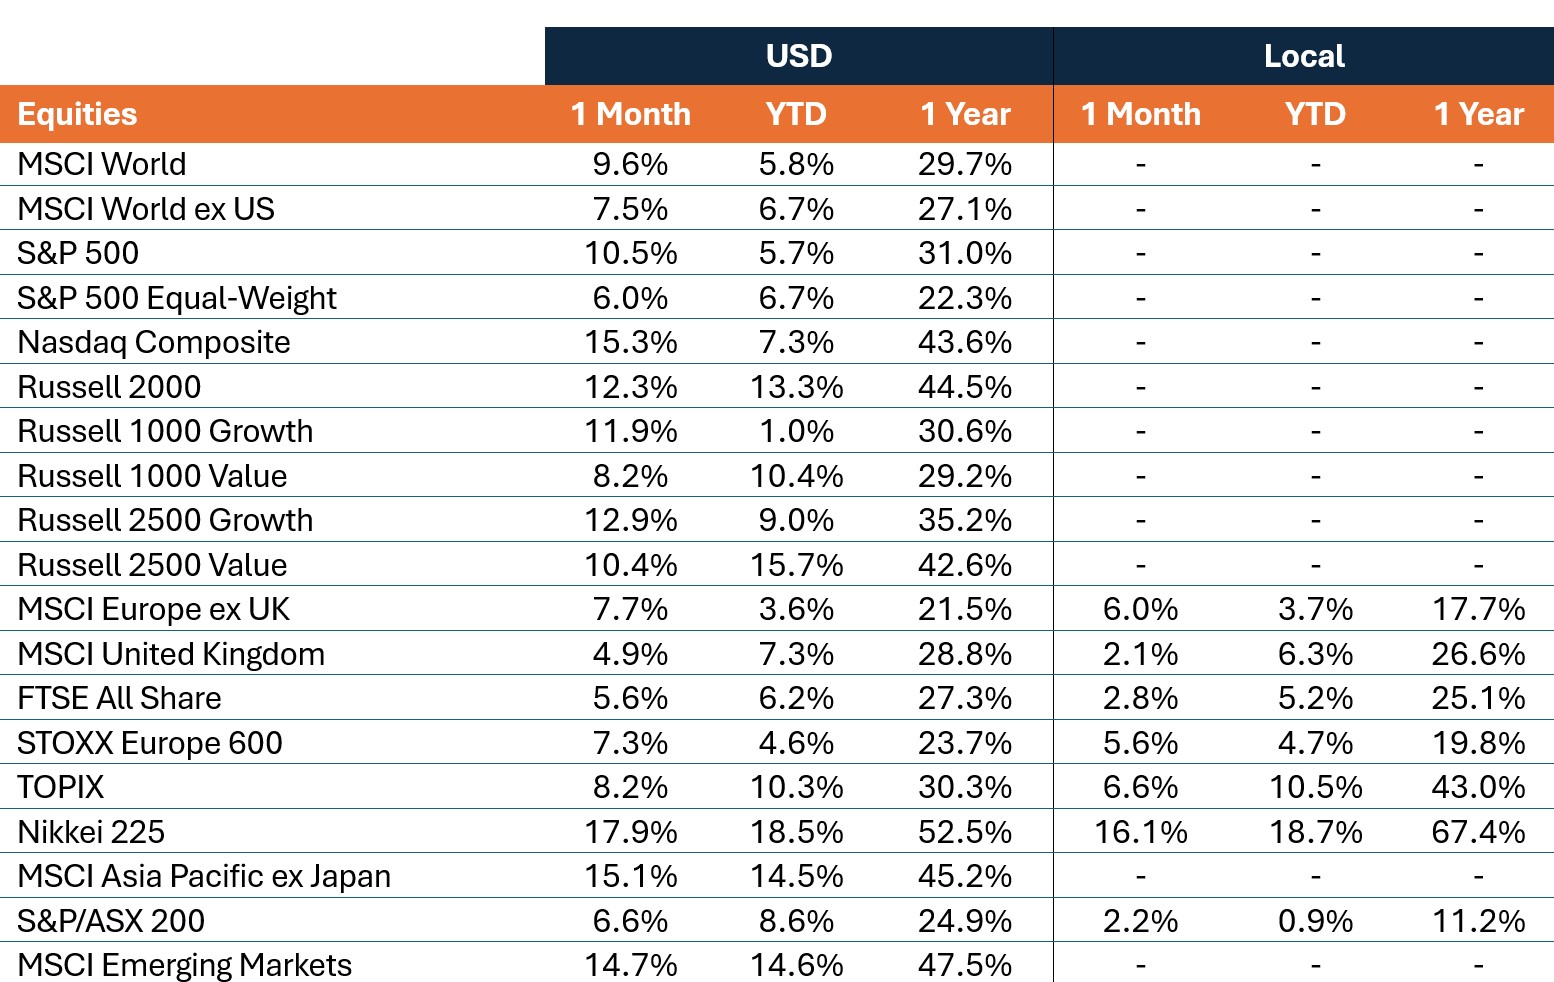
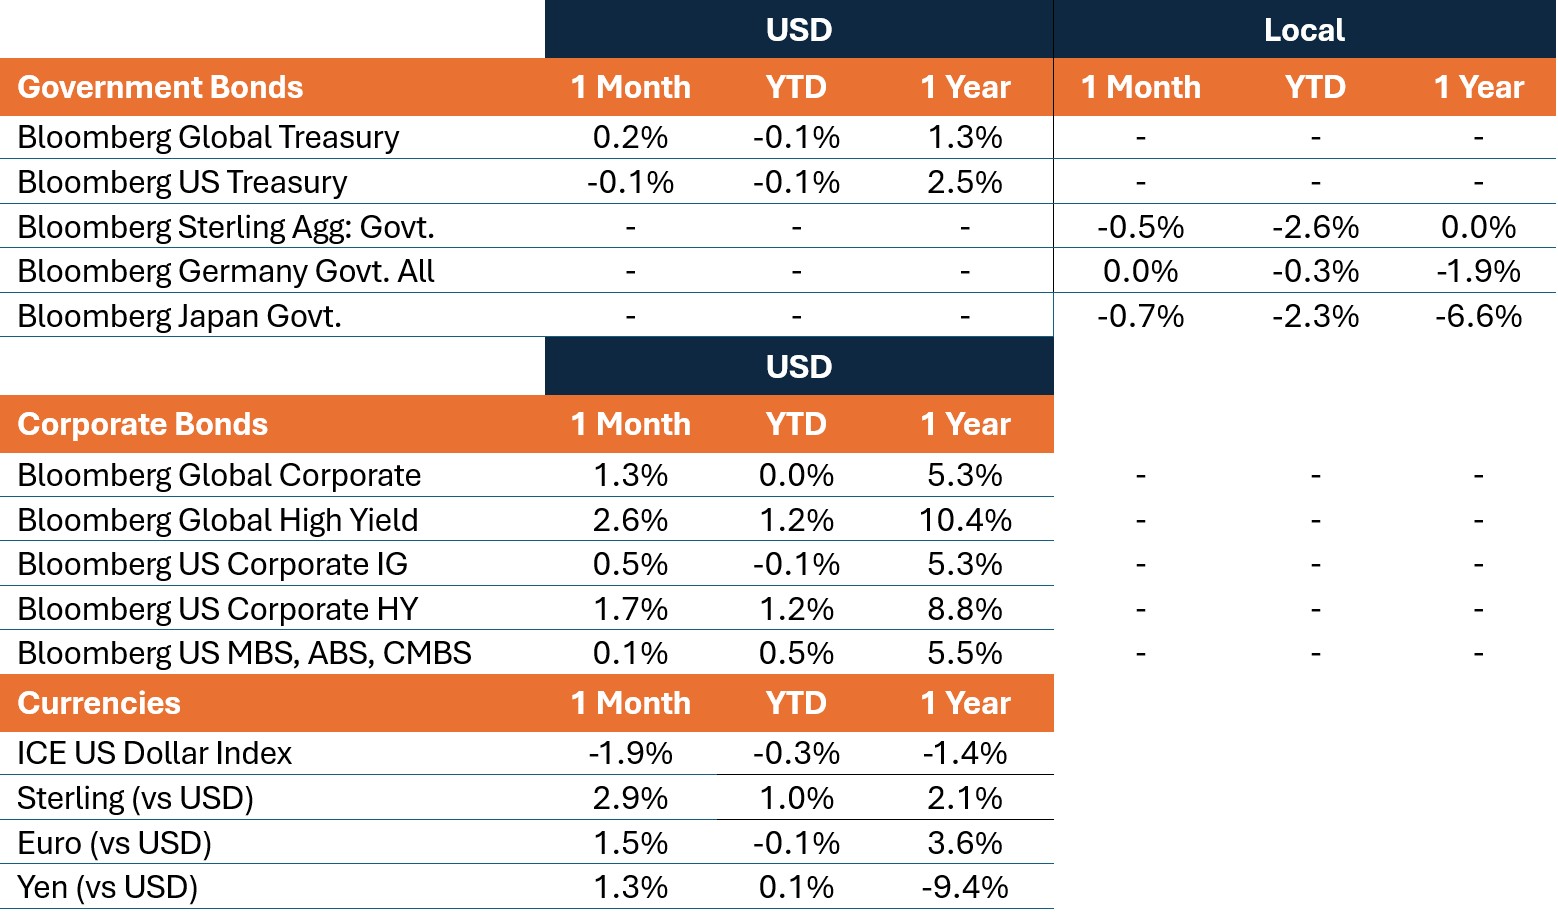
Market Performance
Total returns (%), periods ended April 30, 2026
IMPORTANT INFORMATION
Artificial intelligence (“AI”) focused companies, including those that develop or utilize AI technologies, may face rapid product obsolescence, intense competition, and increased regulatory scrutiny. These companies often rely heavily on intellectual property, invest significantly in research and development, and depend on maintaining and growing consumer demand. Their securities may be more volatile than those of companies offering more established technologies and may be affected by risks tied to the use of AI in business operations, including legal liability or reputational harm.
Equity securities are subject to risks including market risk. Returns will fluctuate in response to issuer, political and economic developments.
Fixed income securities are subject to interest rate, inflation, credit and default risk. As interest rates rise, bond prices usually fall, and vice versa. High-yield bonds, or “junk” bonds, involve a greater risk of default and price volatility. Foreign securities, including sovereign debt, are subject to currency fluctuations, political and economic uncertainty and increased volatility and lower liquidity, all of which are magnified in emerging markets.
Securitized products, such as mortgage- and asset-backed securities, are more sensitive to interest rate changes, have extension and prepayment risk, and are subject to more credit, valuation and liquidity risk than other fixed-income securities.
Bloomberg Asian-Pacific Japan Government-Related Index is a fixed-rate, investment grade, JPY-denominated benchmark that includes debt from government-related issuers.
Bloomberg Germany Government All Bonds Index measures the performance of German government bonds (Bunds) issued by the German government.
Bloomberg Global Aggregate – Corporate Index is a flagship measure of global investment grade, fixed-rate corporate debt. This multi-currency benchmark includes bonds from developed and emerging markets issuers.
Bloomberg Global High Yield Index is a multi-currency flagship measure of the global high yield debt market. The index represents the union of the US High Yield, the Pan-European High Yield, and Emerging Markets (EM) Hard Currency High Yield Indices.
Bloomberg Global Treasury Index tracks fixed-rate, local currency government debt of investment grade countries, including both developed and emerging markets.
Bloomberg Sterling Aggregate: Government Index measures the performance of UK government bonds (Gilts) within the broader Bloomberg Sterling Aggregate Index, which covers the investment-grade, fixed-rate, sterling-denominated bond market.
Bloomberg US Corporate Bond Index measures the investment grade, fixed-rate, taxable corporate bond market. It includes USD-denominated securities from US and non-US issuers.
Bloomberg US Corporate High Yield Bond Index measures the USD-denominated, high yield, fixed-rate corporate bond market. Bonds from issuers with an emerging markets country of risk, based on Bloomberg EM country definition, are excluded.
Bloomberg US Securitized: MBS, ABS, and CMBS Index tracks all USD-denominated, investment grade, securitized issues within the Bloomberg US Aggregate Index.
Bloomberg US Treasury Index measures U.S. dollar-denominated, fixed-rate, nominal debt issued by the U.S. Treasury.
The DAX is a blue-chip stock market index consisting of the 40 major German companies trading on the Frankfurt Stock Exchange.
The France 40 Index is a market value weighted index, composed of the 40 highest levels among the 100 highest market caps on the Paris Bourse.
FTSE All-Share Index reflects the equity market performance of the United Kingdom. The index includes nearly all eligible companies on the London Stock Exchange, covering large, mid, and small-cap stocks.
ICE U.S. Dollar Index is a benchmark measuring the U.S. dollar’s value against a basket of six major world currencies (Euro, Yen, Pound Sterling, Canadian Dollar, Swedish Krona, Swiss Franc).
MSCI AC Asia Pacific ex Japan Index reflects the equity market performance of the Asia Pacific region, excluding Japan, covering both developed and emerging markets.
MSCI ACWI ex USA Index captures large- and mid-cap representation across 22 of 23 developed markets (excluding the US) and 24 emerging markets countries.
MSCI China Index captures large and mid cap representation across China A shares, H shares, B shares, Red chips, P chips and foreign listings (e.g. ADRs).
MSCI Emerging Markets Index reflects the equity market performance of emerging markets.
MSCI Emerging Markets (EM) Latin America Index captures large and mid cap representation across Emerging Markets (EM) countries in Latin America. The index covers approximately 85% of the free float-adjusted market capitalization in each country.
MSCI Europe Index reflects the equity market performance of large and mid-sized companies listed in developed markets in Europe.
MSCI Europe ex UK Index reflects the equity market performance of large and mid-sized companies listed in developed markets in Europe excluding the United Kingdom.
MSCI United Kingdom Index reflects the equity market performance of large and mid-sized companies listed in the UK market.
MSCI World Index captures large- and mid-cap representation across 22 of 23 developed markets countries, excluding the United States.
MSCI World ex USA Index reflects the equity market performance of global developed markets excluding the United States.
NASDAQ Composite Stock Index: National Association of Securities Dealers Automated Quotation System (NASDAQ) is a nationwide computerized quotation system for over 5,500 over-the-counter stocks. The index is compiled of more than 4,800 stocks that are traded via this system.
Nikkei 225 Index (also known as Nikkei Stock Average): A measure of Japanese equity market performance. The index includes 225 of the largest companies listed on the Tokyo Stock Exchange.
The PHLX Semiconductor Sector Index (SOX) is a specialized, modified market capitalization-weighted index composed of companies primarily involved in the design, distribution, manufacture, and sale of semiconductors.
Purchasing Managers’ Index (PMI) is an index of the prevailing direction of economic trends in the manufacturing and service sectors, based on a survey of private sector companies.
Russell 1000® Growth Index reflects the performance of U.S. large-cap equities with higher price-to-book ratios and higher forecasted growth values.
Russell 1000® Value Index reflects the performance of U.S. large-cap equities with lower price-to-book ratios and lower forecasted growth values.
Russell 2000® Index reflects the performance of U.S. small-cap equities.
Russell 2500™ Growth Index reflects the performance of U.S. small to mid-cap equities with higher price-to-book ratios and higher forecasted growth values.
Russell 2500™ Value Index reflects the performance of U.S. small to mid-cap equities with lower price-to-book ratios and lower forecasted growth values.
S&P 500® Index reflects U.S. large-cap equity performance and represents broad U.S. equity market performance.
S&P 500® Equal Weight Index (EWI) is the equal-weight version of the S&P 500. The index includes the same constituents as the capitalization weighted index, but each company is allocated a fixed weight – or 0.2% of the index total at each quarterly rebalance.
S&P/ASX 200 Index reflects the performance of the 200 largest, most liquid companies listed on the Australian Securities Exchange (ASX).
STOXX Europe 600 Index: An index of the 600 largest listed stocks in the European equity market, comprising 17 countries and 11 industries
TOPIX: A capitalization-weighted index of all the companies listed on the First Section of the Tokyo Stock Exchange and is widely regarded as a broad benchmark for Japanese stock prices.
10-year bond: A bond that is set to mature (repay the principal value) in 10 years.
10-Year Treasury Yield is the interest rate on U.S. Treasury bonds that will mature 10 years from the date of purchase.
Agency Mortgage-backed Securities (Agency MBS): A type of asset-backed security that is specifically secured by a collection of mortgages.
Asset-backed Securities (ABS): These are financial instruments that are backed by a pool of assets—typically those that generate a cash flow from debt, such as loans, leases, credit card balances, or receivables.
Basis point: One basis point (bp) equals 1/100 of a percentage point, 1bp = 0.01%.
Bund yield: Bund yields are viewed as benchmark yield indicators for European government bonds; those with a 10-year maturity are considered to be the German equivalent of U.S. Treasury bonds.
Commercial Mortgage-backed Securities (CMBS): A type of mortgage-backed security that is secured by the loan on commercial real estate properties rather than residential real estate.
Consumer Price Index (CPI): A measure that examines the price change of a basket of consumer goods and services over time. It is used to estimate inflation.
Credit spread: The difference in yield between securities with similar maturity but different credit quality. Widening spreads generally indicate deteriorating creditworthiness of corporate borrowers, and narrowing indicate improving.
Curve/Yield curve: A yield curve plots the yields (interest rate) of bonds with equal credit quality but differing maturity dates. Typically bonds with longer maturities have higher yields.
The Federal Open Market Committee (FOMC) is the body of the Federal Reserve System that sets national monetary policy.
Fiscal policy: Describes government policy relating to setting tax rates and spending levels. Fiscal policy is separate from monetary policy, which is typically set by a central bank.
Gilt yield: Gilt yields are viewed as benchmark yield indicators for United Kingdom government bonds; those with a 10-year maturity are considered to be the UK equivalent of U.S. Treasury bonds.
Hawkish policy aims to curb inflation and slow down growth in the economy by raising interest rates and reducing the supply of money.
High yield bond: Also known as a sub-investment grade bond, or ‘junk’ bond. These bonds usually carry a higher risk of the issuer defaulting on their payments, so they are typically issued with a higher interest rate (coupon) to compensate for the additional risk.
Inflation: The rate at which the prices of goods and services are rising in an economy. The Consumer Price Index (CPI) and Retail Price Index (RPI) are two common measures.
Investment grade bond: A bond typically issued by governments or companies perceived to have a relatively low risk of defaulting on their payments, reflected in the higher rating given to them by credit ratings agencies.
JGB yield: JGB yields are viewed as benchmark yield indicators for Japanese government bonds; those with a 10-year maturity are considered to be the Japanese equivalent of U.S. Treasury bonds.
Monetary policy: The policies of a central bank, aimed at influencing the level of inflation and growth in an economy. Monetary policy tools include setting interest rates and controlling the supply of money. Dovish policy aims to stimulate economic growth by lowering interest rates and increasing the money supply.
Option-Adjusted Spread (OAS) measures the spread between a fixed-income security rate and the risk-free rate of return, which is adjusted to take into account an embedded option.
Producer Price Index (PPI) measures the average change over time in the selling prices received by domestic producers for their output.
Securitization: The process in which certain types of assets are pooled so that they can be repackaged into interest-bearing securities. The interest and principal payments from the assets are passed through to the purchasers of the securities.
U.S. Treasury securities are direct debt obligations issued by the U.S. Government. Treasury Bills and U.S. Government Bonds are guaranteed by the full faith and credit of the U.S. government, are generally considered to be free of credit risk.
Volatility measures risk using the dispersion of returns for a given investment.
Quantitative Easing (QE) is a government monetary policy occasionally used to increase the money supply by buying government securities or other securities from the market.
Yield: The level of income on a security over a set period, typically expressed as a percentage rate. For equities, a common measure is the dividend yield, which divides recent dividend payments for each share by the share price. For a bond, this is calculated as the coupon payment divided by the current bond price.
These are the views of the author at the time of publication and may differ from the views of other individuals/teams at Janus Henderson Investors. References made to individual securities do not constitute a recommendation to buy, sell or hold any security, investment strategy or market sector, and should not be assumed to be profitable. Janus Henderson Investors, its affiliated advisor, or its employees, may have a position in the securities mentioned.
Past performance does not predict future returns. The value of an investment and the income from it can fall as well as rise and you may not get back the amount originally invested.
The information in this article does not qualify as an investment recommendation.
There is no guarantee that past trends will continue, or forecasts will be realised.
Marketing Communication.